Weekly – The core CPI was dovish two weeks ago DESPITE a strong contribution from rents. We highlighted that as a constructive development at the time. Gerard updated the rent view in two notes last week (HERE and HERE) showing high-frequency measures of new rents disinflating rapidly. The underlying trend of core PCE appears to be about 2.25%. At the same time, core aggregate demand growth continues to trend at around 3%, and the near-term outlook for employment growth – which is a source of momentum – has recently brightened.
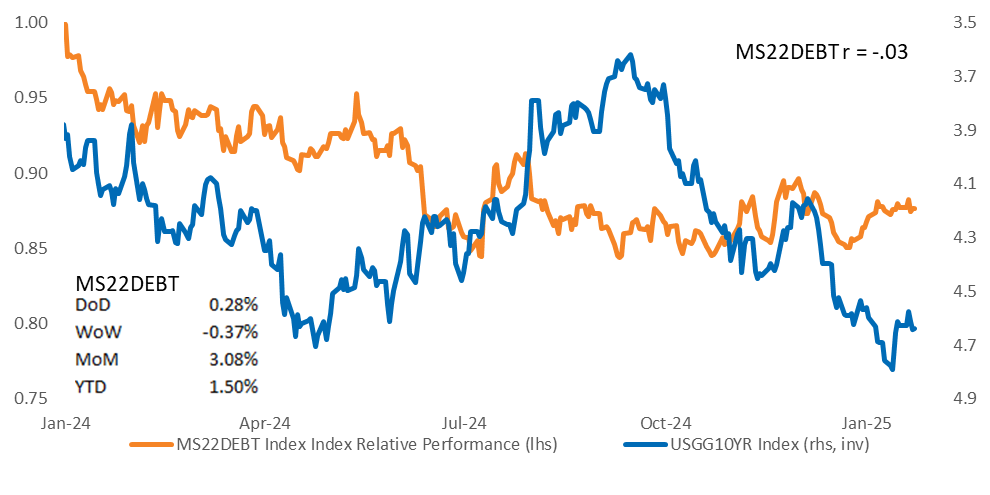
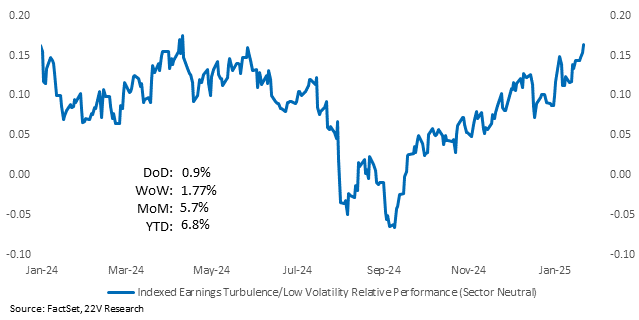
The current backdrop is one of core PCE moving lower, much more so than we expected, despite firm demand growth. Expect strong nominal GDP growth and strong market revenue estimates to be offset by tighter financial conditions. Risk factors will continue to work. The relative strength of the debt risk basket, MoM/YTD is consistent with the increase in 10yr yields being more about sustainably stronger real GDP growth than inflation risk. The Earning risk factor should continue to significantly outperform the Low Vol factor. Low Vol still has an elevated NTM PE relative to the Earnings Risk Factor (stay long MS22RISK basket).
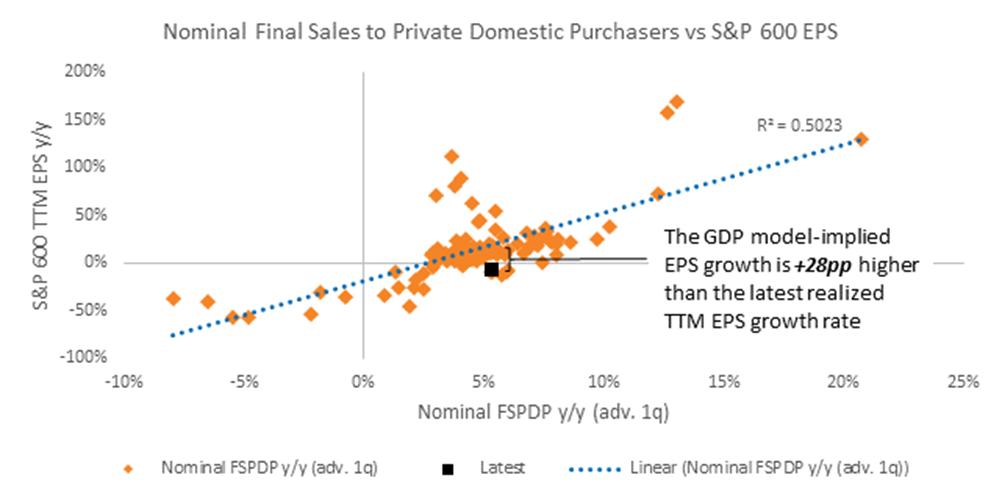
Small caps have dramatically under-earned nominal growth. That is expected to revert in 2025. There is little reason to fade that view. This is a large part of the reason we favor small caps in 2025.
Marking to Market 10yr Skew – Longer term, demand growth seems likely to cool on its own – that is, without a nudge from the Fed – as slower population growth reduces potential GDP growth. This changes the skew around 10yr yields. There is more downside risk to 10yr yields, WITHOUT RECESSION RISK INCREASING, than we previously thought. Disinflation with firm growth means there is more downside inflation risk as/if demand growth slows some.
The practical implication of the change in 10yr skew is as follows – If economic growth starts to slow some, led by easing of consumer services sectors, and 10yr yields decline, the housing/durable goods parts of the economy should be able to recover. Recall, to keep the economy in balance given the strong consumer service sector, 10yr yields have increased and slowed housing/durable goods. If housing/durable goods had not been weak when the consumer service sector boomed, demand growth and inflation would have been much higher.
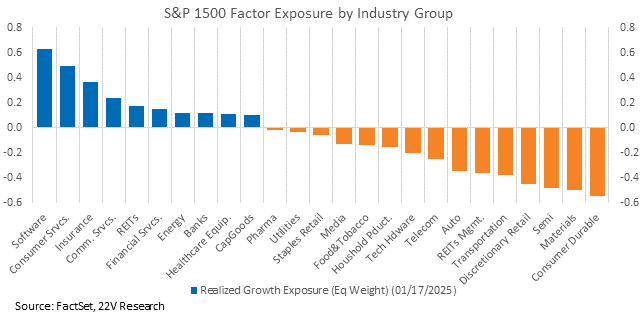
Factor & Sub Industry Group Implication: The second largest sub industry group exposure in the Growth basket is consumer services. The largest underweight in the Growth factor is Consumer durables. A slowing in economic growth, from slowing population growth, has important implications for sectors and factors. Durables would outperform services is the big takeaway. Transports ex – Airlines would benefit in theory.
Some slowing in economic growth from slowing population growth is a longer-term theme (over the course of 2025/2026). Until that shows up, don’t expect strong nominal GDP growth and strong market revenue estimates to be offset by tighter financial conditions.
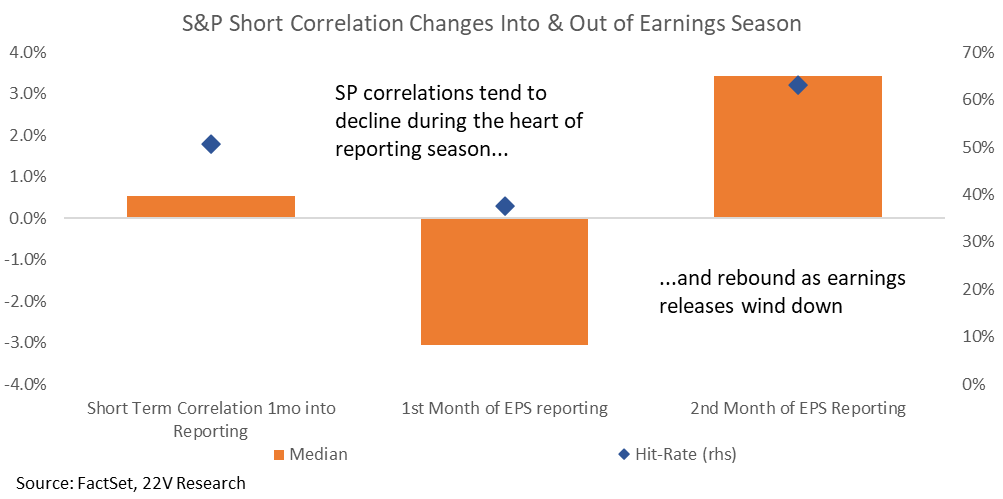
Correlations should move lower through earnings season. Last week fundamental factors took the leadership. Fundamentals being a driver is what you would expect in a lower correlation backdrop. Focus on your favorite long or short opportunities and worry less about the macro backdrop disrupting the fundamentals over the coming months. As you can probably tell, many of our calls will go sideways if the benign tariff impact assumptions are wrong.
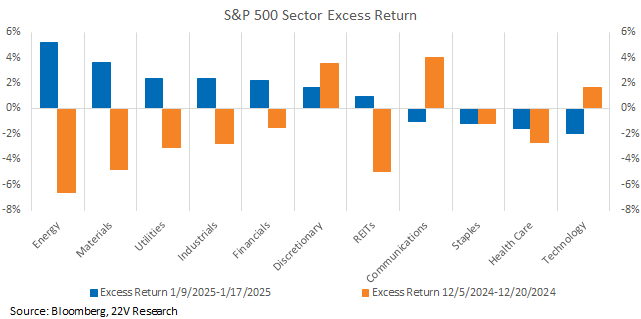
Historically, lower unemployment readings favor more Risk-on and Value driven internals. As we noted (HERE), combining sensitivities to unemployment and inflation, a lower unemployment rate together with stable inflation (our call) favors Energy, REITs, and Financials while Communications, Tech and Health Care underperform. Higher unemployment and in line inflation led those sector performances to reverse.
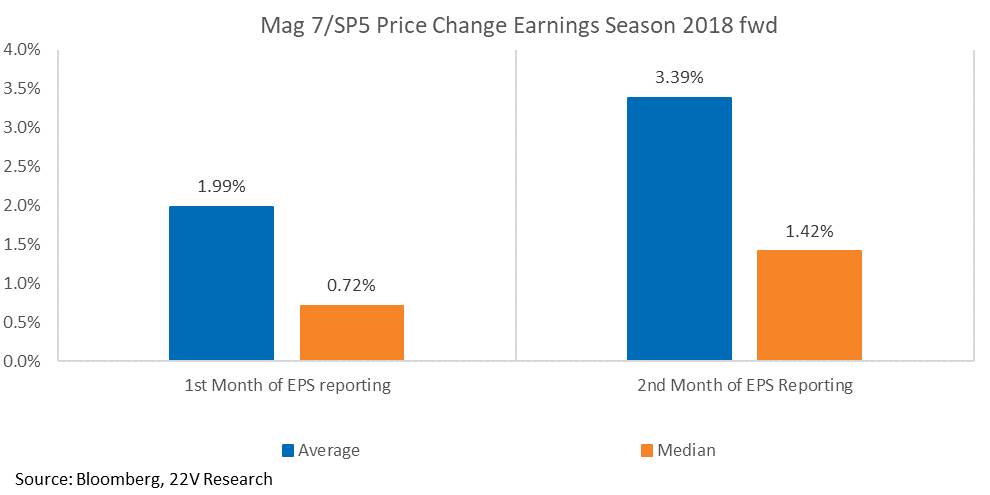
Value, Deep Cyclicals and Small caps would work relative, along with foreign markets, IF the US exceptionalism trade reverses. To be clear, we are not short the meg caps. Many have yet to report, and earnings season has been VERY positive for those names over the past few years. We are just noting that the macro backdrop driving the “US exceptionalism” narrative (USD going straight up) is likely to be less of a tailwind as European/China growth stabilizes. Assuming our benign tariff policy outcome call is correct.
Charts & Commentary Below…
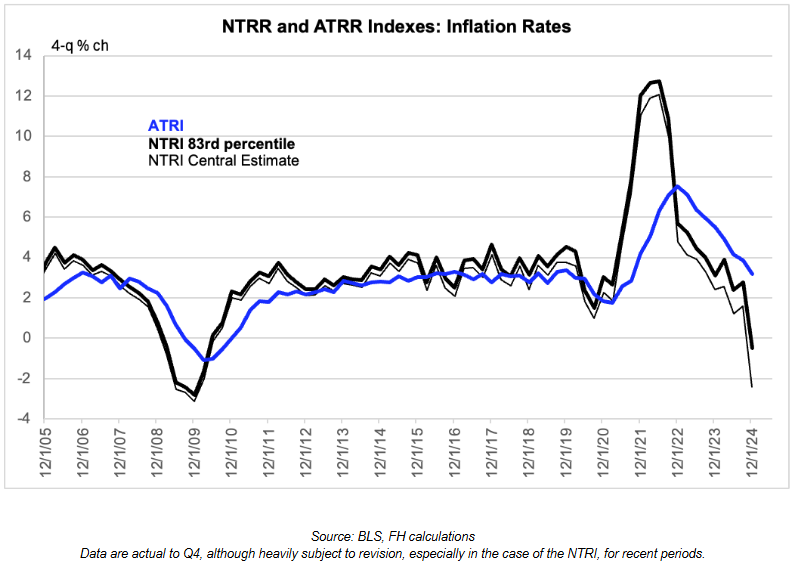
Indicators: As we highlighted after CPI (HERE), core CPI was dovish despite a strong contribution from rents. That was a constructive development as our view is government measures of rents will obviously fall. Marking to market that view, Gerard highlighted in two notes last week (HERE and HERE) that the BLS NTRI/ATRI new rents readings shows rents disinflating rapidly. They stalled for a bit but hooked over again. The CoreLogic Single Family Rent Index (SFRI), which is a better measure of rents than the NTRI/ATRI, was released as well. It slipped again and is at a 14-month low. Bottom line, expect inflation to continue to be a non-issue for the expansion. Stronger data is unlikely to lead to tighter financial conditions.
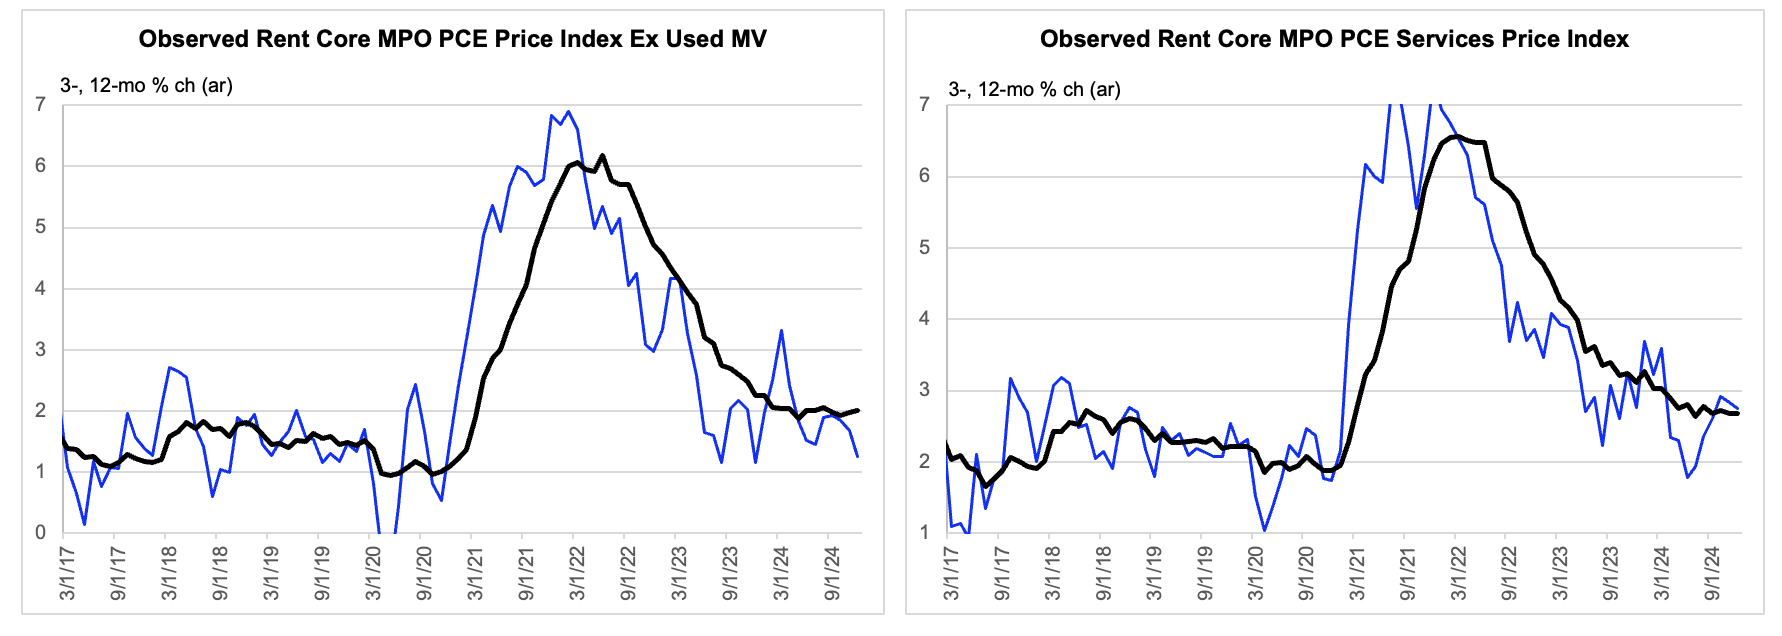
What Gerard calls the single best measure of goods and services price inflation (below) is tracking up just 10 bps, based on the detail from CPI and PPI. The 12-month inflation rate there is stable at just under 2.1%, consistent with underlying inflation of about 2 ¼%. Services inflation, taken in isolation, is running just slightly hot relative to that.
Source: BEA, FH calculations and inferences from informed consensus
Data are actual to November and estimated for December.
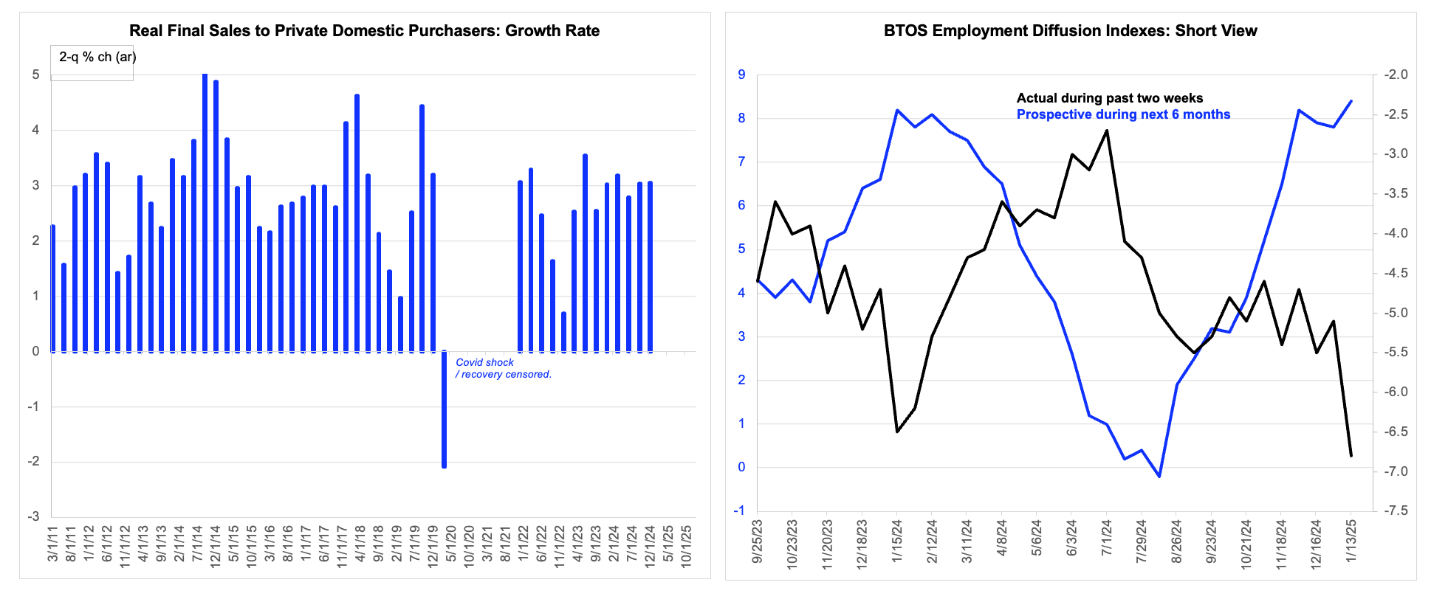
Core aggregate demand growth continues to oscillate around 3%, which is slightly above recent
potential. As potential growth presumably slows, so too should demand growth, and without the
need for a nudge from financial conditions. But a shift to below-potential growth seems unlikely.
Source: BEA, Census, FH calculations and estimate
Core aggregate demand is actual to Q3 and FH estimate for Q4, which is in line with consensus. BTOS data are actual to second week of January.
If economic growth slows some, led by easing in the consumer services sectors, and 10yr yields decline, the housing/durable goods parts of the economy should be able to recover. Recall, to keep the economy in balance given the strong consumer service sector, 10yr yields have increased and slowed housing/durable goods. If housing/durable goods had not been weak, as the consumer service sector boomed, demand growth and inflation would have been much higher. FYI – the second largest sub industry group exposure in the Growth basket is consumer services. The largest underweight in the Growth factor is Consumer durables. A slowing in economic growth, from slowing population growth, has important implications for sectors and factors.
It is typical for correlations to decline as new fundamental data is released through earnings season. The past few earnings seasons were associated with macro concerns (employment last July, the election in October).
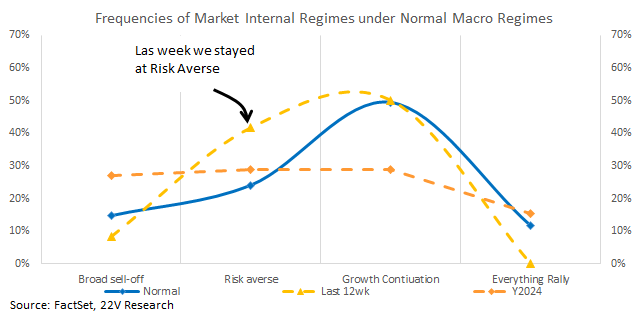
Internally, both Risk-on and Risk-off factors had negative sensitivity across indices. Fundamental factors took leadership as expected. Fundamentals being a driver is what you would expect in a lower correlation backdrop. Focus on your favorite long or short opportunities and worry less about the macro backdrop disrupting the fundamentals over the coming months.
We assume nominal GDP growth in 2025 is in the 5%ish range. Modeling GDP to revenue is imprecise, but we’ll stick to the central case here, implying S&P revenue growth up +7.6%. Small caps have dramatically under-earned nominal growth. That is expected to revert in 2025. There is little reason to fade that outlook. This is a large part of the reason we favor small caps in 2025
Source: 22V Research, Bloomberg
Stabilization in the USD should slow the pace of gains in the US exceptionalism trade (Mega cap/S&P 100). Also, Value, deep cyclicals, small caps are not considered part of the exceptionalism trade. As we understand it. So, Value, Deep Cyclicals and Small caps would likely work relative, along with foreign markets, if the US exceptionalism trade reversed some. To be clear, we are not short the meg caps. Many have yet to report, and earnings season has been VERY positive for them the past few years. We are just noting that the macro backdrop driving the “US exceptionalism” trade (USD going straight up) is likely to be less of a tailwind.
If we were NOT in a disinflationary boom, the 22V Debt risk basket would likely be performing much worse given the increase in 10yr yields. The relative strength of the debt risk basket, MoM/YTD is consistent with the increase in 10yr yields being about sustainable stronger real GDP growth than inflation risk.
Source: Bloomberg, 22V Research
Historically lower unemployment readings favor more Risk-on and Value driven internals. That has been the case for most of the past few years, though, that relationship is at risk IF stronger employment readings become associated with firmer inflation expectations (not our call).
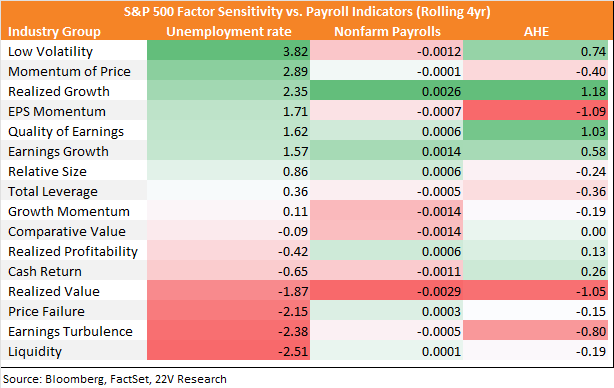
As we noted (HERE), combining sensitivities to unemployment and inflation, a lower unemployment rate together with stable inflation favors Energy, REITs, and Financials while Communications, Tech and Health Care underperform. Higher unemployment and in line inflation led those sector performances to reverse.
We remain long the Earnings risk factor and short the low vol factor. Earnings risk benefits from a lower unemployment rate. Low Vol factor does not. The Low Vol factor still has an elevated NTM PE relative to the Earnings risk factor.
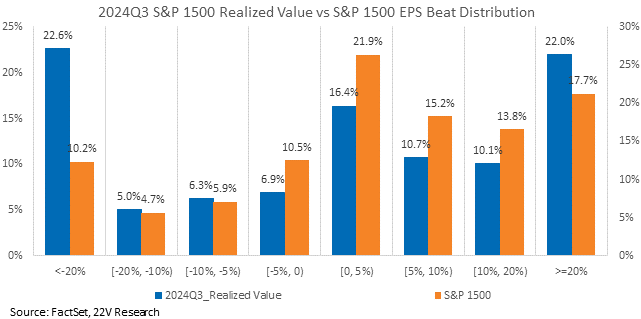
The Case for Value – More confidence that the normal economic backdrop will continue has helped Value stabilize in-line with its typical performance in normal economic backdrops. But given strong demand growth, one inflation print is not enough to nullify the risk that financial conditions need to tighten. The conditions for Value continuing to work are 1) more soft inflation prints (core PCE continuing to track <2.5% ar), and shorter-term, 2) a better earnings season than 3Q. Also, 3) our base case for limited tariffs. The chart below shows the distribution of beats and misses for Value vs. the S&P 1500 in 3Q24. More Value companies beat earnings estimates by more than 20%, but many more Value companies also missed by more than -20%. Overall, the index had a better beat rate than Value (68.6% vs 59%) and did not have the left tail of Value.
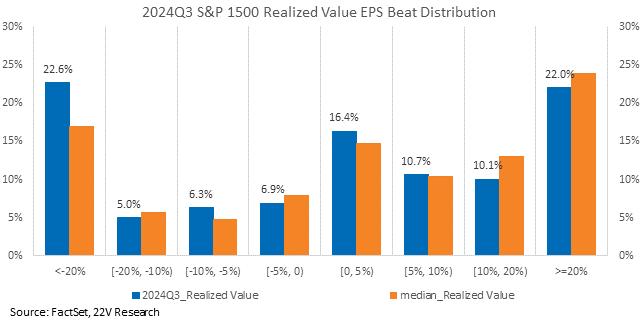
Value earnings were worse than normal in 3Q. Value companies need to realize better earnings expectations for price performance to continue stabilizing short-term. The normal economic backdrop, at least, supports this.
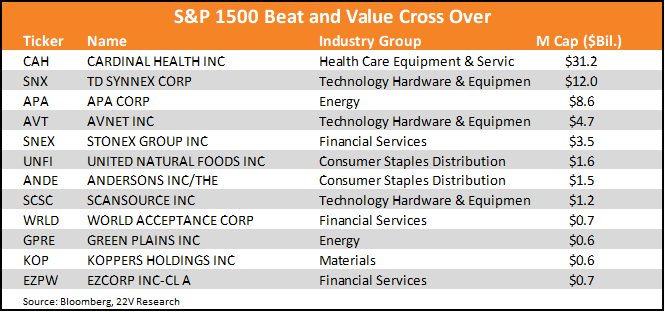
We are focused on our earnings beat and miss baskets as earnings season gets underway. Historically, companies with high Quality factor scores and positive earnings sentiment (via an NLP tool reading earnings transcripts) have better earnings beat rates than the overall index, and companies with high Earnings Risk factors scores and negative earnings sentiment have a worse beat rates. See HERE and HERE for more. Below are the Value stocks that are in our earnings beat basket. These are interesting longs for earnings season…
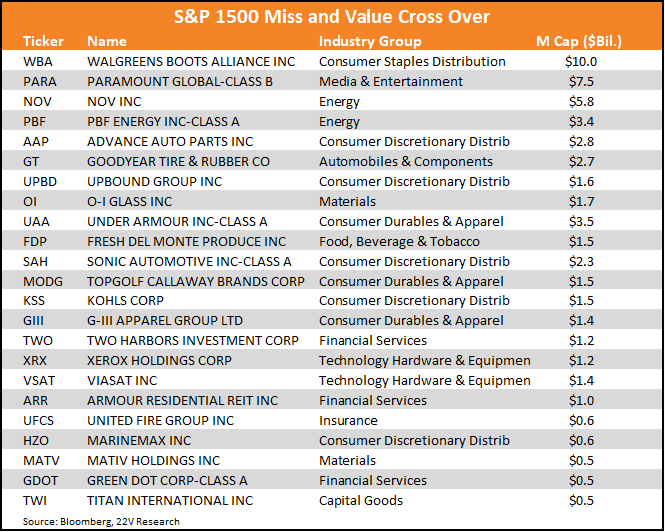
…and here are Value names in the miss basket, which we would be cautious about. There are 150 names in our S&P 1500 Value formulation, so the overlap of these lists total is small.