

This note is going to be brief, because it is important that you read it and because it is important not to obscure its main point with unnecessary detail, which I have covered in gory detail elsewhere. The BLS’s new research series, NTRI and ATRI (as I call them, in the interest of symmetry) were updated to the fourth quarter yesterday. And that update strongly suggests that the Covid-related rent inflation overshoot is over.
This may take several more months to be reflected fully in the lagging measures of average rents published in the CPI and therefore PCE Price Index, although they too have hinted strongly at disinflation. But anybody interested in what is happening right now at the margin, which will include the Fed, will be emboldened by this latest release, at least if they are paying attention and know how to interpret these data properly, which again will include the Fed.
New research series from BLS show marginal rents disinflating rapidly, with average following

Source: BLS, FH calculations
Data are actual to Q4, although heavily subject to revision, especially in the case of the NTRI, for recent periods.
During the four quarters to Q4, the NTRI is reported to have fallen 2.4%. The consensus will be inclined to pay insufficient attention to this for two reasons. First, the rate of inflation in the NTRI does not seem to be related reliably to the rate of inflation in ATRI or in the government measures of average rents that the ATRI is designed to lead by about a quarter. The premise of the skepticism is valid, because the lags separating inflation in marginal and average rents (even leaving aside measurement issues) are not stable, because of the error correction effect (gap in levels) that I have been emphasizing for a few years now. But that is not a good reason to ignore the NTRI because its level is systematically linked to the level of the ATRI and the lagging government measures of average rents. It is a bit of a mystery to me that the consensus has still not internalized this simple point.
The second reason people pay insufficient attention to the NTRI is that the current vintages of it are heavily subject to revision. I will address below why this is not a major issue when considering the index in level terms, which is the best approach. However, even if we think of the rate of inflation in the NTRI, it is worth recognizing that the BLS produces a measure of the standard error around the NTRI in real time. And applying that standard error suggests that there is a 5 in 6 chance that the annual rate of inflation in the NTRI (corrected for its error in real time measurement) is now negative. I will go with the remaining 1 in 6 because of my own priors, but the data here speak for themselves and are good news.
The level data are compelling
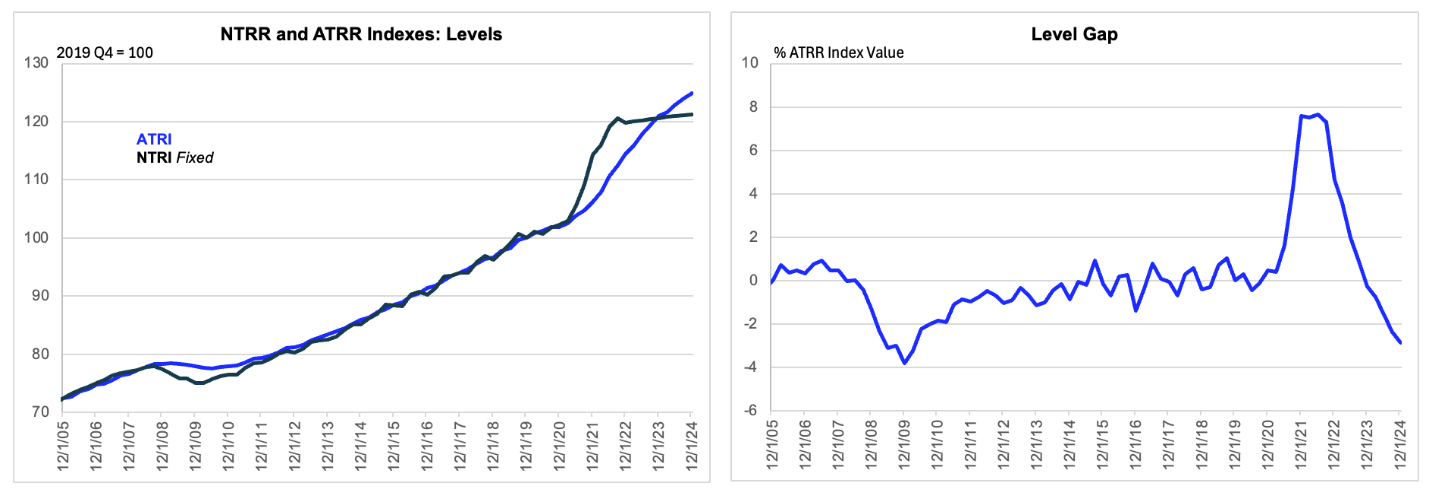
Source: BLS, FH calculations and over-writing of NTRI for last 8 quarters
BLS data are actual to Q4, although partly corrected as mentioned.
The research linked above suggests that for the most recent periods, say up to two years, the rate of inflation in the CoreLogic SFRI may be a better measure of how the NTRI will look upon ultimate revision than the current vintage of the NTRI itself. We can take advantage of this fact by correcting the last eight observations of the NTRI with what the index would look like if it were replaced with what is implied by the rate of inflation in the SFRI. With that correction in place, marginal rents, as measured in the “fixed” NTRI now look to be 3% below average rents as measured in the ATRI. Gun to head, I would guess that gap is closer to zero, as I have been emphasizing. But at the margin, this calculation suggesting it is below 0 is constructive.
Finally, there is a technical issue here that is, again, widely overlooked by the consensus. The 4-quarter change of the NTRI is poorly measured in its current vintage, which is why the standard errors estimated there in real time are so wide, as noted. But it does not follow from that, necessarily, that the level of the NTRI in any one period will be far off. And that is important for those, like me, who think the reported level is the most important.
Note, for example, in the chart below that the very first vintage of the NTRI data published through the third quarter of 2023 five quarters ago have not been revised that much in level terms, even as the passage of time has allowed the sample size for that period to increase steadily. The practical implication of this is that we should assign some weight to the most recent vintage of the NTRI whose level, uncorrected and corrected, suggests that the gap between marginal and average rents has closed. Indeed, one could go further and claim it has switched signs, although I feel no need to do that. I am emboldened that the rent overshoot is over. That is enough.
Even the current vintage of the NTRI has useful information when taken in level terms
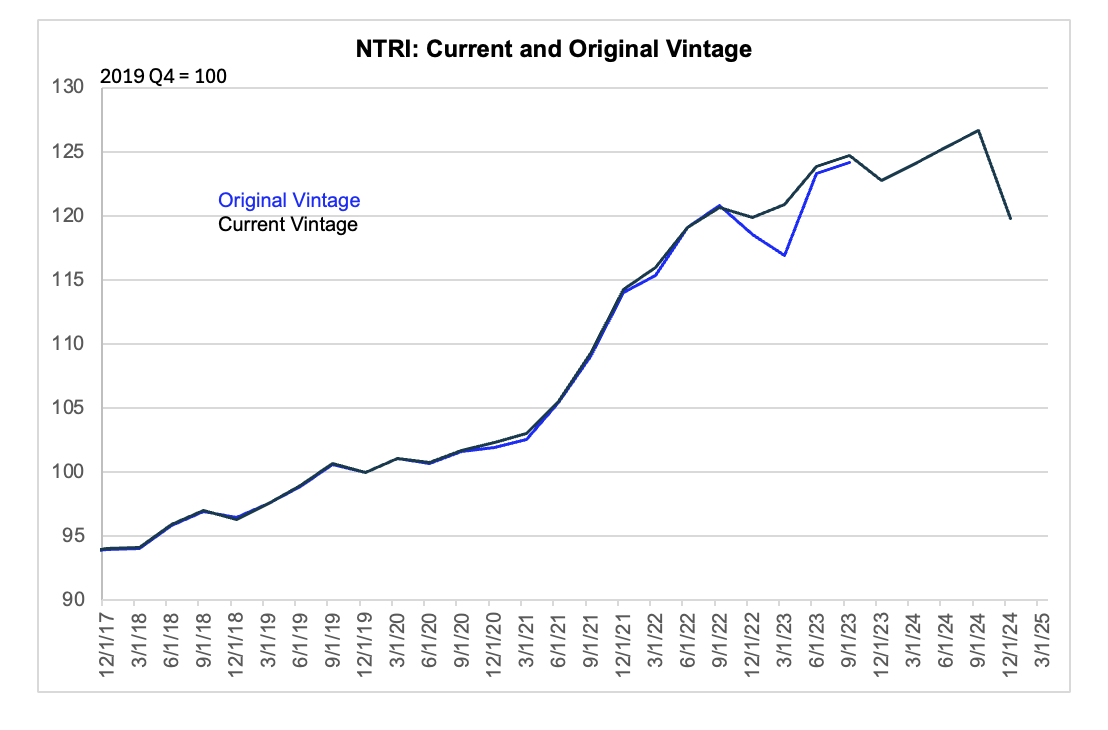
Source: BLS, FH calculations
Current vintage data are actual to Q4, although subject to revision, perhaps more in rate of change than level terms

