Summary: Economic growth has been much stronger than investors and the Fed expected. FOMC estimated below trend GDP for 2024 (below 2%), investors we surveyed the first week of January thought growth being too weak was the biggest risk to markets (HERE), and the Bloomberg consensus of economists had a 50% probability of a recession in 2024. The FOMC minutes made it clear that the Fed continues to be surprised at the strength of economic growth. Powell/Waller, etc’s., less dovish tone shift from been a result of much lower odds of weak economic growth and labor market tail risk. Inflationary tail risks have NOT increased (See Peter Williams post FOMC minutes note HERE).
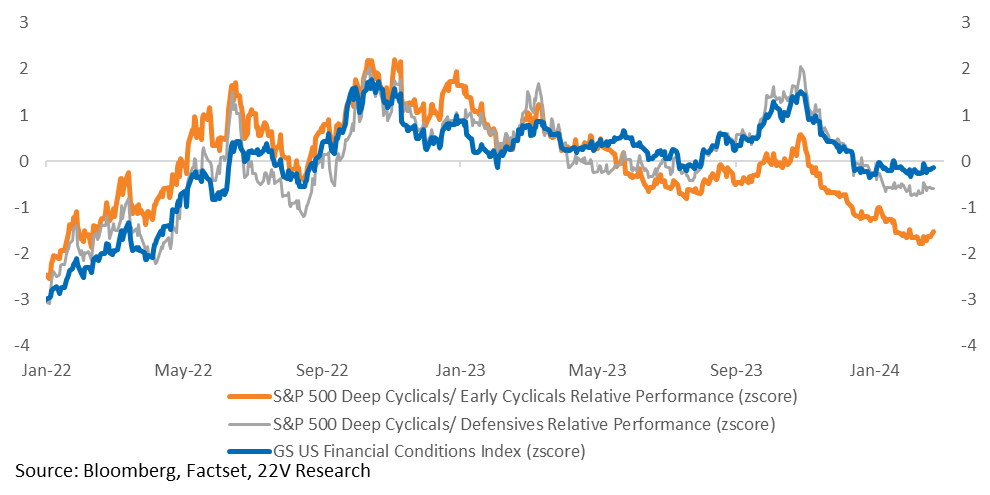
Firmer economic growth is the main driver of reducing rate cut estimates, which means financial conditions do not need to tighten, and the S&P can move higher, led by Cyclicals. If increased inflation tail risks were the main driver of fewer cuts, financial conditions would be significantly tighter and Defensives outperforming.
High Nominal Rate Argument for Weaker Econ Growth Not a Focus Now: Arguments that a 5.3% Fed funds rate or +4% 10yr yields are weighing on the economy now or with lags continue to fall by the wayside. Recent Fed commentary has highlighted declining concerns about the risk of keeping the funds rate too high for too long. Firming housing data (see Peter Housing report HERE) and tremendous wealth effects that are supporting the current low savings rate, suggest the economy is adjusting to higher rates. To put it differently, strong nominal demand needs higher equilibrium interest rates to keep economic growth and inflation in check. Investors thinking the post-GFC economic world of persistent disinflation is the norm have a tough time internalizing higher nominal interest rates not being as restrictive.
Keep in mind, the post-GFC world was associated with significant deleveraging that is NOT present today.
Bottom Line: The 22V view is that the inflation data continuing to be ‘good enough’ and will allow the Fed to begin cutting in 2024. The number of cuts will be driven by activity data. We have been harping on this point all year. 6+ cuts were not going to happen in a 2-2.5% GDP growth backdrop (see 2024 Outlook here). Our call has consistently been 3-4 cuts with 2-2.5% Real GDP growth and that is a positive for risk assets. The greater risk has been that too strong economic growth and inflation could lead to zero cuts.
What Now for Market Internals & Cross Asset Class Returns: Our call for 3-4 cuts is priced and favors a broadening out of market leadership, GARP outperforming, better performance from Small and Mid caps, and the Low Vol Factor to Underperform. Basically, what happened last week. Expect the USD to be range bound and UST yields to stay in their current range.
The Payroll data on March 8th will be the next large volatility event. Assuming the economy plays out in the way we are forecasting (wages continue to slowly move lower and demand growth stays around current levels), the data is likely to be less hawkishly surprising. If the January core inflation data proves to be sticky (it wasn’t just a January effect driving the upside), and wage growth remains firm, we are likely to see the current base case of 3-4 cuts evaporate quickly.
Please Read: What happens if markets start pricing FEWER than 3 cuts? Or no cuts? How good or bad would that be? Investors will need to focus on “why” the Fed is cutting rather than the number of cuts. There are good no-cut scenarios for risk assets and ban no-cut backdrops. Two scenarios under that framework stand out.
Ok 0-2 Cuts Scenario: If economic growth is firm but inflation won’t be close to 2.3% by year end. This is not a problem IF core PCE is around 2.7% and higher rates are REQUIRED to keep inflation in check. That backdrop doesn’t mean higher recession risks or lower asset prices. This is the scenario playing out NOW and why financial conditions haven’t tightened. Investors adjusting to inflation and growth moving lower more slowly than previously thought. If a 5.3% funds rate is not as restrictive as we thought, markets do OK, but volatility will be higher, and the potential overhang from higher rates could be a headwind for leveraged/small cap/Earnings Turbulence names (see our Small Cap Survey HERE). FYI – that overhang should fade if 4.5% 10yr yields do not crush the economy.
The Bad 0 Cut Scenario: Forecasters become more confident core PCE will move back above 3% (wages stay too firm and goods inflation subsides. See Peter Williams view of this risk HERE). If that happens, the Fed will need to tighten FCI again to slow growth more quickly. That is bad for risk assets and means higher medium-term recession risks. Bottom line, the major problem for markets is >3% core PCE and the Fed making it explicit they want slower economic growth.
Bottom Line: Knowing the number of cuts doesn’t help with market calls (headline or internal) unless we also know the WHY. Fed officials are pushing back on cuts now because growth is firm. That is not bad for risk assets, and it explains why financial conditions have not tightened. If Core PCE forecasts move above 3%, that is a major problem for risk assets. FCI would likely tighten.
Early Cyclicals Supporting Profitability: 4Q earnings are winding down with ~90% of names reported. Earnings remained strong consistent with strong economic data in the back half of 2023. FY23 S&P EPS are now estimates to be $216.8 and NTM EPS are running at $242. Early Cyclicals including Tech, Communications and Discretionary all reported strong y/y earnings and sales growth and most Mega 7 beat estimates (ex TSLA). Earnings, driven by strong margins, remain a support for risk assets in general and Cyclicals in particular.
Charts and commentary below…
Indicators: Arguments that a 5.3% Fed funds rate or +4% 10yr yields are weighing on the economy now or with lags continue to fall by the wayside. Economic growth has been much stronger than investors and the Fed expected. FOMC estimated below trend GDP for 2024 (below 2%), investors we surveyed the first week of January thought growth being too weak was the biggest risk to markets (HERE), and the Bloomberg consensus of economists had a 50% probability of a recession in 2024. The FOMC minutes made it clear that the Fed continues to be surprised at the strength of economic growth. Powell/Waller, etc’s., less dovish tone shift from been a result of much lower odds of weak economic growth and labor market tail risk. Inflationary tail risks have NOT increased (See Peter Williams post FOMC minutes note HERE).
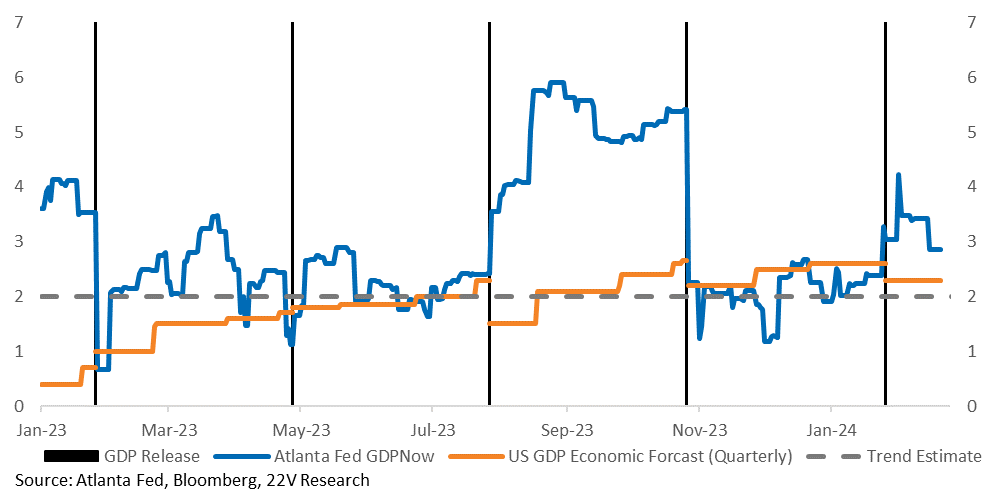
The 22V view is that the inflation data continuing to be ‘good enough’ and will allow the Fed to begin cutting in 2024. The number of cuts will be driven by activity data. We have been harping on this point all year. 6+ cuts were not going to happen in a 2-2.5% GDP growth backdrop (see 2024 Outlook here). Our call has consistently been 3-4 cuts with 2-2.5% Real GDP growth and that is a positive for risk assets. The greater risk has been that too strong economic growth and inflation could lead to zero cuts.
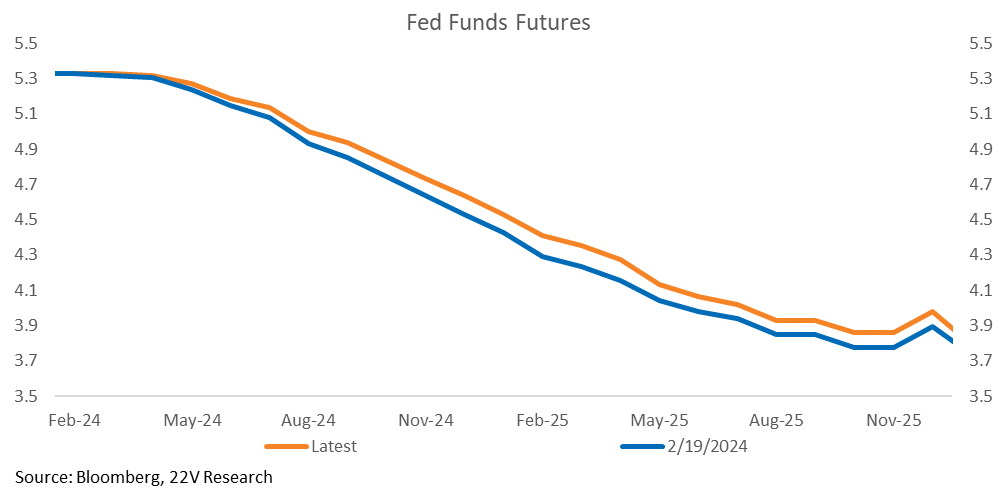
The focus should be on “why” vs the mechanics of how many rate cuts. There are two scenarios. 1) The Fed does not cut because economic growth is firm, and inflation is not going to be as close to 2.3% by the end of the year as the Fed forecasted. This is not a problem if core PCE is around 2.7%. 10yr yields at higher levels and a stable fed funds rate is REQUIRED to keep inflation in check under this scenario. That does not drive recession risks much higher or imply much lower asset prices.
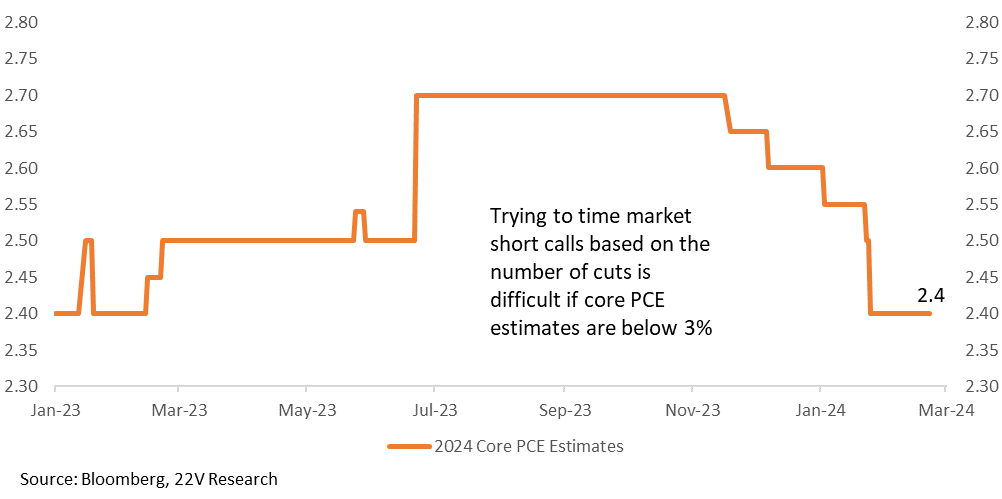
2) Core inflation is estimated to remain above 3% (wages stay too firm and goods inflation subsides). In this case, the Fed likely needs to tighten FCI again, which is bad for risk assets. Trying to time market short calls based on the number of cuts is REALLY hard if core PCE estimates are going to be below 3%. The major problems for asset prices come with >3% core PCE and the Fed making it explicit they want economic growth to slow.
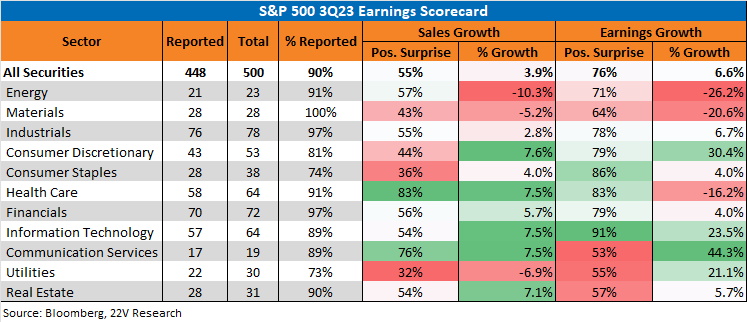
4Q earnings are winding down with ~90% of names reported. Earnings remained strong consistent with strong economic data in the back half of 2023. FY23 S&P EPS are now estimates to be $216.8 and NTM EPS are running at $242. Early Cyclicals including Tech, Communications and Discretionary all reported strong y/y earnings and sales growth and most Mega 7 beat estimates (ex TSLA).
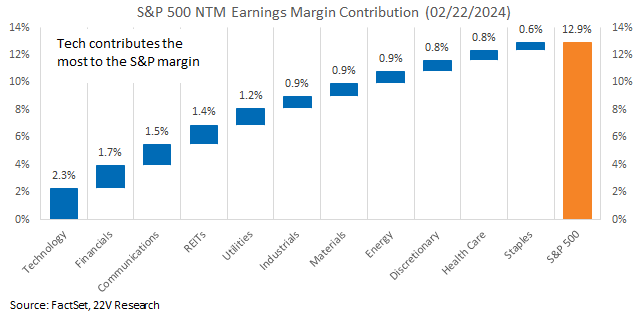
Margins for the S&P again beat expectations. Technology, Financials and Communications were the biggest contributors to S&P profitability. All sectors were positive, but the margin contribution from Early Cyclical sectors all increased in 2023 at the expense of Deep Cyclicals (with the exception of Industrials) and Defensives.
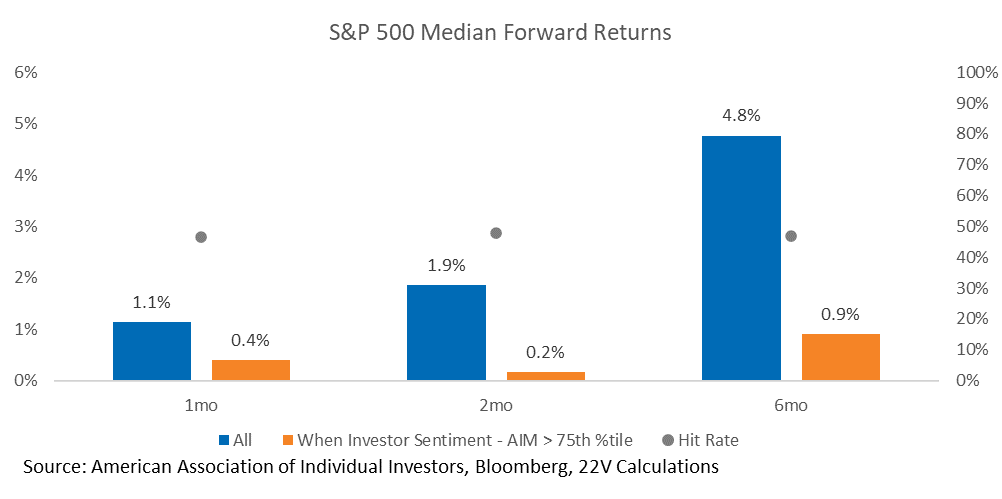
What Now for Market Internals & Cross Asset Class: Investor sentiment has perked up, outpacing the improving breadth of economic data. The spread between AAII net sentiment and our US AIM indicator, which is an aggregation of economic data improving/deteriorating from its prior reading, has reached its 75th percentile.
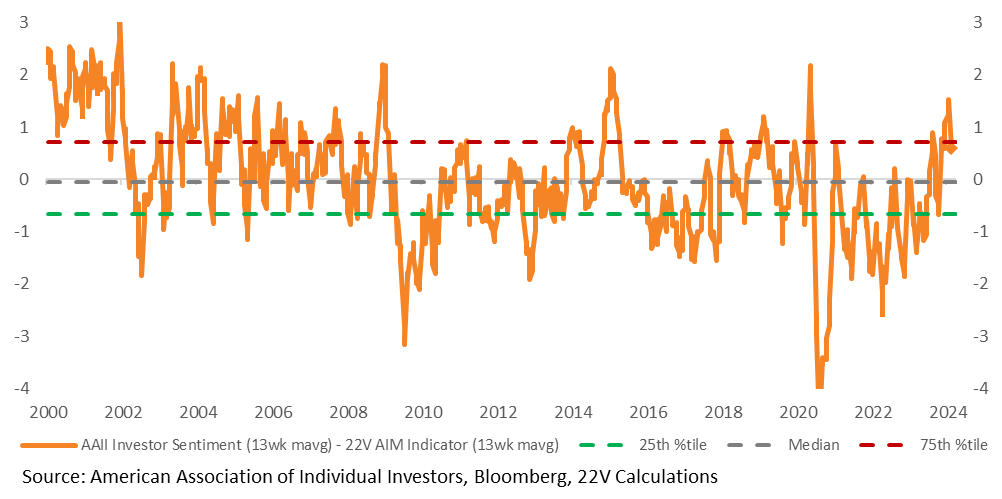
Forward returns for the S&P are worse than normal when the spread is at or above its 75th percentile. Worse data is better for risk-on internals because the Fed needs slower data, but our view on the overall index is muted. We don’t think the S&P as a whole moves higher with slower economic growth, as that is a tailwind for the average stock vs mega caps.
3-4 Fed cuts favors a broadening out of market leadership, GARP outperforming, better performance from Small and Mid caps, and the Low Vol Factor to Underperform. Basically, what happened last week. Expect the USD to be range bound and UST yields to stay in their current range.
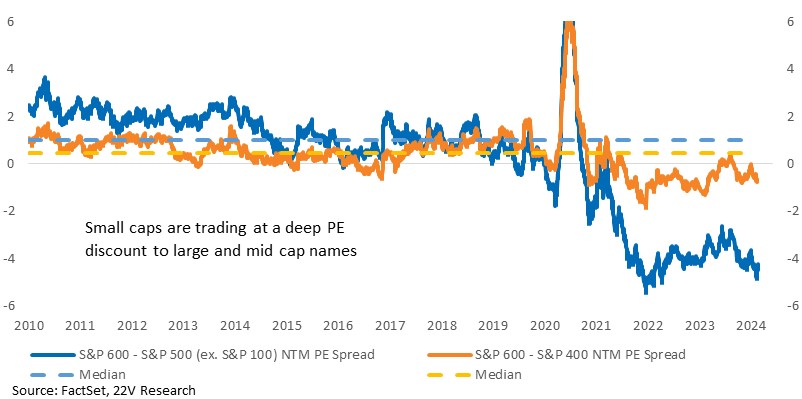
Small caps are trading at a deep discount to larger (large and mid) cap names, even if we exclude mega caps. The S&P 600 Index NTM PE spread with the S&P ex the top 100 market cap stocks is near the low end of its post-GFC era range. The spread reflects concerns towards the economic cycle and any evidence supporting the cycle extension should support small cap laggard catch up (HERE). That helps explain the volatility between small vs. large cap names and recent small cap improvement in February.
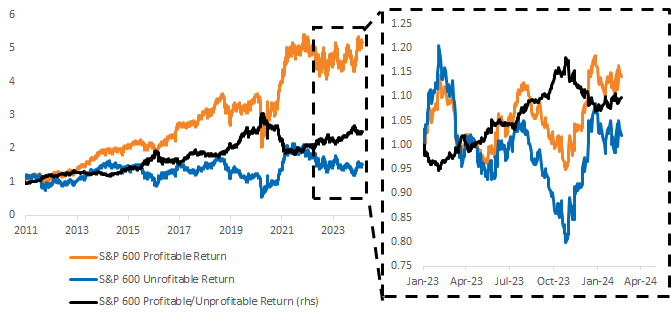
Breaking the S&P 600 into profitable and unprofitable groups shows returns for profitable names have been consistently stronger over time. We define profitability using trailing 12mo EBEX, rebalancing monthly to capture new earnings data. There are more sophisticated ways of parsing this universe, but the point we mean to illustrate is that focusing on profitability is a straightforward and easy to apply method of boosting returns within small caps.
Source: FactSet, 22V Research
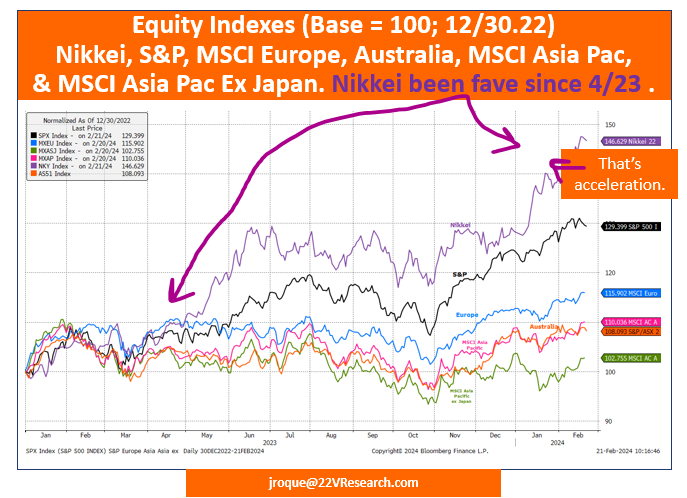
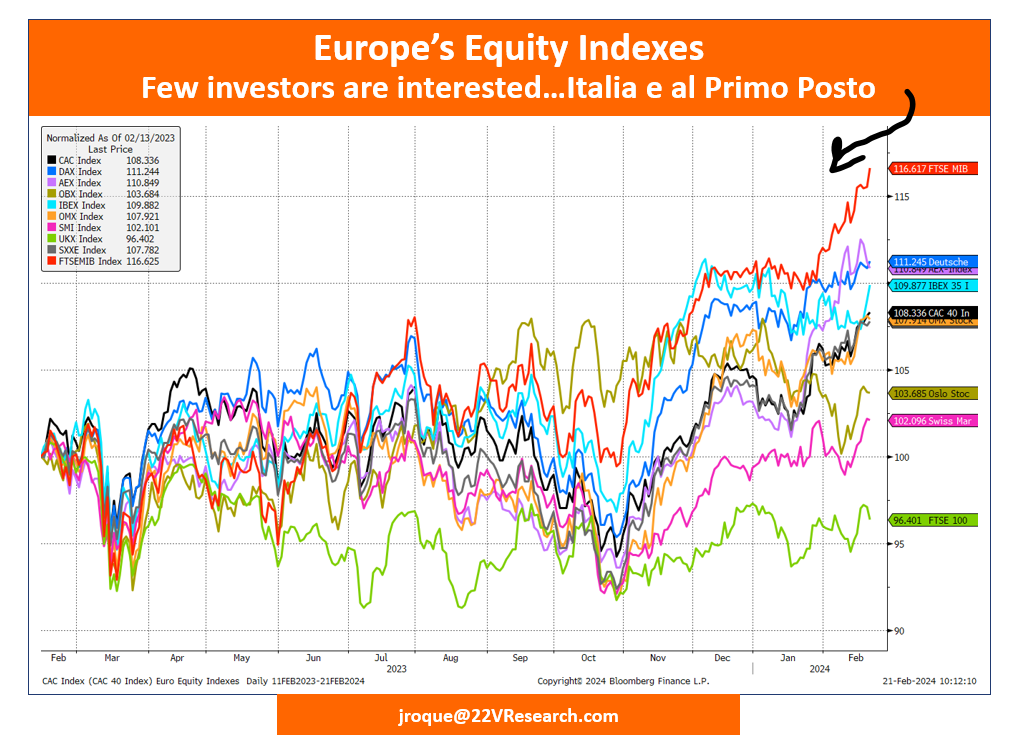
As we noted (HERE), the rapid pace of the S&P rally to start the year is hard to sustain and some consolidation should be expected. 22V Technician John Roque has some global markets that he likes and has been watching. John believes that there are – and have been for some time (a la Japan and India) – other markets that offer investors alternatives to the US. These markets include Japan, France, Germany, Italy, Spain, India, Australia, and Taiwan (charts below).