SUMMARY – Please Read This One: Risk on vs. Risk Off Factor Vol and Small Cap Vol has been historic this week. Today we attempt to explain 1) Why 2) How To Think about it going forward and 3) Why we maintain our risk on rotation call.
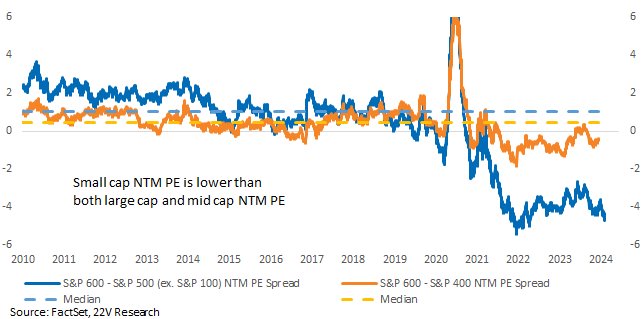
Here it Goes: The spread between risk-on factor and Low Vol PE and large vs Small cap PEs is unusually wide. Even excluding S&P 100 names, the PE spread between large and Small is still historically wide. It is not just a mega 7 issue. The unusually high PE spread exists because of questions of how long this economic Cycle can last. That is the main reason. You own higher quality S&P names if you are concerned about recession risk being high in the next 8-12 months. Recession risk remains high because of lagged impact of past tightening concerns (this has faded fast) or the Fed having to tighten FCI more concerns (the problem this week).
Mega dominating the economy at the expense of all other companies is important, but secondary. It’s not the reason for the 5th%tile PE spread vs Large and Small. Again, that PE spread exists even Ex the S&P 100. The spread widened out RIGHT as the Fed started to tighten. Anything that lowers or increases odds the economic Cycle will extend leads to unusual Vol in risk on factors and Small caps given the PE spreads are so wide.
How to Think About The Backdrop: When the odds increase that core inflation will move back towards the Fed’s target, without a large increase in the urate, the odds that the economic cycle can extend for the next 3-5 years increase. Small caps and risk on factors should rerate higher in that scenario. Financial Conditions can ease without the worry of inflation moving back up. Inflation remaining stuck at too high of a level for longer, which would encourage tighter financial conditions for longer, keeps year ahead recession risk unusually high. See Bloomberg consensus recessions odds for 2024 still being at 45%. Down from 80%+ last year but is still unusually high. Small caps and Risk Factors do poorly in this backdrop. The PE spread stays wide.
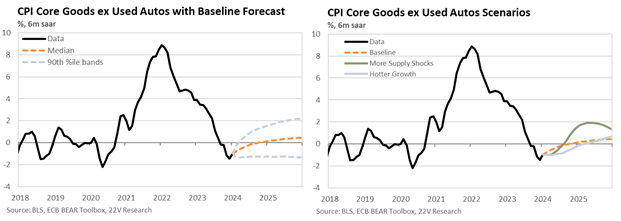
The main driver of cycle extension odds, which drives risk on vs risk off internals, is if services inflation ex housing can move lower without more FCI tightening. As Peter Williams pointed out yesterday, “core goods ex used autos is likely to exit outright deflation in mid-2024 on a m/m basis, with 6m measures turning positive in late-24 or early 2025. The most important impact of this forecast is that by the end of the year disinflationary forces are going to have to increase from core services ex housing and housing to keep inflation on a downward trajectory”. Bottom line, if core services ex housing inflation isn’t moving lower, the risk CPI stays too high is introduced. The Fed can’t cut potentially. FCI would tighten and risk on factors/small caps suffer. Bad things happen.
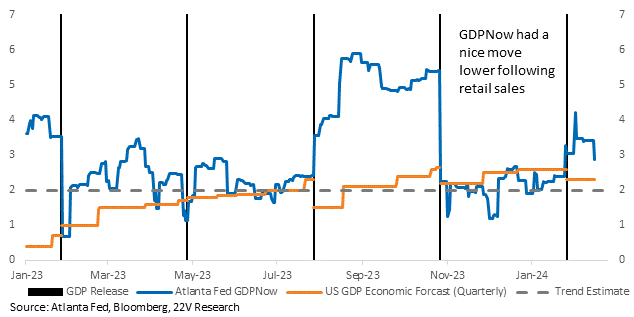
Service Inflation Monitoring Is Key – Yesterday Was a Good Day: Retail sales came in weaker than expected and the Atlanta Fed GDPNowcast came down again. Recall, the Atlanta Fed Nowcast hit 4.2% on Payroll Friday and is now down to 2.9%. That is a good thing because well above trend growth (above 2%ish) increases inflation/tightening risk. Service inflation is unlikely to come down if economic growth is 3%+ real and the labor market is tight. If economic growth is closer to 2-2.5%, core service inflation is likely to move lower. The Fed can cut 3 times in 2024 (see Peter’s Outlook HERE). That is our call and why we are long risk on factors and SMID GARP. Also, the CPI read through to Core PCE, the Fed’s preferred metric, was much more benign on the core services inflation reading. Let’s see if PPI confirms that today.
Full report below…thanks for reading the longer than normal Summary.
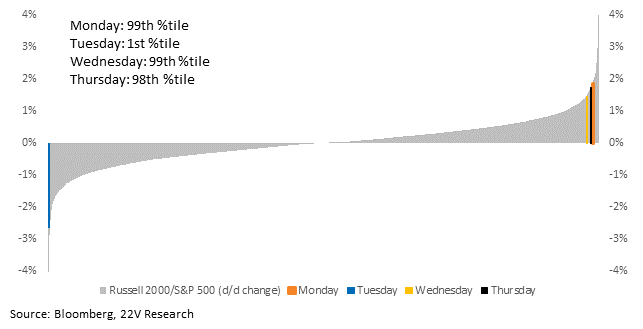
MARKET VIEWS: The volatility in all risk factors has been highly unusual this week. Focusing on small caps in particular, Monday was a 99th percentile outperformance, Tuesday a 99th percentile underperformance, Wednesday a 99th percentile outperformance, and then Thursday a 98th percentile outperformance. Together, that makes a +2.5% gain on the week, with the 19th worst day in its history sandwiched in the middle. IN short, this past week the market has priced in much higher odds of the economic Cycle extending on Monday, followed by the shock CPI report that reduced those odds (UST yields went up for the wrong reasons), followed by bounce back in the odds that the economic Cycle could extend.
Reason for The Vol: The spread between risk on factor and Low Vol PE and large vs Small cap PE’s is unusually wide. Even excluding the S&P 100 names, the PE spread between large and Small is still historically wide, its not just a mega 7 issue. The unusually high PE spread exists because of questions of how long this economic Cycle can last. The spread widened out RIGHT as the Fed started to tighten.

When the odds increase that core inflation moves back towards the Fed’s target, without a large increase in the urate, increase the odds that the economic cycle can extend for the next 3-5 years. Small caps and risk on factors should rerate higher in that scenario. Financial Conditions can ease without the worry of inflation moving back up. Inflation remaining stuck at too high of a level for longer, which would encourage tighter financial conditions for longer, keeps year ahead recession risk unusually high. See Bloomberg consensus recessions odds for 2024 still being at 45%. Down from 80%+ last year, but is still unusually high. Small caps and Risk Factors do poorly in this backdrop. The PE spread stays wide. The economic data following Tuesday has been more dovish, which should encourage some “catch up” in the earnings risk factor relative to the low vol factor.
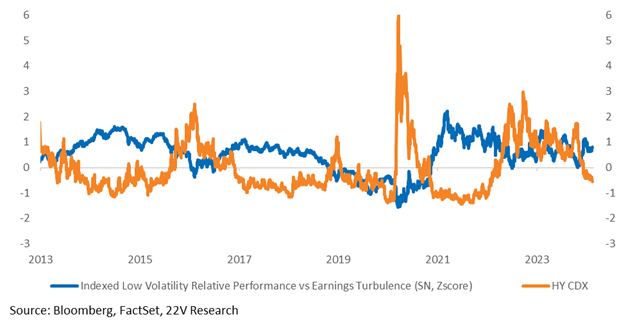
Many investors might think the reactions have been super extreme, which is fair. But we are at a critical point in figuring out, with much more certainty, if the Fed can cut 3-4 times or not at all. As Peter Williams pointed out yesterday, “helpful supply shocks largely fading and demand seemingly fairly robust core goods ex used autos is likely to exit outright deflation in mid-2024 on a m/m basis, with 6m measures turning positive in late-24 or early 2025. The most important impact of this forecast is that by the end of the year disinflationary forces are going to have to increase from core services ex housing and housing to keep inflation on a downward trajectory”. Bottom line, If services inflation isnt moving lower, the risk the CPI # introduced, the Fed cant cut, FCI would tighten and risk on factors/small caps suffer.
Upon further review though, the Core CPI appears to be more driven by January effects and the inputs from CPI that matter for Core PCE, the Fed’s preferred measure, were more benign. That lowered the hawkish risk and increase the odds the Cycle would extend. Yesterday, retail sales came in weaker than expected and the Atlanta Fed GDPNowcast came down again. Recall, the Atlanta Fed Nowcast hit 4.2% on Payroll Friday and is now down to 2.9%. That is a good thing because well above trend growth (2%ish) increases inflation/tightening risk. Service inflation is unlikely to come down if economic growth is 3%+ real. But that service inflation risk has was reduced on Wed/Thursday, which increases the odds the economic cycle can last longer. Our call is 2-2.5% GDP for 2024 and 3 cuts looks better then it did on Tuesday.
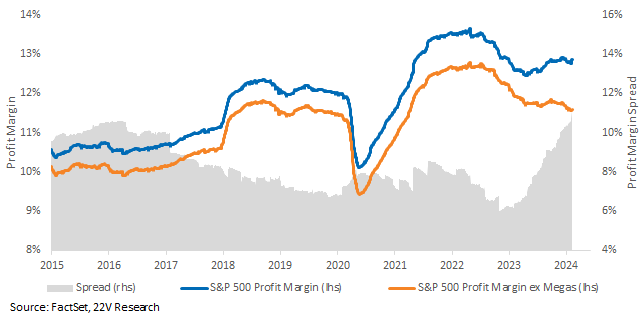
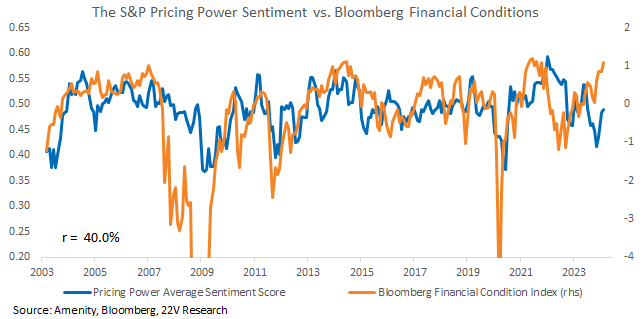
MARGINS: As the Quant team wrote on Wednesday, managers at S&P companies have grown more confident in their ability to command prices. Historically, periods of easing financial conditions have coincided with firming pricing power. Near-term, the easing of FCI over the past few months is a support for sales, margins, EPS for 1Q24. Longer-term, if FCI needs to be tightened again to lower inflation, that will be a headwind for earnings. But that is more likely a 2H24 issue. For now, the outlook for fundamentals is constructive.
That should be a support for S&P margins, including margins ex the mag 7. That’s a theme we went over in more detail HERE.