Macro Regime Model – Economic Expansion 6
Volatility in a Normal/Growth Period: 6
S&P NTM PE in a Growth Period: 7
S&P Return Drivers in 2023 and Early 2024 Expectations: 9
Long Sustainable Dividend Growers: 20
Long Deep Cyclicals (1Q Focus): 21
Investor Pessimism Into 2024 26
Fundamental Economic Outlook Supports the Modeled View: 28
Positive Impulse for GDP Growth: 29
Background Longer Term Supports: 32
Summary:
Process: Our process for forecasting the Macroeconomic, Market, Sector, Factor and Themes consistently relies on combining Quantitative, Fundamental, and Sentiment analysis. This process has served us well historically and our “strength” has been identifying the current economic regime and the associated risks. This process informs the longer-term Sector and Factor tailwinds and 1, 3, and 6 month macro risk management around our secular themes. Understanding the interplay between sentiment and shorter-term deviations in the macro backdrop is a critical part of the risk management process. We spend almost no time on 12-month forecasts for Sectors, Factors or Themes. Other strategists do those forecasts better than us. We are focused on what the current regime means for Sectors, Factors and Themes.
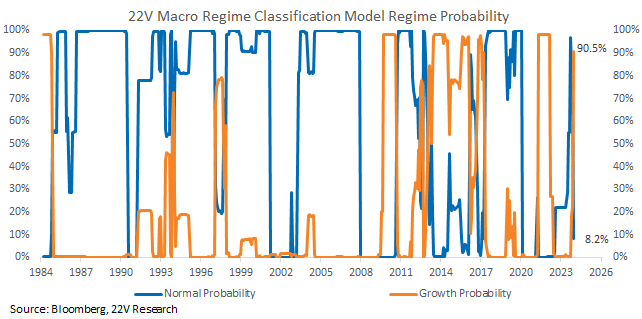
Quantitatively: We identify the macro regime we are in by aggregating up the breadth of macro and market indicators into a single model (Macro Regime Classification model, white paper here). After a prolonged Transition (high volatility) period, in July of 2023 the Macro Regime Classification (MRC) shifted to Normal (low vol, low recession risk), signaling the return to a more risk-on market. To start 2024, the model classification has shifted from Normal to Growth, further signaling a stabilization of macro trends. Market volatility and correlations during Normal and Growth periods (AKA, economic expansions) are lower than during Transition and Recession periods. While we remain in an economic expansion, use VIX spikes as a reason to add to risk.
Lower Correlations and Sector and Factor Themes: Correlations are typically lower in expansions, which favors alpha generation through stock picking, micro themes, and stocks that benefit from lower correlations. Factor returns during a expansion periods are led by fundamental factors, especially Value and Momentum. Macro regime changes shouldn’t sharply alter the factor trends recently in place, and we continue to expect GARP and risk-on factors to gain near term. Economic growth is unlikely to surge though (the Fed won’t let that happen) and inflation will continue to move lower. Growth equities will still do fine. Again, we are focused on GARP, not Value vs Growth for 2024.
Value has 1Q24 tailwinds, as do Deeper Cyclicals (Energy, Materials, and Industrials), but that is a tactical trade, not an enduring theme. As 22V Economist Peter Williams noted in his outlook, Recent FCI easing seems unlikely to substantially change the timing of the initial rate cut(s) but will boost growth and help ensure that growth in 2024, particularly 1H24, comes in notably above current weak consensus and Fed forecasts. Even as growth is firmer than forecast, we still expect 3-4 Fed cuts. Yield curves should steepen as a result (10yr stays around current levels and short rates decline).
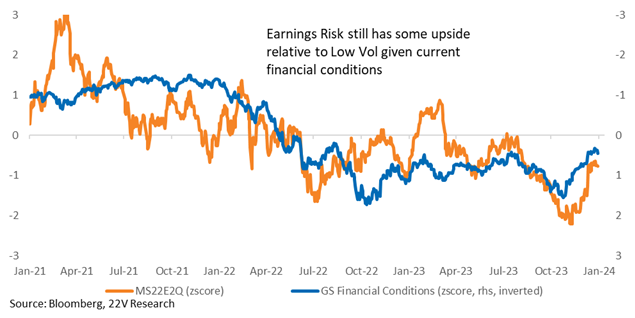
The cutting cycle is being driven by a desire to keep real rates stable as inflation slows. Inflation comps are easy through 1Q24, and the supply side looks much better. That is risk positive. Unless economic growth stays WELL ABOVE 2.5% and leading indicators of inflation, like wage growth, hook back up. That scenario could lead to tighter financial conditions. Also, the rate cuts now priced in futures markets are likely only if economic growth is meaningfully below-trend growth. That would favor Defensives and not our risk-on calls. The relationship between 10yr yields and stocks is changing.
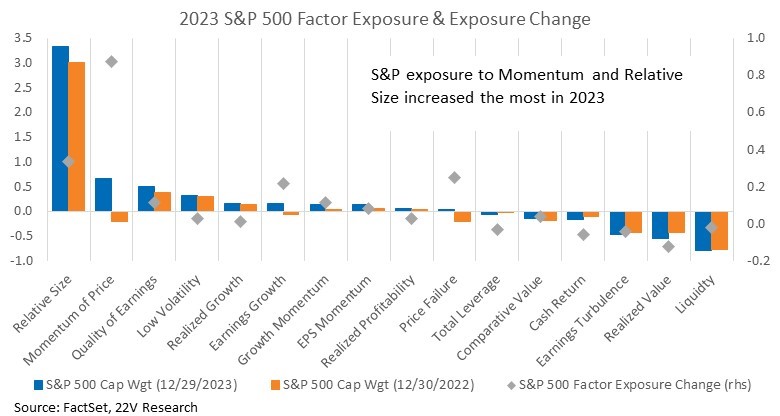
Finding Value and Quality names has become more difficult over the course of 2023 as the index has become heavily exposed to Size and Momentum of Price. Quality exposure of the S&P has increased modestly, while Value has decreased. Investors looking for Quality, Value, and Growth should focus on specific industries and small caps rather than the S&P.
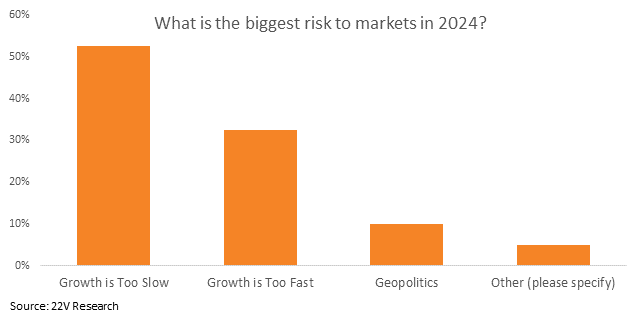
Sentiment: Two main points from our 2024 investor survey are 1) participants think too slow growth is the biggest risk to markets in 2024 (53%). Only 33% of investors think too fast growth is the biggest risk. This is consistent with 2) Tech expected to be the best performer in 2024 followed by Health Care. Both would be winners in a weaker economic growth/lower 10yr yield world. Sentiment is too negative on growth in our view, which should favor our Value, Deep Cyclicals and steeper yield curve calls in 1Q.
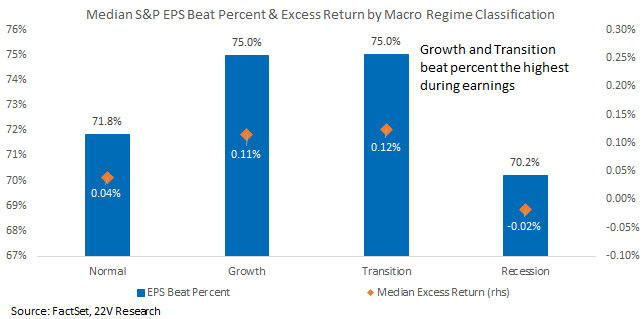
The S&P beat percent was higher during historical Growth and Transition periods. The move towards Growth macro backdrop suggests a higher-than-normal percentage of EPS beats in 2024 and better earnings into 4Q.
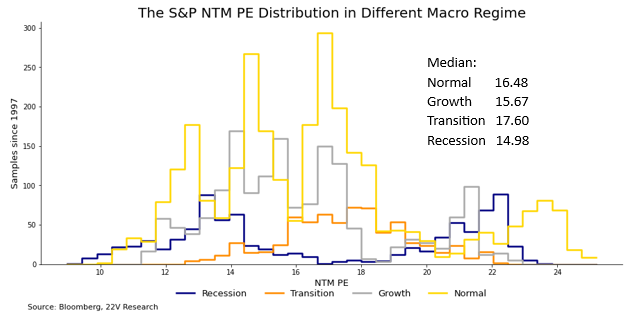
The S&P NTM PE is generally lower than normal in Growth periods, but that is partly explained by strong EPS growth. Currently the NTM PE is around 19.7x, slightly above its historical median. PEs are biased higher from here but at nearly 20x, a market outlook dependent on multiple expansion is hard to defend. At the same time, calling for PE compression requires deteriorating earning in late-’24 to early 2025. With financial conditions accommodative, the macro regime strengthening, and productivity surprising to the upside, our base case is flat to modestly higher PEs and view the risks to multiples as skewed to the upside. We will have more details on how we think about S&P earnings, margins, and fair value Friday January 5th.
Fundamental Macro Backdrop: We are leaning heavily on the Macro Regime Classification Model (MRC) to support our Sector, Factor, and Thematic tilts. The clear downside to that is the MRC is a state model, not a predictor of the economy. Macro conditions could break in multiple ways this year, and how they break will dictate market trends. The 22V Economics team (driven by Gerard MacDonell and Peter Williams) spend an unusual amount of time focusing on the fundamental drivers and risks to the US economy. As a firm, we spend less time on regression analysis, and that approach has served us well over the past few years. Some of the main foundational supports to the economy are…
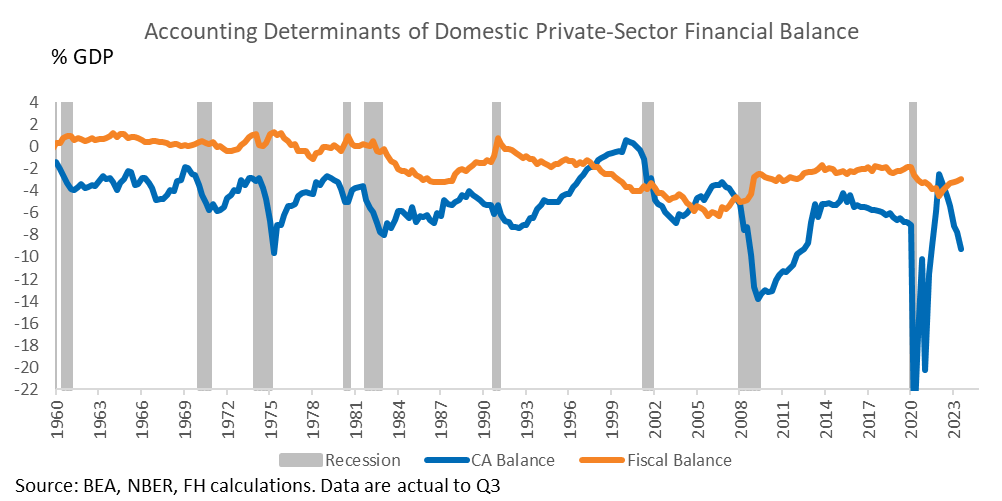
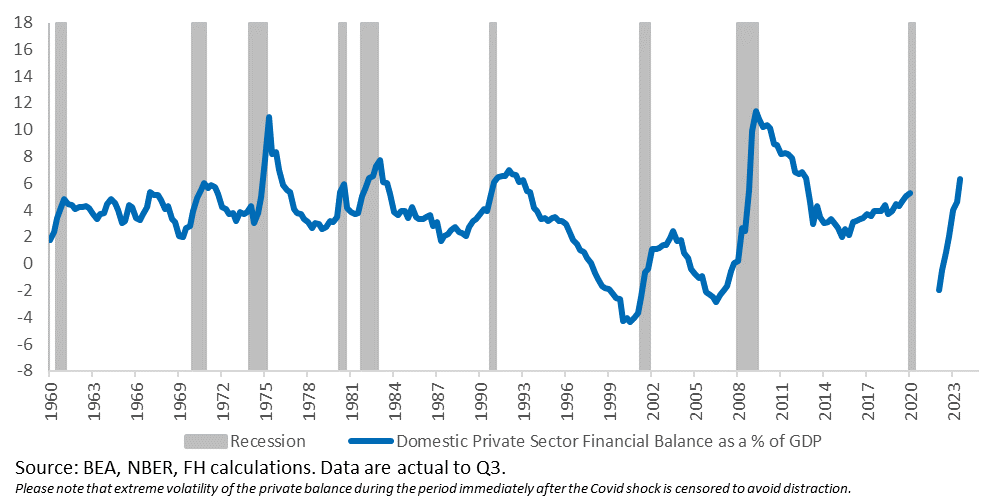
- No significant destabilizing macroeconomic imbalances exist in the private sector (the private sector is in surplus), consistent with the large fiscal deficit. That lowers the odds of a negative feedback loop developing in the economy.
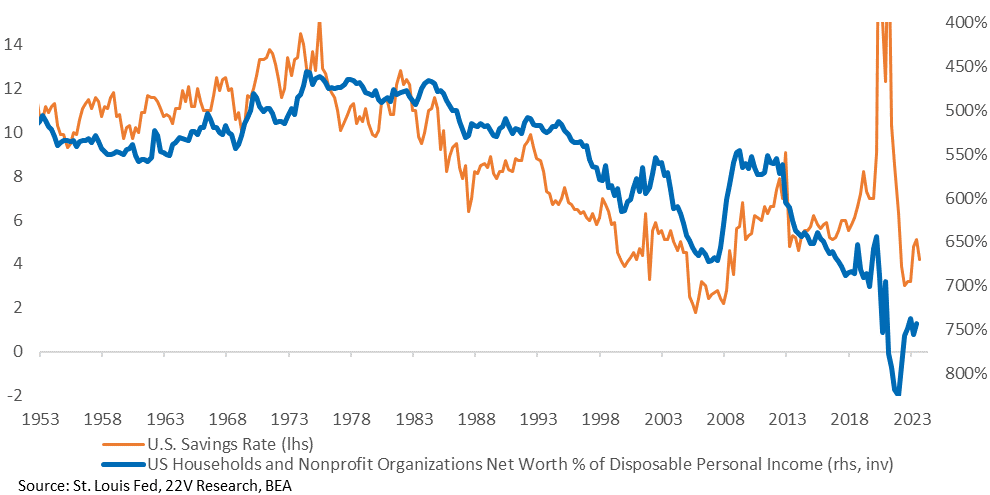
- Powerful wealth effects are likely to keep the savings rate from increasing. Unless the unemployment rate moves much higher or income growth much lower – near-term recession risk will remain low.
- The continued “catch down” in wages to goods and services disinflation. Because the inflation shock was not a labor market-driven phenomenon (the inflation shock was a demand surge plus supply constraint), it stood to reason wages COULD cool without a rise in unemployment as supply chains eased and demand growth cooled. That is happening but isn’t certain. We are most worried about wages getting “stuck” at too high a level for the Fed’s taste.
- Housing, and related parts of the economy including durable goods, should be a more positive impulse to growth than assumed as mortgage rates fall from their likely cycle highs last October. The implication being that neutral rates are higher.
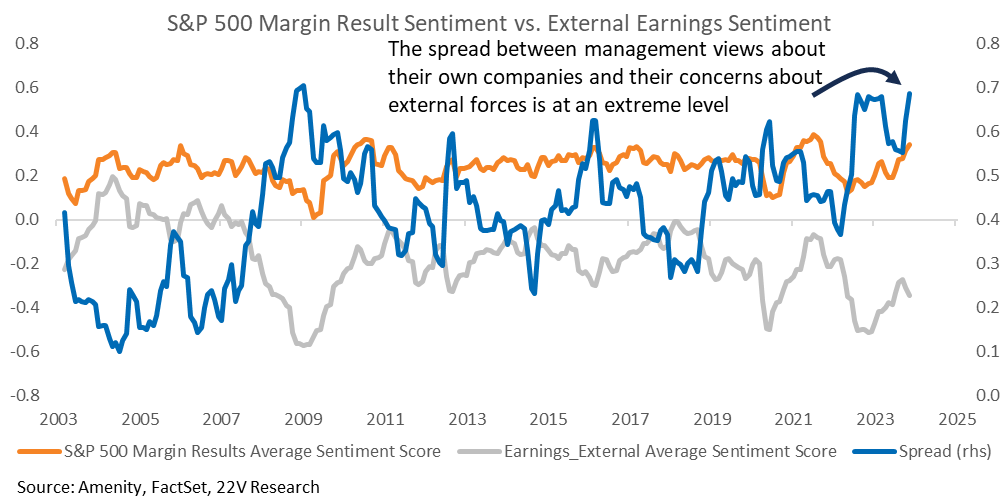
- The absence of a recession and easing financial conditions should support corporate sentiment. During 3Q reporting season, management sentiment toward their own businesses and profitability remained at a high level. The most intensely negative management commentary was around external forces: the macro economy and unspecified headwinds/fading tailwinds. Those external forces are improving as FCI ease.
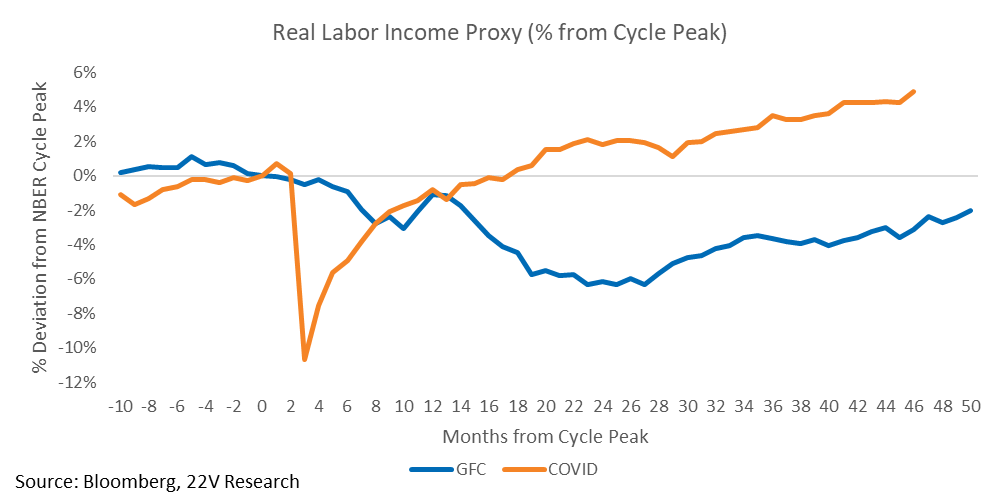
- Nominal income growth remains robust, and the real labor income proxy looks quite strong. The trend there, just looking backward, looks to be in a range of 3% to 4%. The pre COVID trend was 2-2.5%.
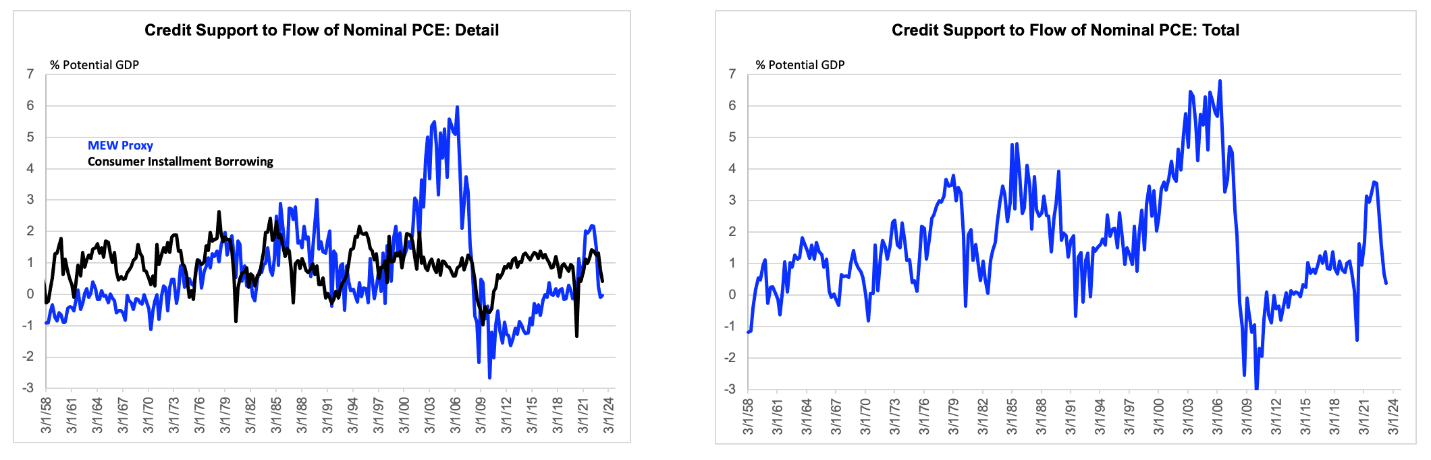
- The improving household financial balance helps explain why Credit HAS NOT been a driver of consumer spending. There has actually been a very steep deceleration of credit support to the flow of consumer spending, which Gerard measures as the flow of consumer installment borrowing plus mortgage equity withdrawal (MEW)
From the above flow several themes and trades, which we summarize in the table below. In the full report, we unpack the drivers of these themes in more detail.

Macro Regime Model – Economic Expansion
We identify the current macro regime by aggregating the breadth of macro and market indicators (white paper here). We avoid single variable models because the U.S. economy isn’t sensitivity enough to any single macro force to make univariate models effective. In July of 2023, our Macro Regime Classification (MRC) models shifted for putting the economy in Transition (high volatility) to Normal (lower vol expansion), indicating significantly lower recession odds about three months earlier than the market consensus. To start 2024, the model classification has shifted again into Growth. What that means is: 1) odds of recession continue to drop; 2) The slowdown in economic growth that investors expect, based on our investor survey 2024 (HERE), is less likely. The current backdrop is likely to be a combination of both Normal and Growth based on the sensitivity of the regime to changes in yields. More HERE.
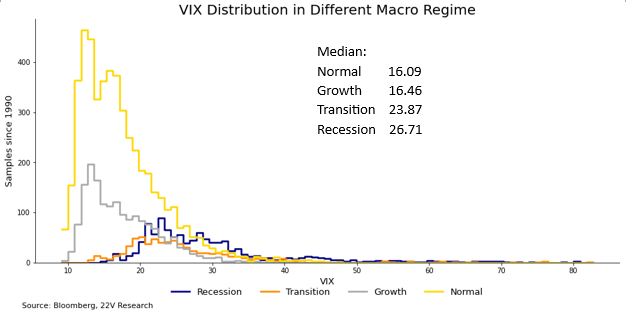
Volatility in a Normal/Growth Period: Market volatility and correlations during expansions (Normal and Growth periods) are lower than during Transition and Recession periods. The VIX has declined sharply since October, reflecting lowered recession risk. A persistent expansion regime means the VIX should be anchored to the low teens. Historically, in economic regimes similar to today, the VIX is more stable, and its central tendency is lower. While the economy is in expansion, use VIX spikes as a reason to add to risk.
S&P NTM PE in a Growth Period: The S&P NTM PE is generally lower than normal in historical Growth periods, but that is partly explained by strong EPS growth. Currently the NTM PE remains at 19.7, slightly above the historical median. Currently the NTM PE is around 19.7x, slightly above its historical median. PEs are biased higher from here but at nearly 20x, a market outlook dependent on multiple expansion is hard to defend. Our base case is flat to modestly higher PEs and view the risks to multiples as skewed to the upside. We will have more details on how we think about S&P earnings, margins, and fair value Friday January 5th.
2024 Trades and Themes
Lower Correlations: Correlations between S&P 500 and the 10yr have declined, which favors stock picking. This is part of a broad decline of the correlations between/within assets.
Stocks that benefit from lower correlations should continue to outperform.
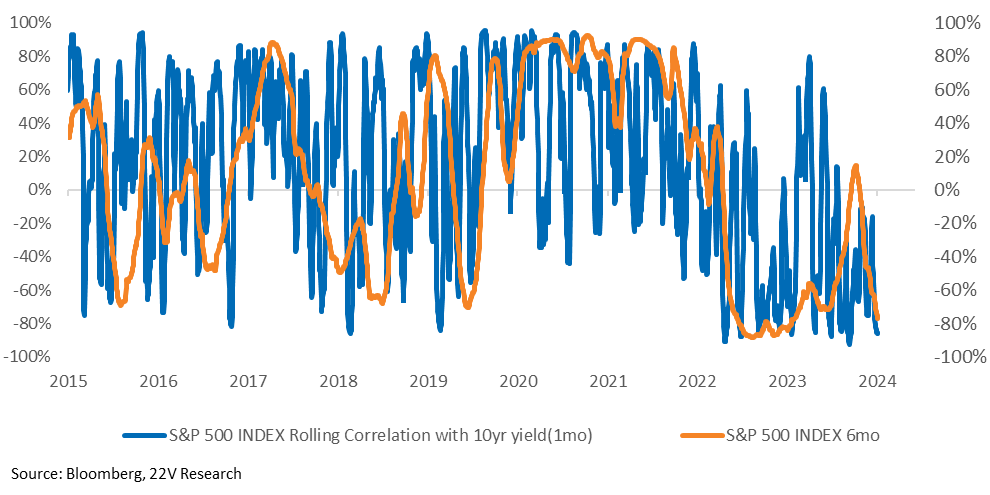
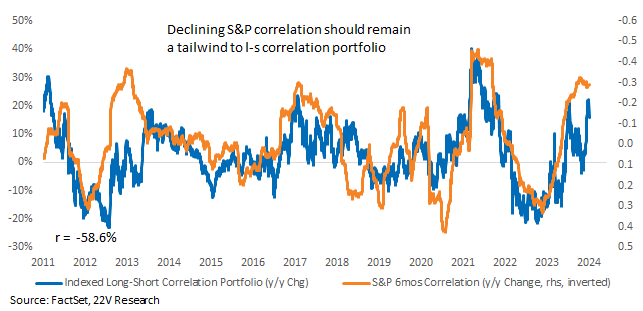
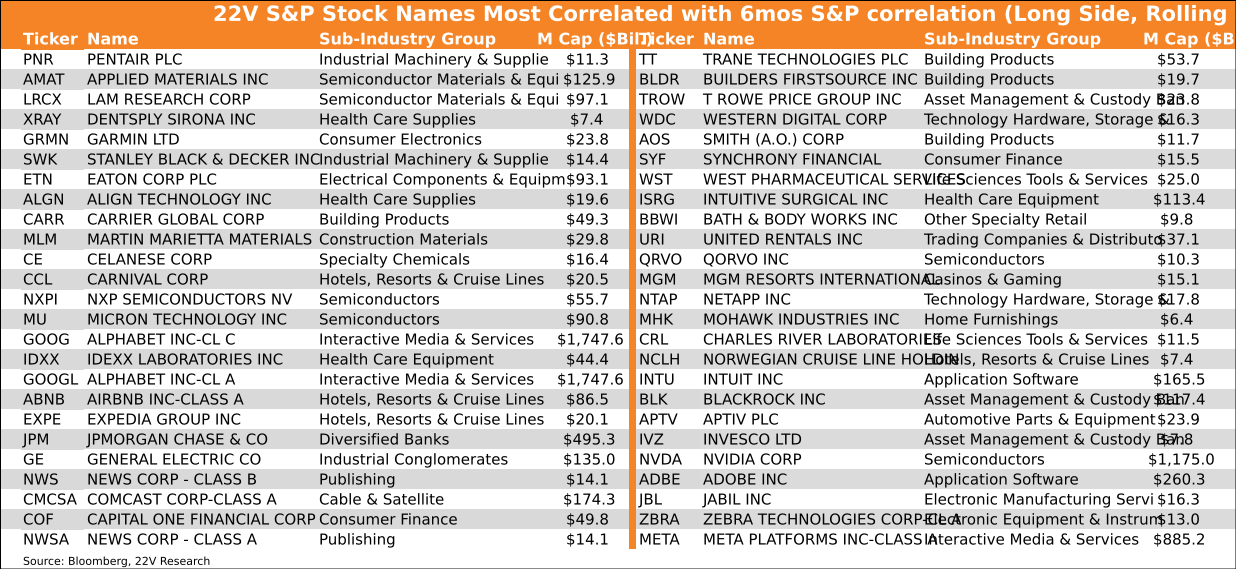
Below, we list the stocks that stand to benefit most from further declines in S&P correlation. When thinking about how rate cuts will impact markets, we suggest starting with these types of relationships and building out to industry level positions.
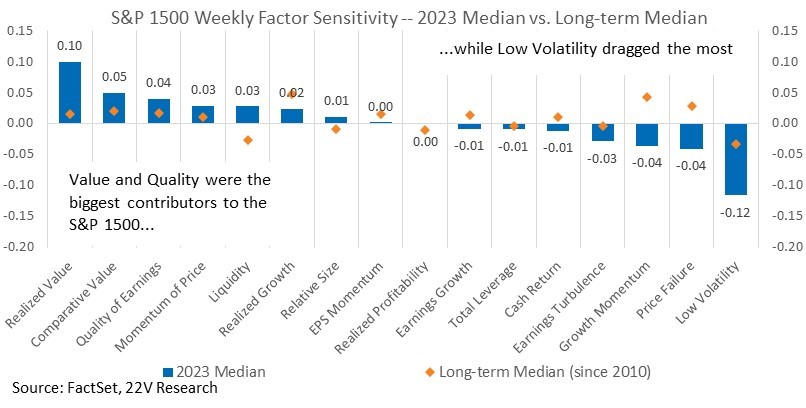
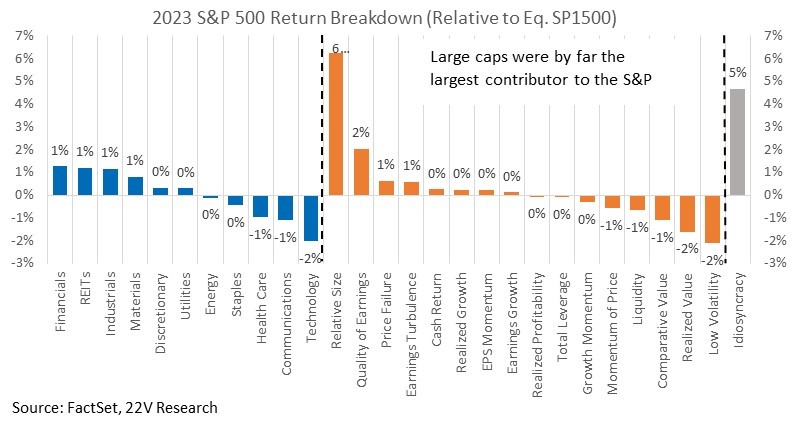
S&P Return Drivers in 2023 and Early 2024 Expectations: 2023 left the S&P 500 up 24% and the S&P 1500 just slightly behind at +23%. At a high level, stocks rallied because recession risk faded, the feared crash in EPS never materialized, and slowing inflation allowed financial conditions to ease without pushback from the Fed. For a more granular understanding, we look at S&P factor sensitivity, a measure of how sensitive the S&P was to specific factor movements. In 2023, the S&P was most positively influenced by Quality, Growth, and Size. The index was most negatively sensitive to Low Vol, Realized Profitability, and Cash Return. In other words, when the market was rising, Quality, Growth, and Size were drivers. Low Vol gained when the market was weak.
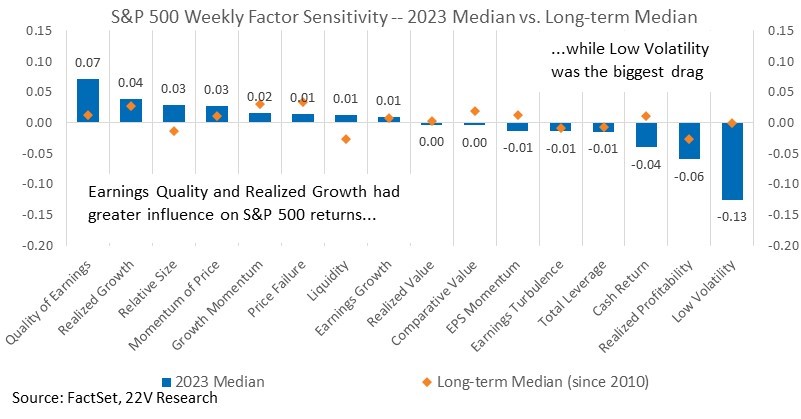
The broader index was also negatively associated with Low Vol, but noticeably more sensitive to Value factors. There are a few conclusions to draw from this analysis. First, fundamental factors were consistently positive contributors to both S&P 500 and 1500 returns. Second, Risk factors were a drag on returns for both indices. The other important point is that when smaller caps were working, Value was a differentiating factor. Looking forward, increasing soft landing odds suggest 1) fundamental factors will continue to drive stocks, and 2) when screening for smaller caps names, Value + Quality is an attractive starting point.
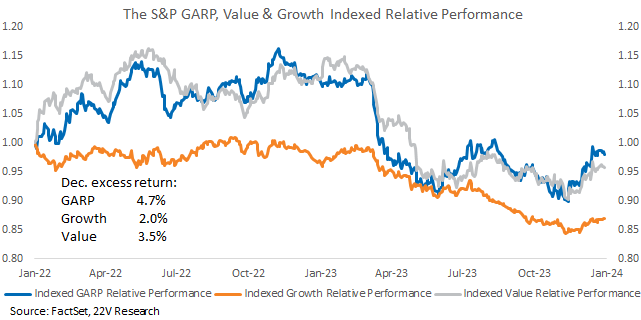
At the S&P 500 level and for now, we continue to favor blending Value and Growth in a GARP approach to screening. A clearer path for real growth and a steepening of curves, which seems likely in late 1Q24, would set up a Value rotation, but the GARP approach continues to make sense given the policy constraints on growth. Those constraints are not going away.
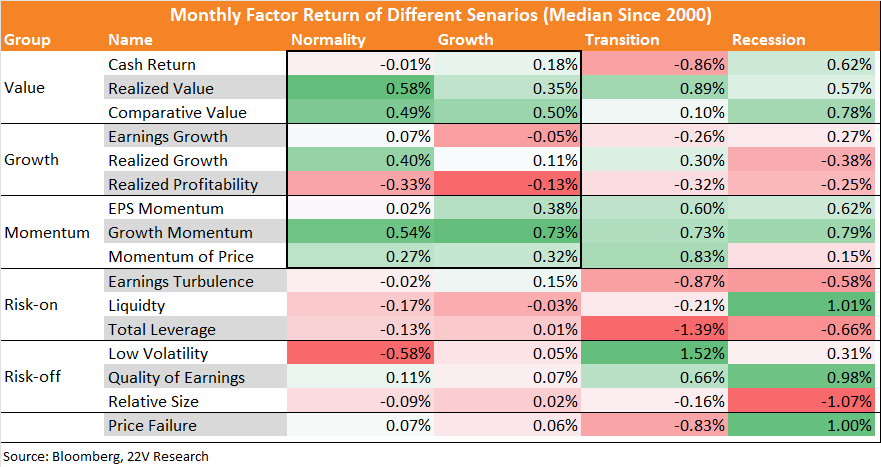
Factor returns during Normal and Growth periods are similar, led by fundamental factors especially Value and Momentum. Macro regime changes shouldn’t sharply change the factor trend recently and we continue to expect GARP and risk-on to gain near term.
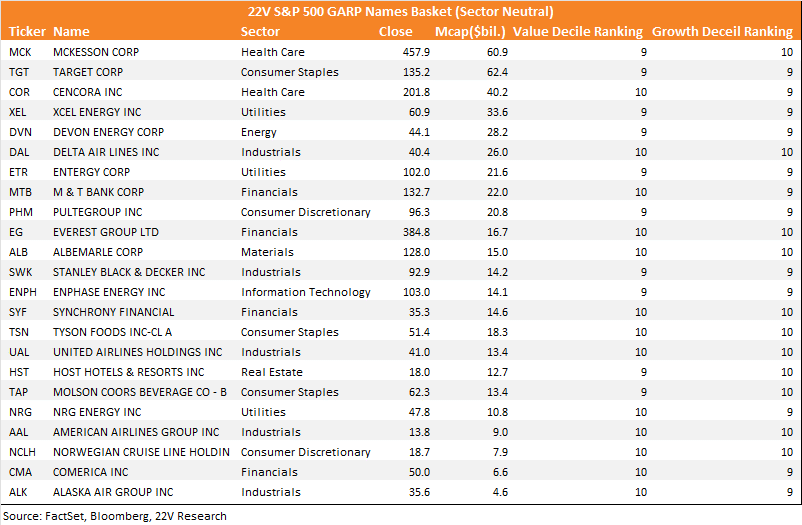
Our GARP formulation is names in the top quintile of both Value and Growth from each sector. Current constituents are below. This same approach can be applied within custom universes or collections of industries.
A style focused market is a headwind for the S&P 500 today. Finding Value and Quality names has become more difficult over the course of 2023 as the index has become heavily exposed to Size and Price Momentum. Quality exposure of the S&P has increased modestly while Value exposure has decreased. The bottom line is investors looking for Quality, Value, and Growth exposure should focus on specific industries and small caps rather than the S&P.
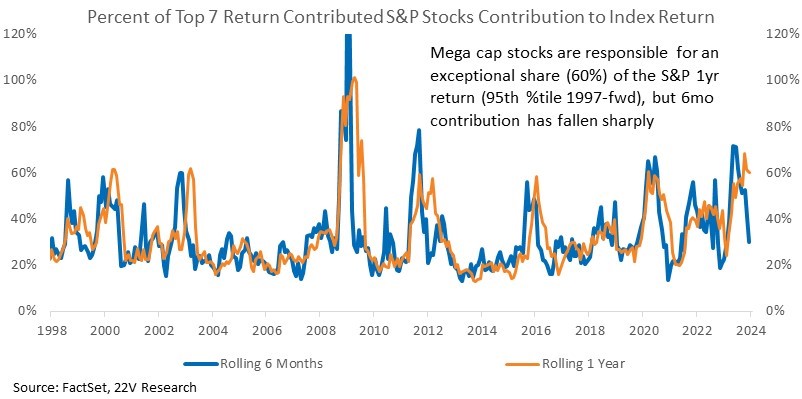
Exposure changes can be explained by the extremely high mega cap return contribution in 2023. Mega caps contributed 60% of the S&P’s return last year, though most of that contribution was in the first half. Size contributions are fading as declining macro uncertainty makes the defensive growth characteristics of the mega caps less attractive. We continue to favor small(er) caps and the average S&P stocks (S&P 400 over the S&P 100).
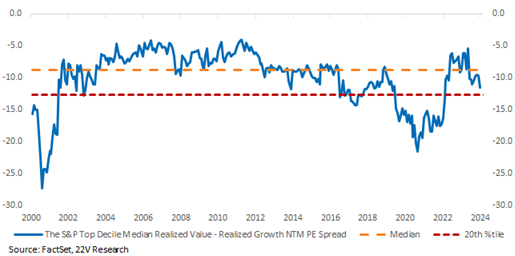
Value was not an effective screening tool within the S&P, but as the sensitivity analysis above showed, when the average stock was performing well, Value was a positive contributor. When positioning for a further catchup trades Value remains an effective tool. Value PEs are near their 20th percentile relative to Growth PEs.
Also important is that Tech/Comms were negative contributors to the S&P’s relative return. Mega caps within those sectors were MAJOR contributors, but many of the smaller caps were a drag. Those remain interesting places to look for catchup trades.
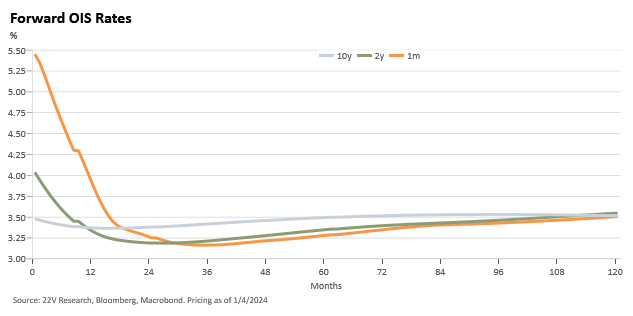
Rate Cuts: Peter Williams sees 4 tactical cuts as the base case for 2024, though he does not see much to differentiate that from 3 cuts at this point. The motivation for cuts influences how markets react to cuts. So, we tackled the “how will cuts impact the market” question by focusing on how industries/factors are influenced by macro factors tied to changes in rates. The macro factors best able to predict changes in fed rates, based on recent research (report behind paywall HERE) are financial conditions, labor market data, yield spreads and inflation readings, and global market performance. In the current backdrop rate cut cycle, 10yr -2yr spread is likely to steepen, financial condition should be flat to easier, and inflation will continue to decline.
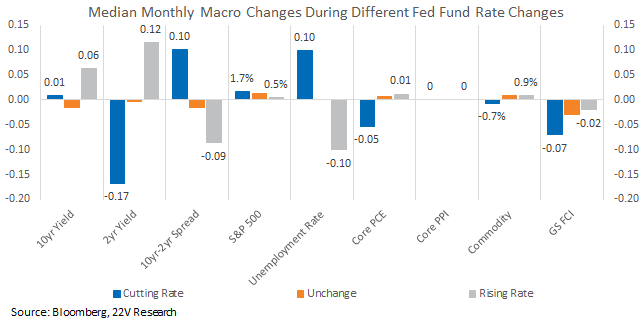
As Gerard mentioned in a note (HERE), “The realization of steep disinflation in goods and services markets allows the Fed the luxury of risk managing away from economic weakness as well as from the inflation threat. This is hugely important…But the idea that they will now shift to growth on seems still to be a stretch. So, the odds are that the rate cuts now priced will be delivered only if a failure to do so would likely imply meaningfully below-trend growth. And that seems like a decent hurdle.”
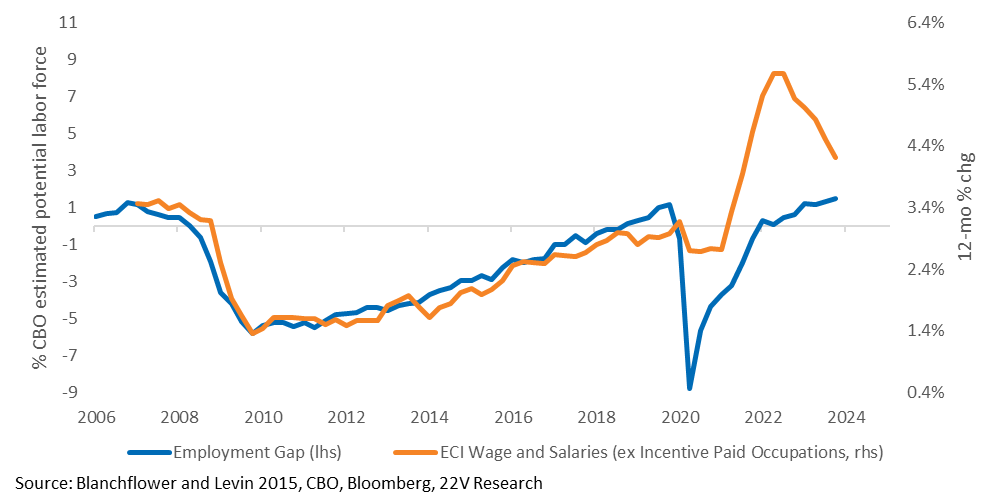
There seems a decent chance short-term measures of inflation may bounce some in 2H24 as disinflationary impulses fade, underlying inflation decelerates more slowly, and services inflation stays elevated. Bottom line, under our forecasts of roughly 2% GDP growth and slowing inflation, the Fed will begin cuts March (tentatively) then cut sequentially 2-3 more times before going on an extended pause. This would be less than consensus estimates of roughly 6 cuts in 2024.
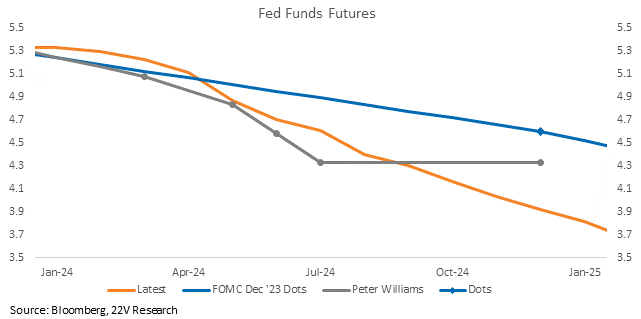
From an equity investor point of view, the above suggests that well below trend GDP growth (below 1% or close to zero) is needed to justify current cuts. That would not be great for risk assets as yields decline (Defensive stocks outperform). If growth is firm and the Fed cuts less than is priced, that would be positive for risk-on factors. The other risk is economic growth reaccelerates and the Fed focuses on tightening financial conditions. If our framework is correct, the negative correlation between bond yields and stocks will become much less intense. That implies bond yields remaining around current levels (or slightly higher) is the best backdrop for risk-on factors in 2024. Well below or above 2% real GDP growth, on a sustained basis, would be bad for our call of risk-on factors, small caps, and Deep Cyclicals working.
Yield Curve Steepening: We run a back-of-the-envelope calculation for the 10yr under a soft landing. Thank you to Peter Williams for helping us with this. Basic “model” is…
Basically, we decomp the 10yr into the fed funds a year forward from 2024, two years forward, the rest of the fed funds curve out to 10yrs (simply weighted by time), and a term premium. For a soft landing…
Our logic is under a soft landing, the pace of cuts is gradual because the economy is at the target at current interest rates. The term premium (50bps) is pretty low, historically speaking, because the risk to economic cycle variability and inflation variability is mild.
FYI, our YC steepener scenario is close to what futures indicate. BUT that does not imply the move is priced into equities. Futures are pricing in a combo of soft landing/hard landing/reacceleration, that nets out close to a soft landing. How we get the steepener is still undecided and will matter.
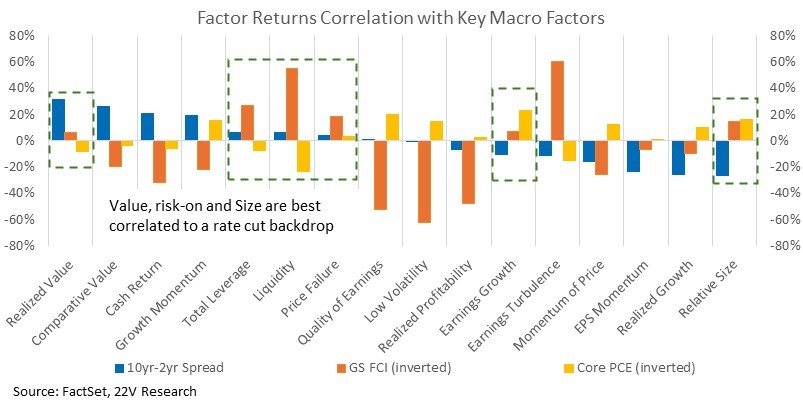
Value factors benefit from rising yield curves and get a little boost from easier financial conditions. Risk-on factors are highly tied to changes in financial conditions and have modest support from curve steepening.
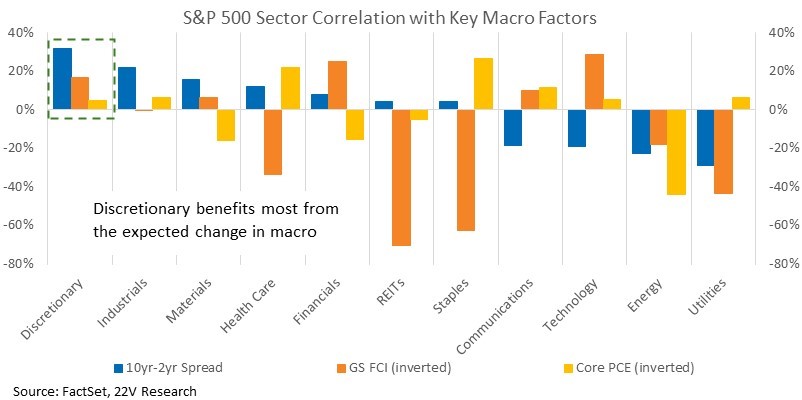
At the sector level, Discretionary is best positioned to benefit from steeper curves, easing financial conditions, and lower inflation. Technology and Financials are also highly positively impacted from easing financial conditions. Defensives are strongly negatively impacted by easing financial conditions.
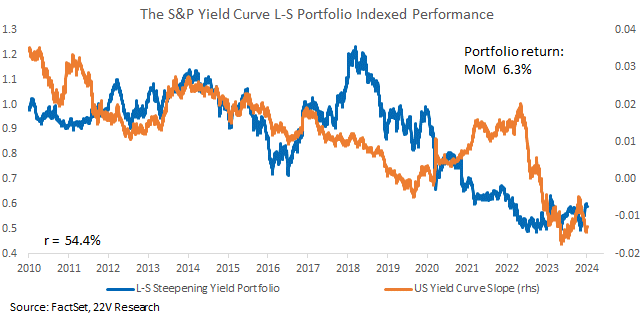
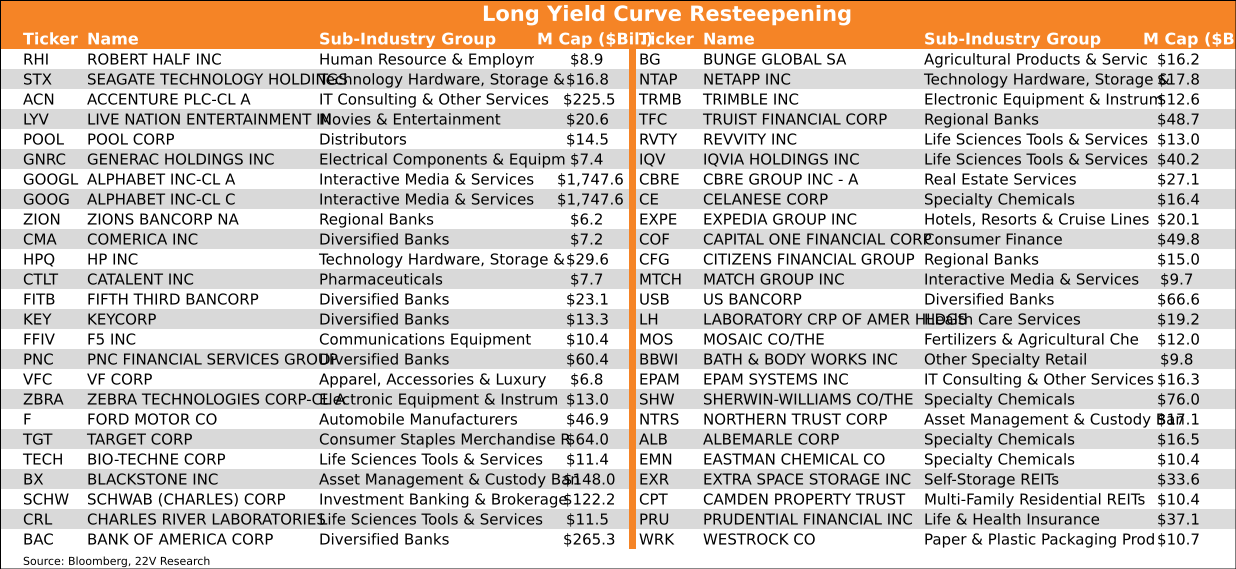
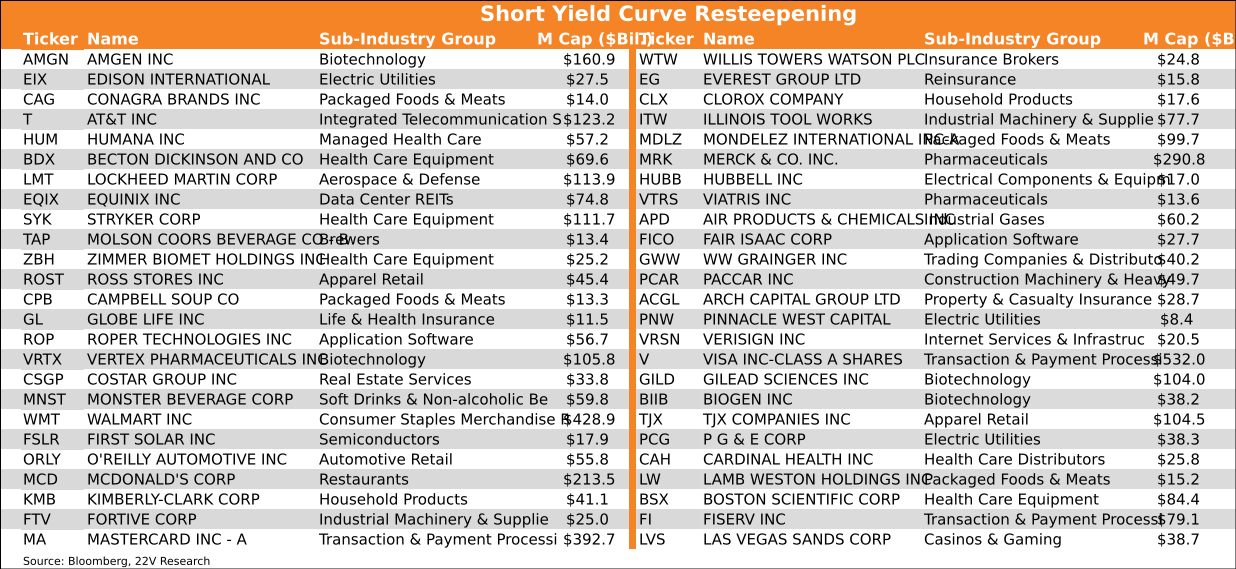
We have a yield curve steepener portoflio, built off a simple correlation analysis. This is a more direct way of playing a yield curve steepener vs Deep Cyclicals and small caps.
Below we list the stocks that benefit from a steeper curve (long side) and do not benefit from a steeper curve (short side).
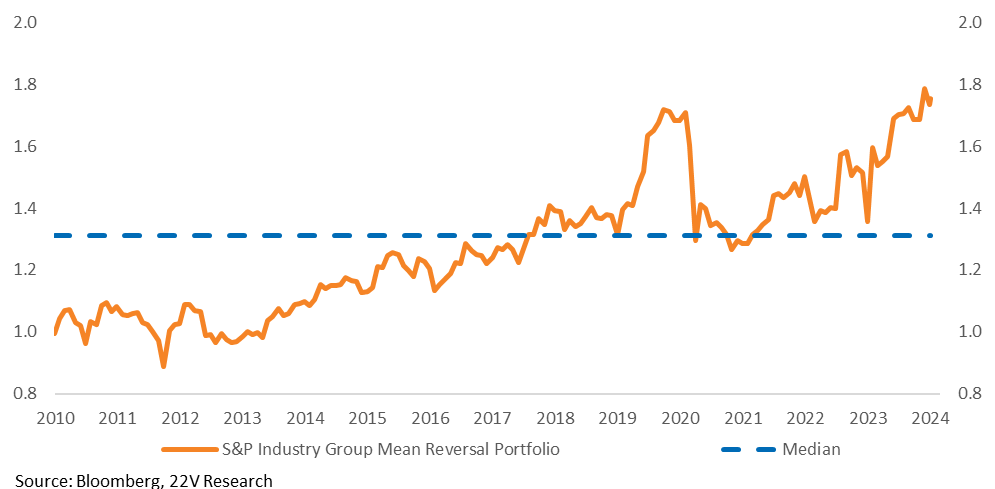
Persistence of Trends: A dummy portfolio that goes long the 6 worst-performing industry groups of the prior month and short the 6 best-performing groups has had positive returns fairly consistently over the past couple of years (11.4% annualized l-s return). Mean reversion strategies benefit from macro uncertainty. With frequent rotations based on competing narratives. Now, as macro uncertainty is declining, there should be less mean reversion.
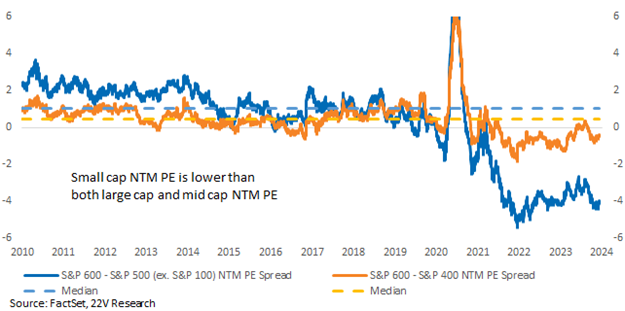
Long Small Caps: The valuation spread between small caps and megas, small caps and large caps, and small caps and midcaps is extreme. We are not arguing that small caps PEs should rise to the 75th percentile relative to large caps under a soft landing, but a simple return to the long-term median implies the Russell 2000 would outperform the S&P 500 by +11%.
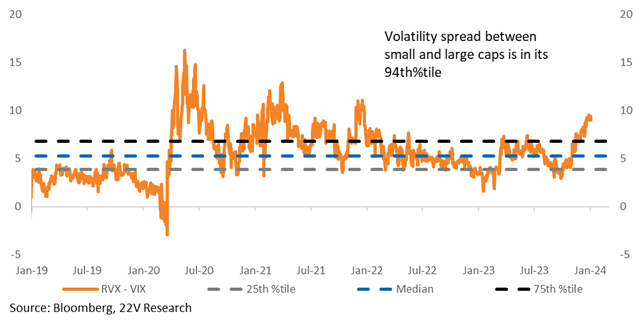
Implied volatility in the S&P is low (VIX at 14 at the time of writing), but implied vol in small caps is much higher. The spread between the two is in its 94th percentile. That reflects uncertainty over the macro outlook (the S&P is much more levered to Quality than the Russell). We expect uncertainty to decline throughout the year, to the benefit of small caps.
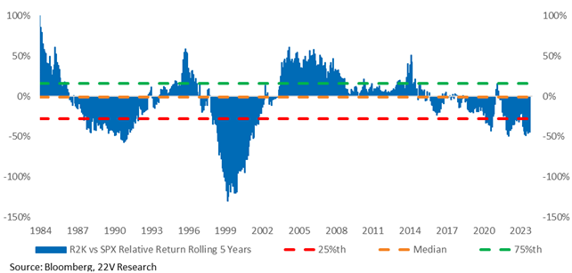
The rolling 5-year return spread between Russell 2000 Index and the S&P has dropped to its historical 12th percentile.
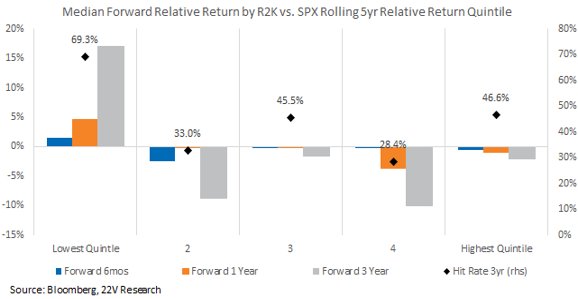
Breaking down rolling 5yr small vs. large cap return spreads into quintiles and looking at their forward returns shows a clear mean reverting tendency for the worst performing quintiles. So, periods, where small caps significantly underperformed large tend to be followed by small caps outperforming over a forward 6m, 1yr, and 3yr timeframe.
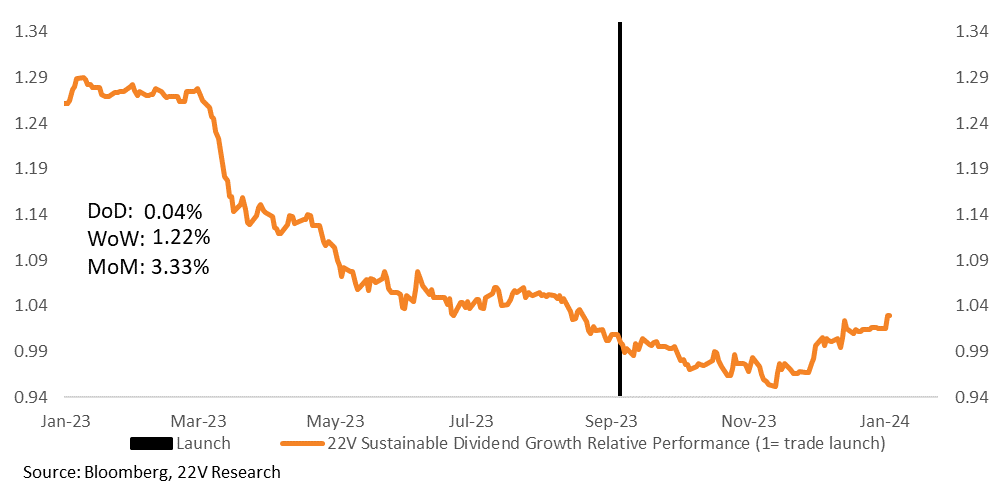
Long Sustainable Dividend Growers: Yields coming off the 5% high water mark is a scene changer for income baskets. We have a basket of sustainable dividend growers (MS22DIV Index on bbg), made by combining dividend yields, payout ratios, and growth. This basket collapsed while interest rates jumped and lagged on the way down. Its risk-off factor profile means it didn’t benefit from the risk trade. Now there’s a chance for a catchup trade. It should behave better longer-term now that their yield is more competitive.
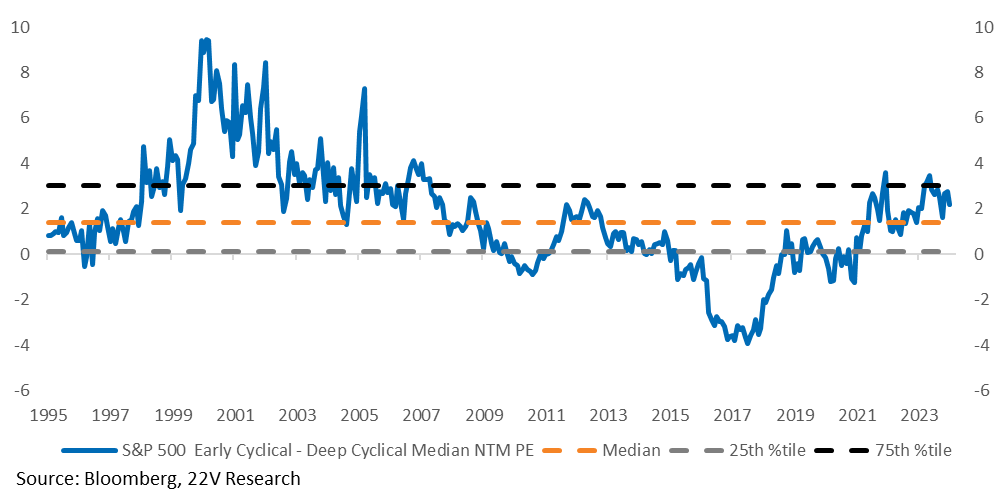
Long Deep Cyclicals (1Q Focus): Hot data may not become problematic for inflation immediately, which leaves little reason for the Fed to push back against good data in the near-term. That is a tailwind to Deep Cyclicals (Materials, Industrials, and Energy) relative to Early Cyclicals (Tech, Comm Srvcs, and Discretionary). The multiple spread is stretched to its 64th %tile. The catchup trade in Deep Cyclicals is in place, even if the Fed is wrong about financial conditions. The financial conditions debate is more of a 2Q24 or 2H24 debate.
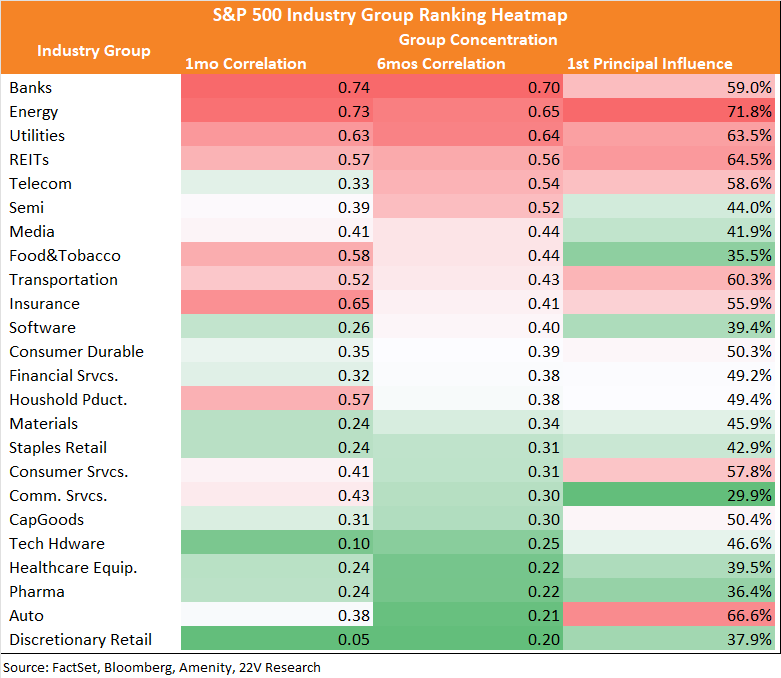
L-S Discretionary Retail: The best sectors to play l-s sector-neutral strategies are those with low market influence (we use 1st principal influence, farthest right column below) and lower correlations. Banks, Energy, and Utilities still have relatively high correlations and 1st PCA. Their returns are more of the same direction and better to trade as a group. Discretionary Retail, Auto and Pharma are the industry group with the lowest correlation and more effective stock picking strategies and factor overlays.
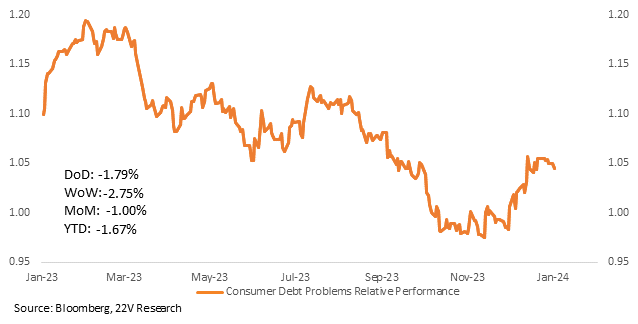
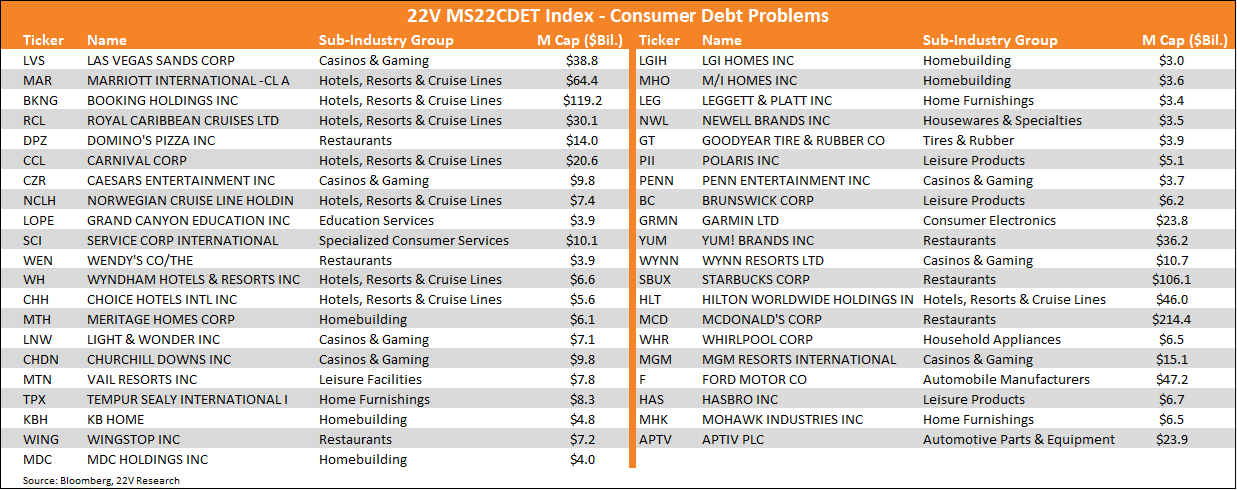
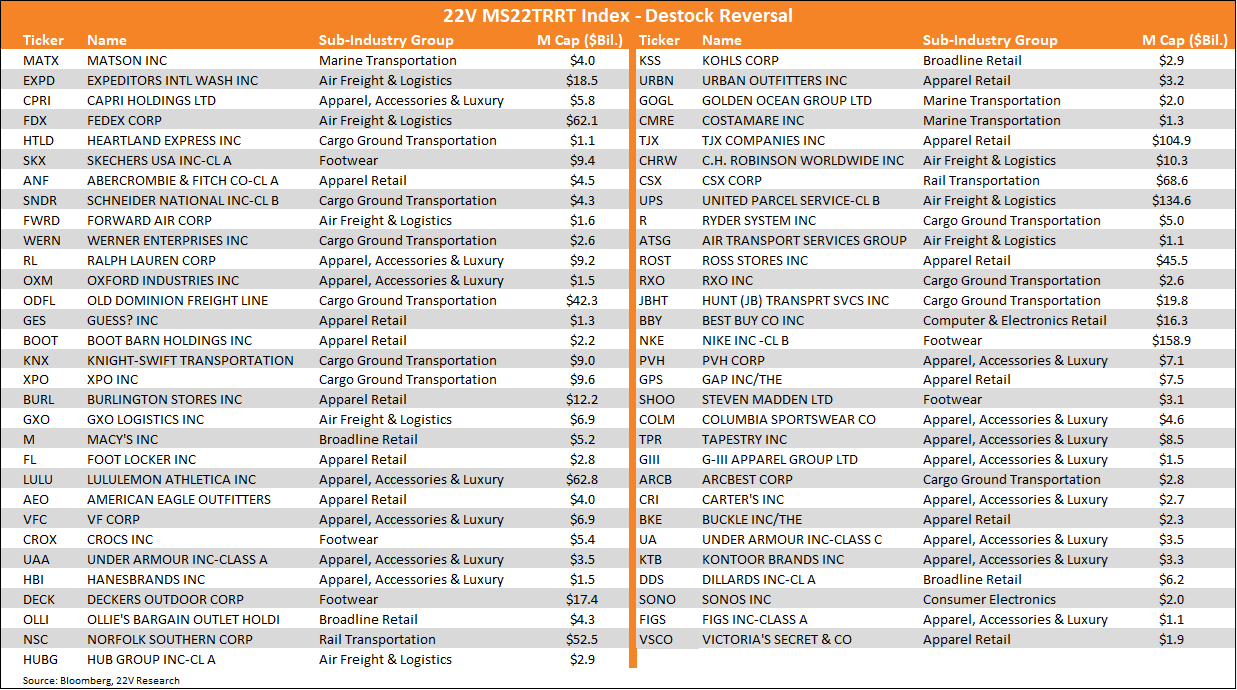
Discretionary Retail has particularly low correlations and macro influence, making it ripe for thematic trading. Our preferred l-s strategy is long companies that will benefit from a destock reversal and short consumer companies with debt problems. This is a theme we liked mid-2023, and one we like again now that 10yr yields are back down to 3.9% and the basket of companies with debt problems outperformed as yields collapsed. Our macro call for a soft landing is not consistent with destocking retail inventories, so these companies should benefit from tighter inventories this year. At the same time, rates around 4% is still not great for companies with deteriorating debt ratios, especially now that the move lower in yields has been realized.
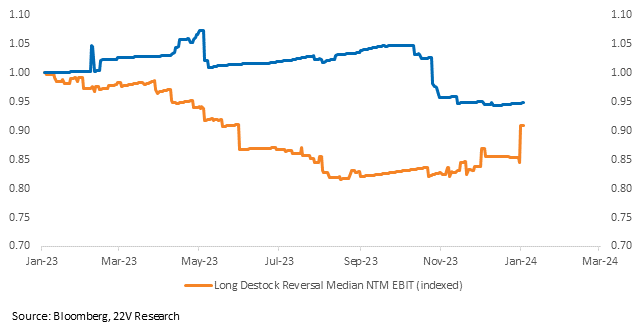
Our index of companies that will benefit from a destock reversal hung in well relative to our Consumer Debt Problem basket as yields fell (+1% l-s while the 10yr fell -1.2pp from 10/19-12/27), but the EBIT expectations are still lagging. The fundamental outlook should heavily favor destock reversal over debt problems this year. FYI you can track these baskets on Bloomberg; destock reversal is MS22TRRT Index, consumer debt problems is MS22CDET Index, and the l-s pair is MS22LDSD Index.
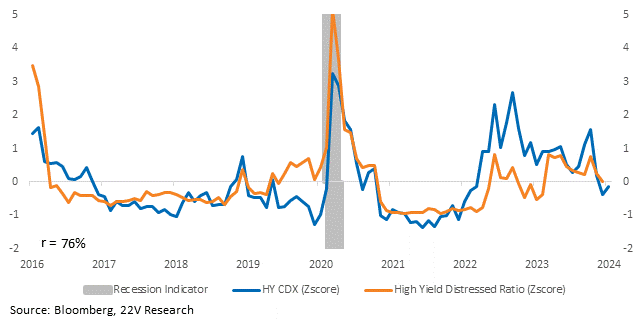
Rate-Sensitive Industries: Last year, banks lagged, and rate sensitive names struggled as investors avoided industries that faced higher rate risk. Over the year, default rates increased, but this increase was a return to a “normal” level after being abnormally low. Credit spreads remain tight. There is little sign of the type of build ups that tend to cause debt related issues.
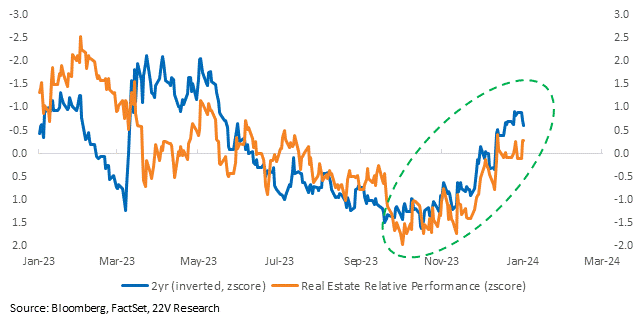
REITS, which are also rate sensitive, was a volatile sector in 2023 as investors avoided industries that faced higher rate related risks. REITs and related names have had terrible internal and external sentiment. Mortgages rates remain high, but the economy appears to be shifting into a higher speed limit phase. How far growth can accelerate without causing inflation problems remains uncertain, but the Fed appears willing to wait and see. This is a tailwind for REITS into 2024 suggesting a housing rebound.
4Q Earnings Basket: To help screen for potential upside surprises, we look for companies that could see upward revisions to guidance and estimates ahead of 4Q reporting. Below we list the S&P companies with the largest internal vs. external sentiment spreads. These are the stocks where management was most positive on their internal outlooks and more negative on the macro risks.
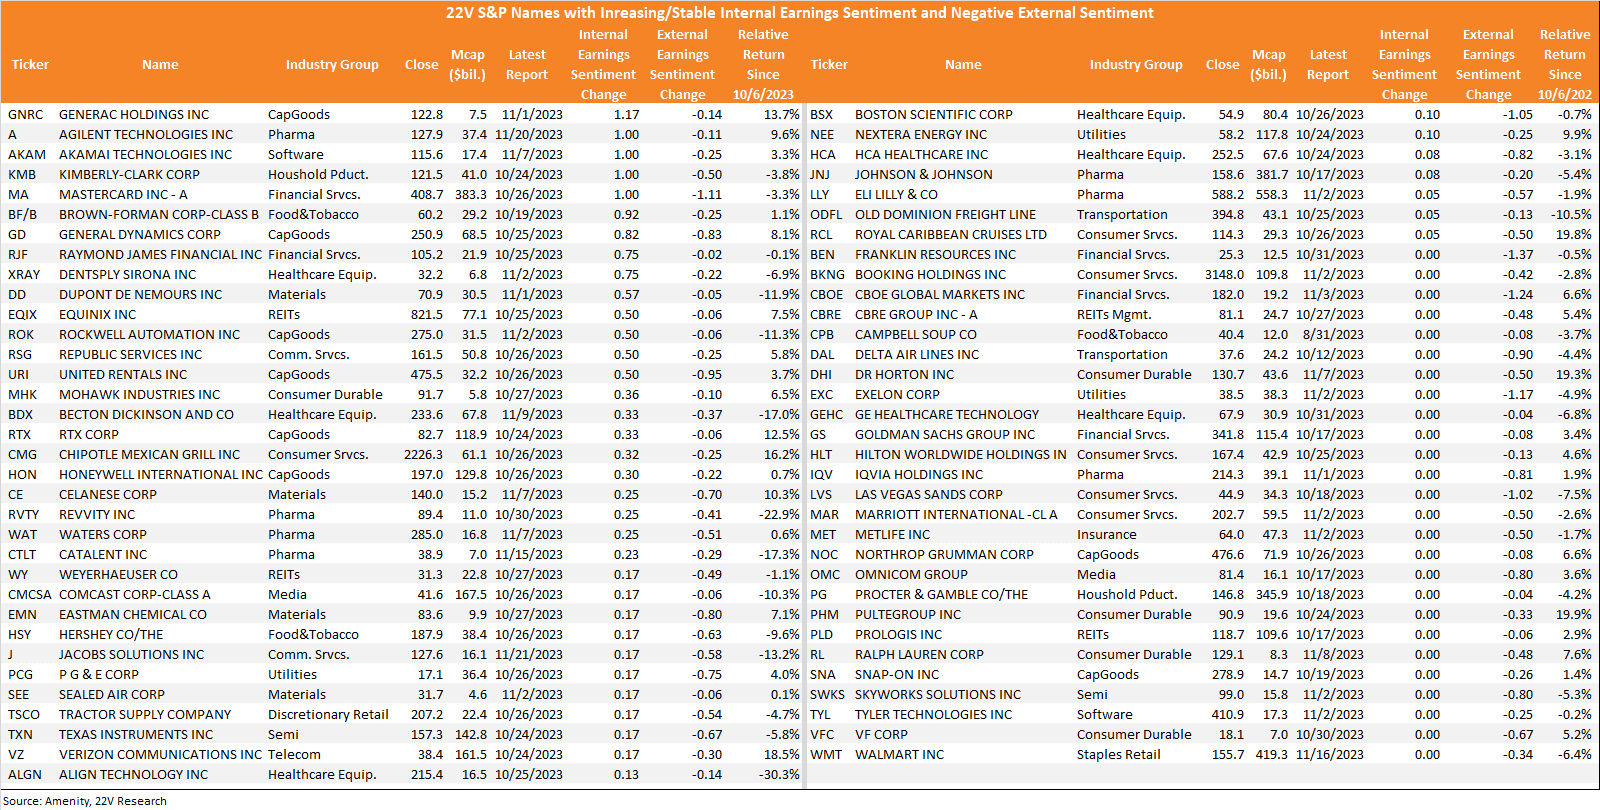
4Q earnings are about to start mid-January. The S&P beat percent was higher during historical Growth and Transition periods. The move towards Growth macro backdrop suggests a higher-than-normal percentage of EPS beats in 2024 and better earnings into 4Q.
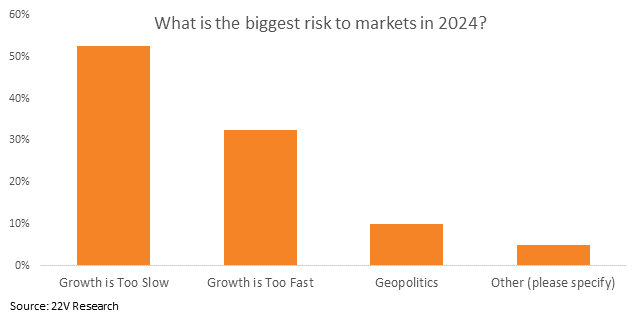
Investor Pessimism Into 2024: Relative to the way we think about the world, investors seem pessimistic. According to our 2024 Outlook Investor Survey (HERE), investors think too slow growth is the biggest risk to markets in 2024 (53%). Only 33% think too fast growth is the biggest risk. We think faster growth is the larger risk.
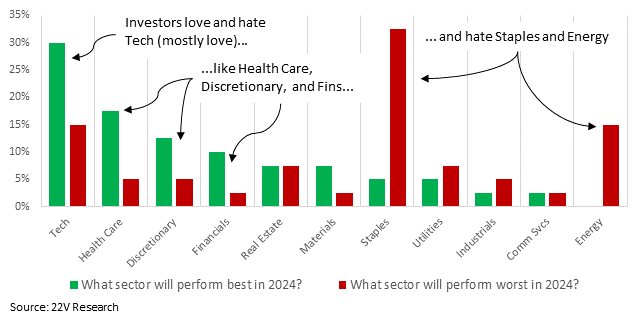
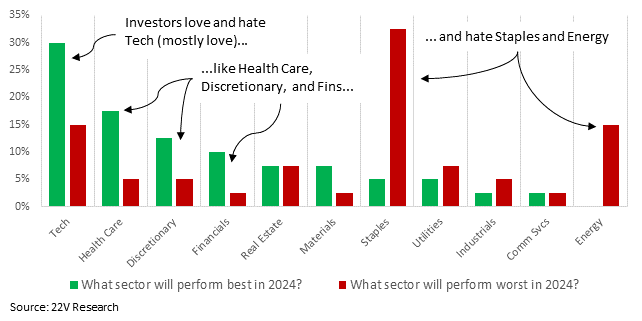
Consistent with fears of economic growth being too weak, 30% of the investors we polled think Tech will be the best performer in 2024 and 15% think it’ll be the worst. Health Care has the second largest net best – worst (and only 5% expecting worst). Discretionary and Fins are also popular longs. Staples and Energy are far out of favor (both have performed well to start 2024).
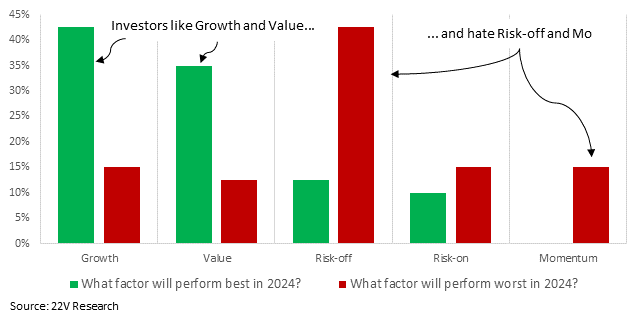
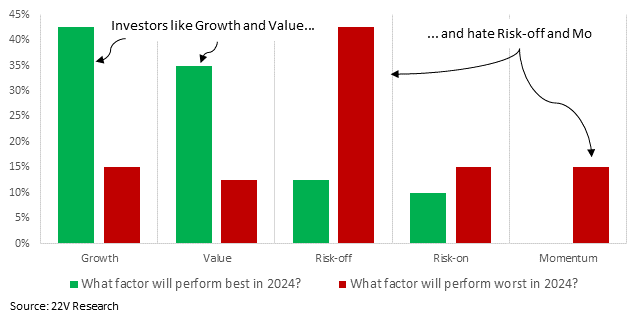
Investors like both Value and Growth (conveniently fits our GARP framework for 2024) and think risk-off and momentum will be the worst performers.
Supporting Data
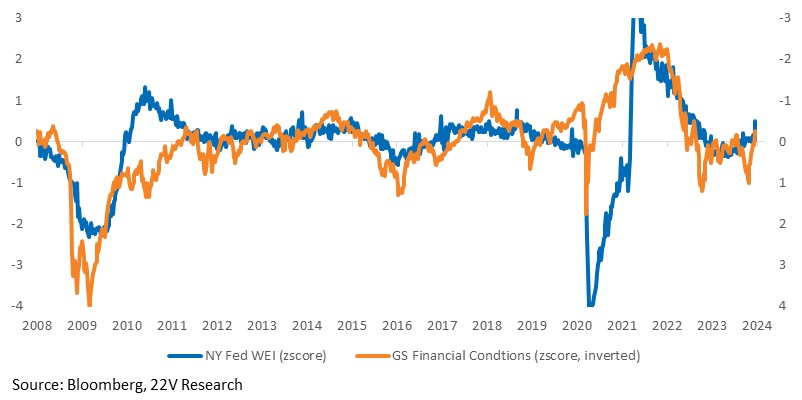
Fundamental Economic Outlook Supports the Modeled View: The Macro Regime Classification Model (MRC) is a state model, not a predictor of the economy. Macro conditions could break in multiple ways this year, and how they break will dictate market trends. The 22V Economics team (driven by Gerard MacDonell and Peter Williams) spend an unusual amount of time focusing on the fundamental drivers and risk to the US economy. As a firm, we spend less time on regression analysis, which has served us well the last few years. Anyway, as Peter Williams pointed out in his 2024 Fed and US Economy outlook piece (HERE) “With FCIs easing substantially to close out 2023, even as growth was extremely punchy in 23Q3 and fairly healthy over the rest of the year, the current consensus and Fed implied slowdown in growth from 23Q4-24H1 is likely to be beat to the upside.”
Positive Impulse for GDP Growth: The upside in GDP growth is housing, and related parts of the economy including durable goods, being a more positive impulse to growth than assumed as mortgage rates fall from their likely cycle highs in October. The implication being that neutral rates are higher. See the recent improvement in single family homes starts, the most important driver of GDP.
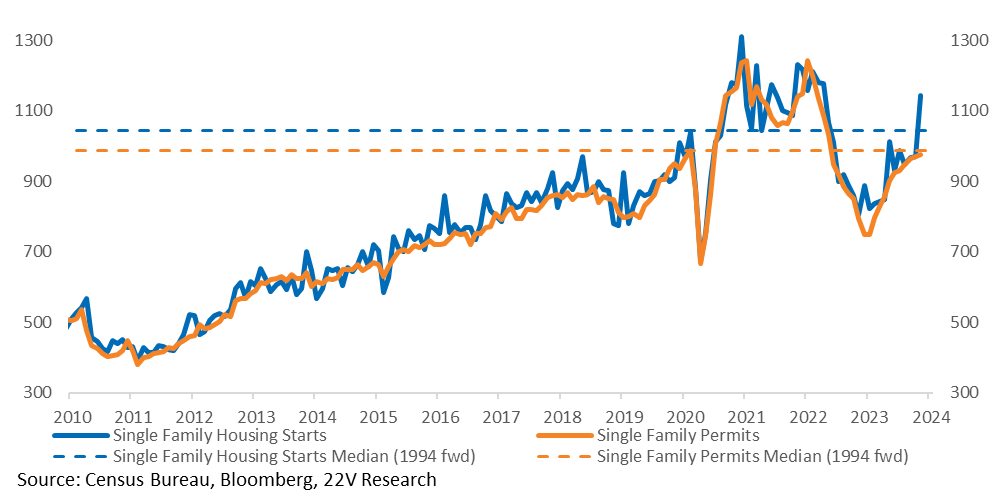
Gerard notes that “Single family activity is unlikely to fall from the floor on which it settled in response to the 4 ppt rise of mortgage yields earlier in the Fed tightening process, between the middle of 2021 and late 2022. It was part of my thesis that the lags from monetary policy to the real economy were shorter than the doves were implying.”
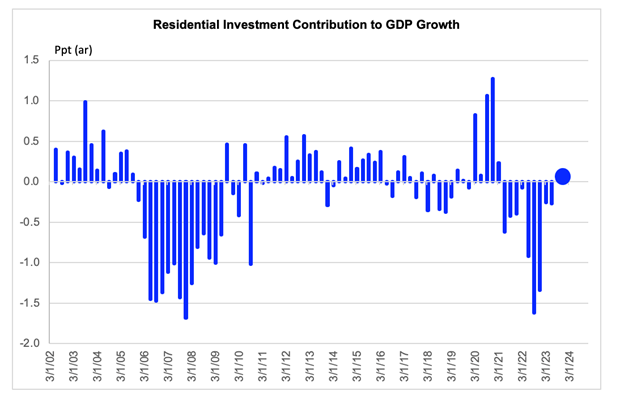
Source: BEA, FH calculations and estimates
Data are actual to Q2 and estimated for Q3.
Corporate Sentiment: The absence of a recession and easing financial conditions will likely support corporate sentiment. Management remains broadly positive about their own companies. During 3Q reporting season, management sentiment toward their own businesses and profitability remained at a high level. The most intense negative management commentary was around external forces: the macro economy and unspecified headwinds/fading tailwinds. The last time a spread between negative external macro sentiment vs positive business trends and profitability sentiment existed was early 2009.
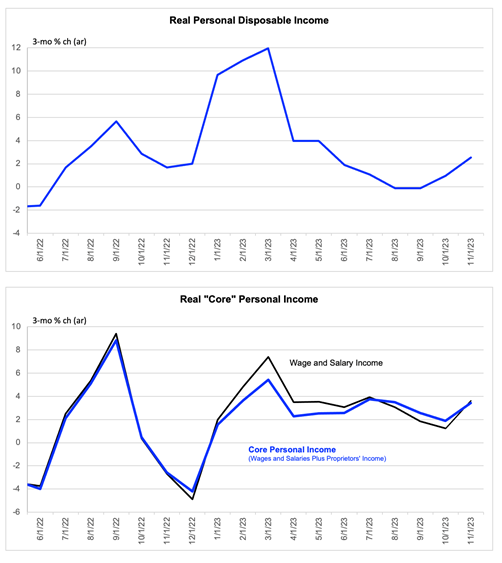
Nominal Income Growth: Nominal income growth continues to be robust and the real labor income proxy looks quite strong. As Gerard noted, “the measured growth rate is highly sensitive to base effects. For example, the 3-month rate is 2.2% (ar) while the 6-month rate is 6%, despite the absence of evidence of a slowdown. Gerard would put the trend, just looking backward, in a range of 3% to 4%. The pre COVID trend was 2.3%.
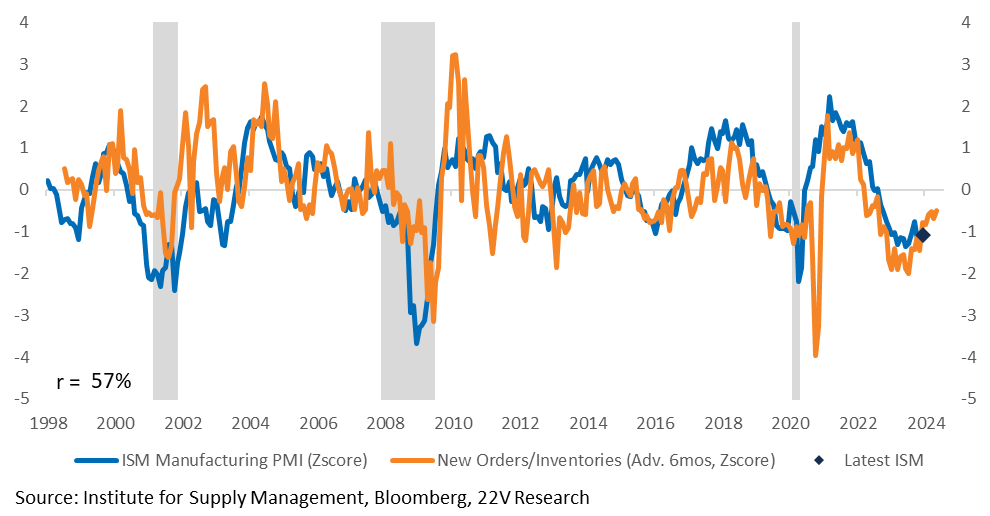
Industrial Activity: Industrial activity and durables demand also seem to be picking up from a long trough…
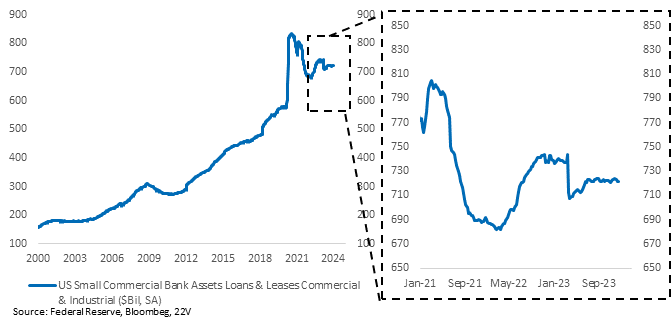
Bank Lending: Lending from small and medium-sized banks has slowed from its peak but remains at relatively high levels.
Background Longer Term Supports: In addition to the points mentioned above, there are two structural factors favoring low odds of a quick move into recession. First, it is reasonable to question whether it might be possible for the US economy to fall into recession with the fiscal deficit near 9% of GDP (in Q3) and with the private sector financial balance at +6%. It would be unusual for the economy to transition from expansion into recession when the most recent history has been one of the most extremely rapid balance sheet repairs in the private sector in aggregate.
The improving household financial balance helps explain why credit HAS NOT been a support to consumer spending. There has actually been a very steep deceleration of credit support to the flow of consumer spending, which Gerard measures as the flow of consumer installment borrowing plus mortgage equity withdrawal (MEW). During 3Q, mortgage borrowing ran at about $350 billion (ar) for the second quarter in a row. This is down from the $1 trillion during the first two quarters of last year. Mortgage Equity Withdrawal (MEW) was marginally negative for the second quarter in a row. Meanwhile, consumer instalment borrowing got cut roughly in half to $114 billion (ar). So, total support to PCE from household sector borrowing has slipped to about $100 billion, down from $900 billion four quarters ago.
Source: Federal Reserve, CBO, FH calculations
Data are actual to Q2.
The surge in household net worth is the second driver of very strong real personal consumption expenditure growth, in addition to strong labor income. Growth in household net worth since pre-COVID has been substantial, to the tune of +$37.5T since January 2020. Bottom line, wealth effects are likely to keep savings rates lower than the pre-COVID trend. FYI this should be the focus, not “excess savings.” Bank deposit growth was almost entirely about QE, NOT fiscal stimulus. The Fed buys Treasuries from banks, not from the government, and the cash shows up as deposits at the banks. It’s not individual savings.
Risks: The fundamental and modeled backdrop suggests a Normal / Growth economic regime. The clear risk given our view is inflation / growth that remains too strong, leading to tighter financial conditions. It is premature to focus on the Fed having to tighten financial conditions. As Peter Williams notes, “the inflation outlook for H1 seems relatively benign given continued used cars and broader core goods deflation, as well as some slowing in official rent measures.” Goods disinflation has been intense.
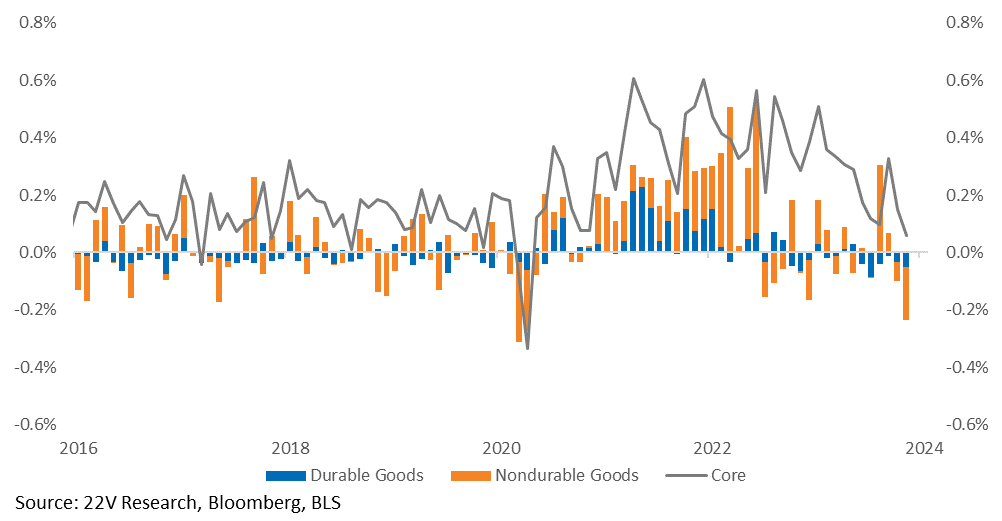
Gerard had an interesting report out (HERE) discussing the implication of a bounce in housing, the most interest rate sensitive sector of the economy, at the time the Fed appears to be pivoting. There is a possibility the Fed is wrong about financial conditions being a drag on growth. Financial conditions are an imprecise thing to measure after all. The implied risk to equities is that strong data becomes bad news again because the Fed needs to re-tighten financial conditions (and with even more uncertainty this time).
What we framed in the section above could be used to argue for an economic reacceleration, however, real personal income is set to move lower as nominal wage growth slows. That is a significant check on economic growth.
Source: BEA, FH calculations and estimates
And as Peter Williams pointed out, 10yr yields and the broader tightening of financial conditions will act as a governor on GDP growth. Even without the Fed ever having to do anything (besides jawboning) I.e., the increase in 10yr yields helps cool economic growth, when that happens, future inflation risk declines and 10yr yields stabilize/decline some as the economy cools.
2024 Buyside Expectations
Investors think too slow growth is the biggest risk to markets in 2024 (53%). Only 33% think too fast growth is the biggest risk. We think faster growth is the larger risk.
2024 Sectors: 30% of the investors we polled think Tech will be the best performer in 2024 and 15% think it’ll be the worst. Health Care has the second largest net best – worst (and only 5% expecting worst). Discretionary and Fins are popular longs too. Staples and Energy are far out of favor.
2024 Factors: Investors like both Value and Growth (conveniently fits our GARP framework for 2024) and think risk-off and momentum will be the worst performers.
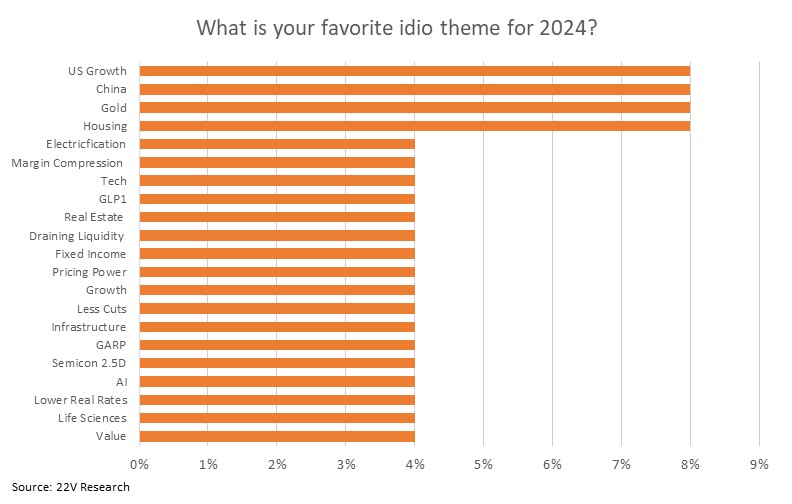
Themes: Respondents favorite themes were varied, but US Growth, Housing, China, and Gold were identified as the top four favorite themes for 2024.
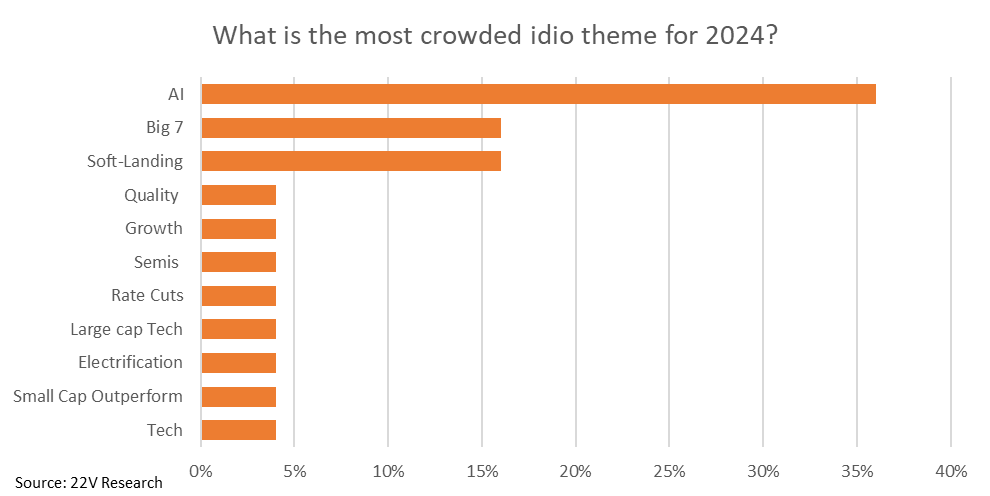
The theme that investors thought was the most crowded for 2024 is AI followed by the Big 7 and soft-landing.
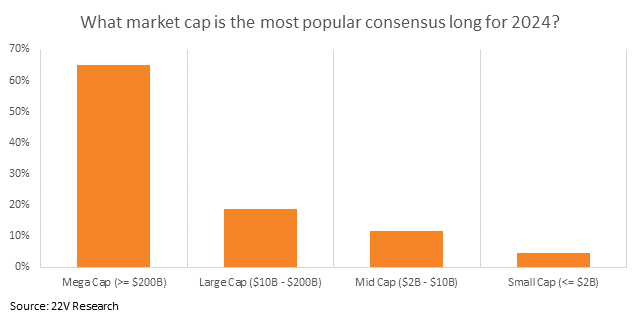
We surveyed investors on the most popular market cap, sector, and factor consensus long for 2024 too. Investors believe that the most popular market cap consensus long for 2024 is mega caps (>=$200B).
Tech was identified as by far the most popular consensus long sector for 2024.
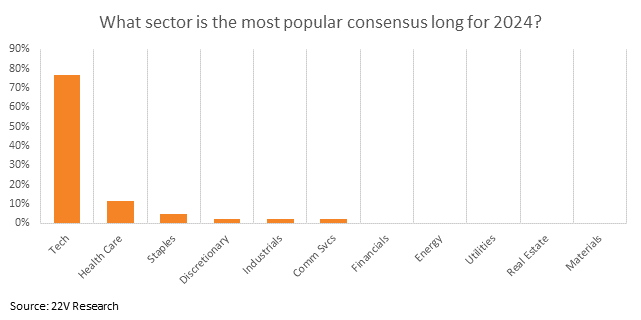
And quality was the most popular consensus long factor followed by growth.
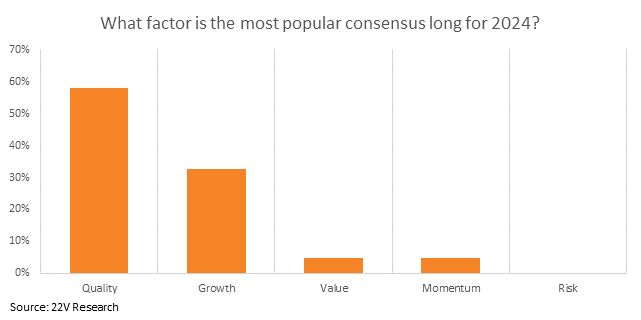
We also polled investors on the most popular consensus long idiosyncratic theme for 2024. The idiosyncratic theme that respondents think is the most popular consensus long for 2024 is lower rates followed by GARP and AI. Rates made up 1/3 of all answers, indicating that investors believe the consensus is very focused on rates.
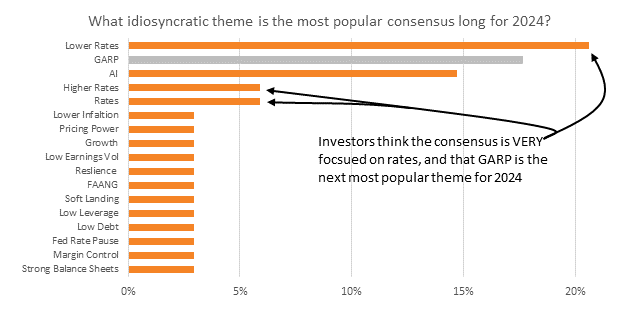
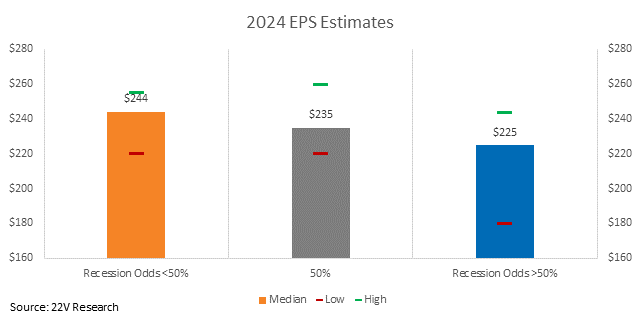
The investors we polled put the odds of a recession in 2024 at 50%. Investors believe that recession odds are still elevated despite a bias towards <50%.
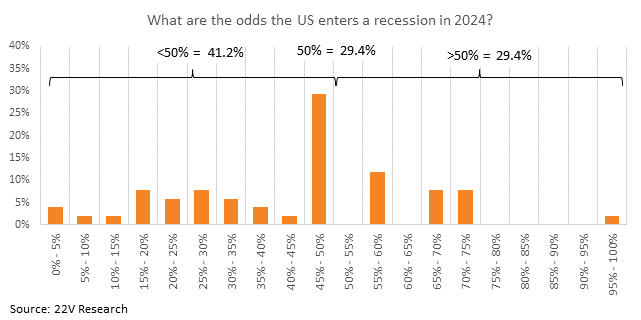
2024 buyside EPS estimates are classified into three categories: not expecting a recession, recession odds 50/50, and those expecting a recession. The median 2024 EPS for those who do not think there will be a recession is $244. Those who think there is a 50% chance there will be a recession believe that the 2024 EPS is $235. Those who expect a recession predict the 2024 EPS will be $224.