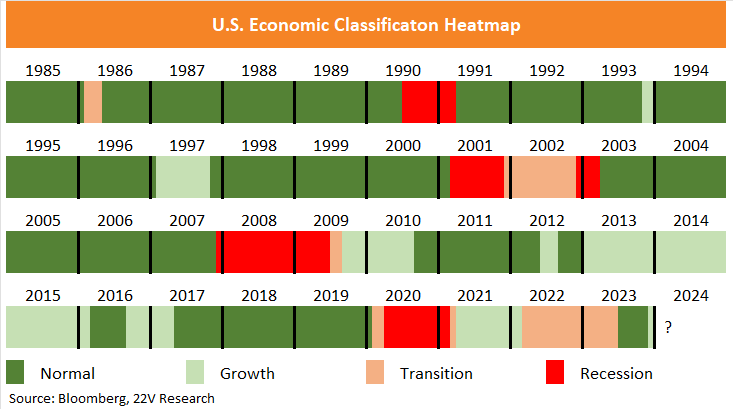
Incremental macro data over the past month has increasingly made it clear that the debate for early 2024 is not if a recession is coming but how much the economy is accelerating. Our Macro Regime Model, which incorporates changes and distributions of 17 macro series, signaled a shift away from high recession risk back in July. the important high level takeaways are 1) the macro backdrop has moved decisively away from recession; 2) macro data are at odds with our 2024 survey that showed 53% of the investors concerned about growth being too slow (HERE). As investors ease up on slowdown concerns, we expect to see internal rotations into riskier market segments and areas that benefit from better than expected growth.
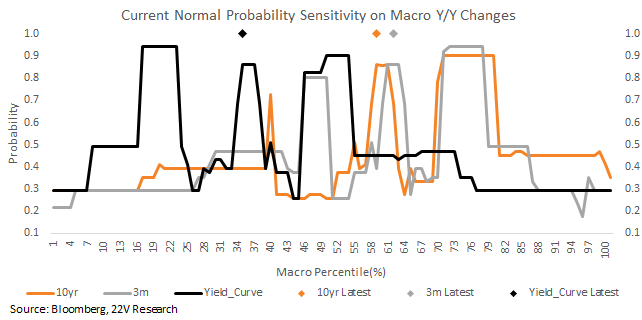
Yields and the yield curve have been a leading feature for the Macro Regime Classification model. Sensitivity analysis shows that there is a narrow range for yields needed to maintain a Growth regime. Rates and yields are still high relative to history and PMIs are low, so today’s backdrop remains a combination of Normal and Growth regimes. Expect some movement between Growth and Normal regimes over the coming quarters. What this shift means is that the economy is solidly in an expansion regime.
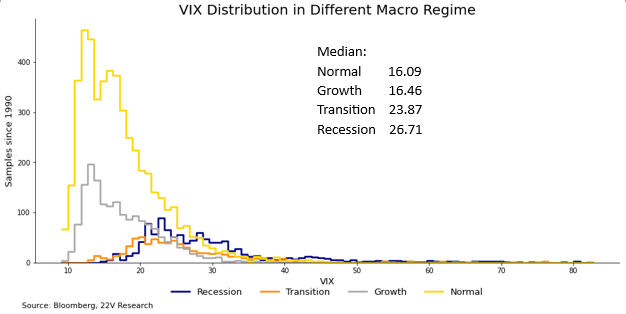
One of the most important things to internalize about the shift into an expansion regime is that the distribution of major market forces shifts. The moments of implied volatility readings in both Normal and Growth regimes are very different than during Transitions and Recessions. One striking difference is that the median, average, and mode of the VIX are MUCH lower in Growth and Normal periods. As long as the macro regime is one of expansion, vol moving to the low/mid-20s is a reason to sell vol, add to positions, NOT get more defensive.
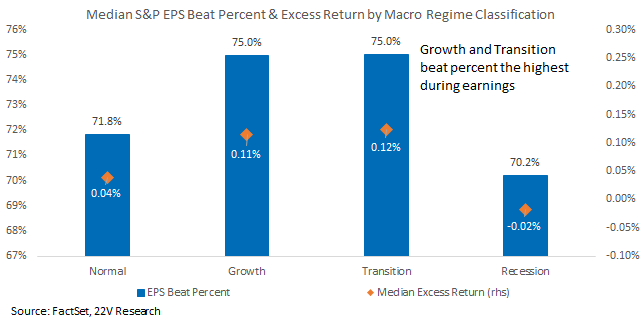
4Q earnings are about to start and S&P EPS beat percentages are higher during historical Growth and Transition periods. The Differences in beat percentages are fairly small, but the shift into a Growth phase ahead of 4Q is another sign that beats will be better than expected, particularly given the how macro negatively has impacted management sentiment (HERE).
Macro Regime Shifting Rapidly into a Growth Period: Incremental macro data over the past month has increasingly made it clear that the debate for early 2024 is not if a recession is coming but how much the economy is accelerating. Our Macro Regime Model, which incorporates changes and distributions of 17 macro series, signaled a shift away from high recession risk back in July. That model has shifted again putting a high probability on the macro regime being one of strong growth. We discuss the implications of that shift in the full report, but the important high level takeaways are 1) the macro backdrop has moved decisively away from recession; 2) macro data are at odds with our 2024 survey that showed 53% of the investors concerned about growth being too slow (HERE). As investors ease up on slowdown concerns, we expect to see internal rotations into riskier market segments and areas that benefit from better than expected growth.
Since October, the odds of being in a Growth regime have increased, and those spiked higher in December as yields moved lower and PMIs stabilized. Rates and yields are still high relative to history and PMIs are low, so today’s backdrop remains a combination of Normal and Growth regimes. Expect some movement between Growth and Normal regimes over the coming quarters. What this shift means is that the economy is solidly in an expansion regime.
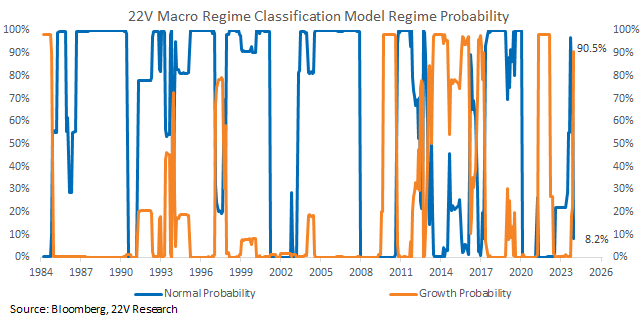
Yields and the yield curve have been a leading feature for the Macro Regime Classification model. Sensitivity analysis shows that there is a narrow range for yields that keep overall Growth probability above 50%. Uncertainty around the path of real growth path and yield remains high. And Fed decision making is exogenous to the model. Volatility in policy communication can lead to volatility in the macro regime. Barring a broad weakening of data though, the volatility will be between Growth and Normal, not into Transition periods.
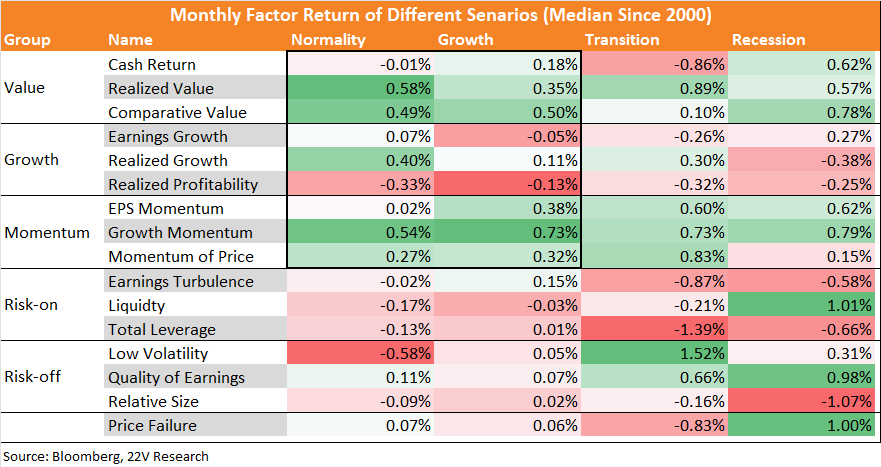
At the factor level, the shift from Normal to Growth is minor. In both periods fundamental factors tend to deliver the best returns and Momentum is an important screening tool. We continue to expect GARP and risk-on to gain near term. Momentum became entangled with risk-off throughout 2023, which will work against the factor near-term as internal rotations continue.
One of the most important things to internalize about the shift into an expansion regime is that the distribution of major market forces shifts. The moments of implied volatility readings in both Normal and Growth regimes are very different than during Transitions and Recessions. One striking difference is that the median, average, and mode of the VIX are MUCH lower in Growth and Normal periods. As long as the macro regime is one of expansion, vol moving to the low/mid-20s is a reason to sell vol, add to positions, NOT get more defensive.

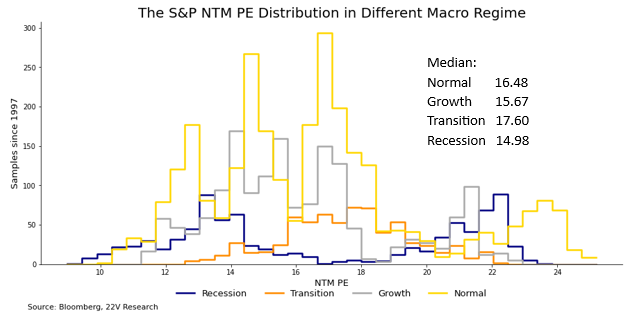
The distribution of multiples is another story. S&P NTM PE during Growth periods has been relatively range bound between 14-18x, with a median slightly below that of Normal periods. But as the chart below illustrates, the distribution of PEs is multimodal. At ~20x right now, the S&P is trading at the high end of its range, which is a modest headwind for the market. That being noted, fundamental expectations are going to matter a lot more than the level of PEs when thinking about near term market movements.
4Q reporting is about to start and we expect that will provide support for the S&P. S&P beat percentages are higher during historical Growth and Transition periods. The Differences in beat percentages are fairly small, but the shift into a Growth phase ahead of 4Q is another sign that beats will be better than expected, particularly given the how macro negatively has impacted management sentiment (HERE). Increasing soft landing odds is also a support for earnings sentiment recovery, increasing odds of better beat rates during 4Q reporting.