A repeated story coming out of 3Q earnings reporting is that company managers have grown increasingly concerned about the economy. Actual numbers in 3Q were strong with S&P EPS ending $3 higher than expected at the start of reporting and margins expanding 50bps to pre-rate hike levels. The concern coming out of reporting was that we are at an inflection point that will lead to slower EPS growth ahead. Negative revisions reflecting those concerns, with consensus 4Q23 S&P EPS no at $55 (+1.8% y/y), down from $57.80 (+7.5%) at the start of 3Q reporting.
Earnings being revised lower as economic growth slows isn’t a surprising event and the 11% EPS growth estimates for FY24 are probably too high under anything but a smooth soft-landing scenario. The reason to expect better than currently expected earnings in 4Q is that management remains broadly positive about their own companies. Management sentiment toward their own businesses, and profitability remain strong. The most intense negative management commentary was around external forces – the macro economy and unspecified headwinds/fading tailwinds.
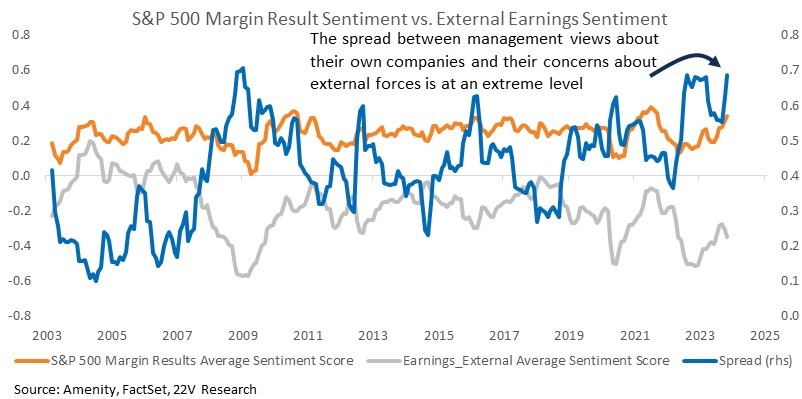
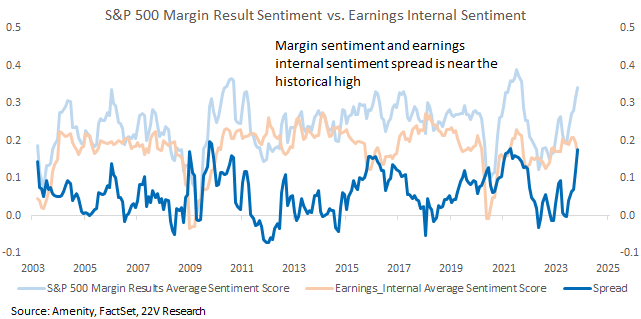
If the economy is on a path to recession, management concerns will be realized. As we have noted though, there is very little in the macro backdrop that suggests a recession is imminent (HERE). Data looks increasingly like the economy is moving closer to a growth phase than slipping into a recession. At the same time, management sentiment toward profitability has continued to move higher. The last time a spread like this existed was early 2009, but back then management was still very negative on earnings internals as well as macro headwinds.
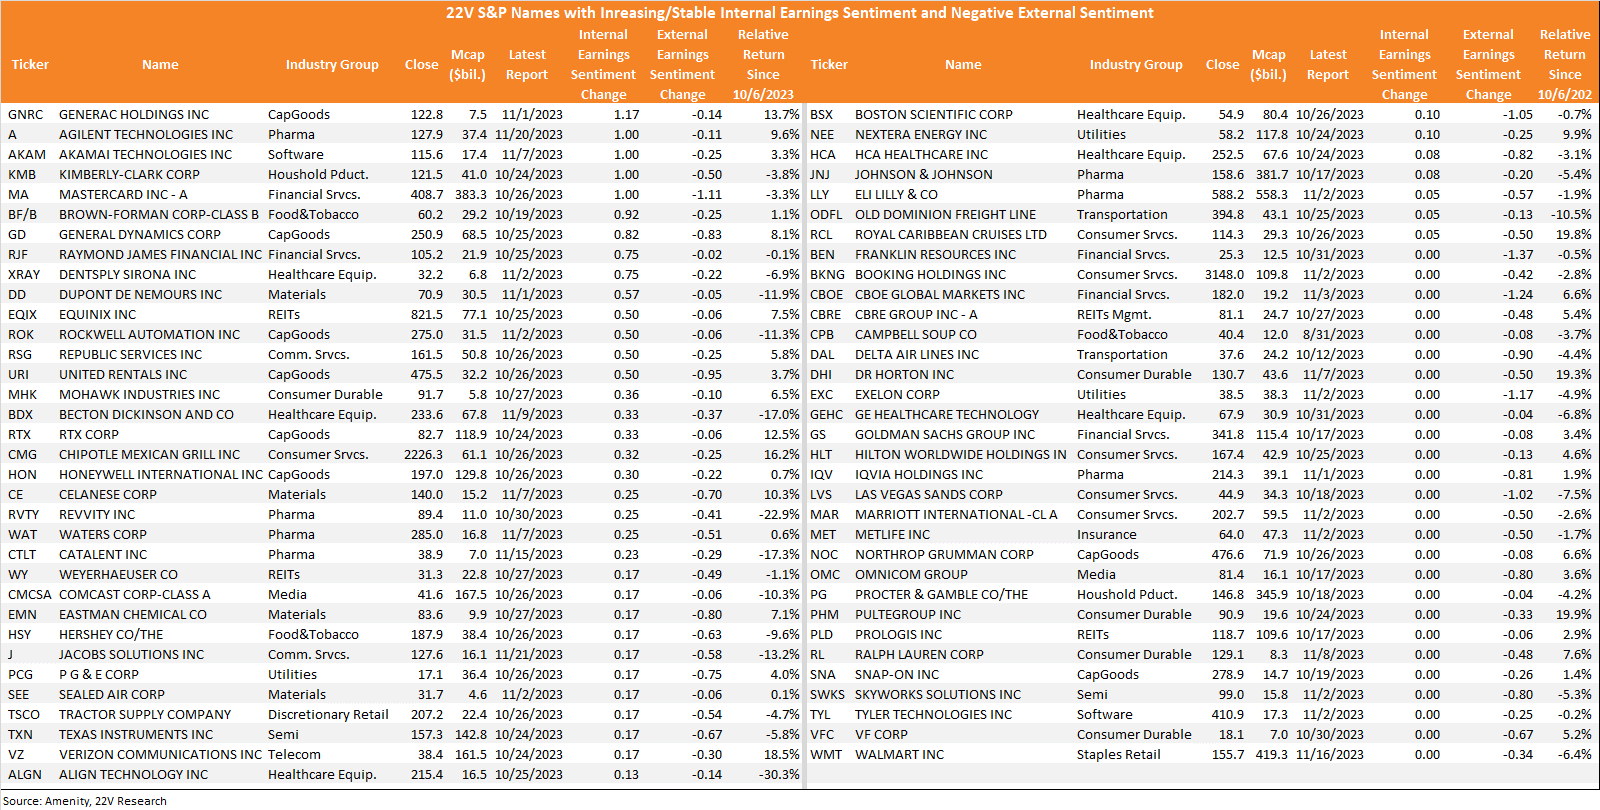
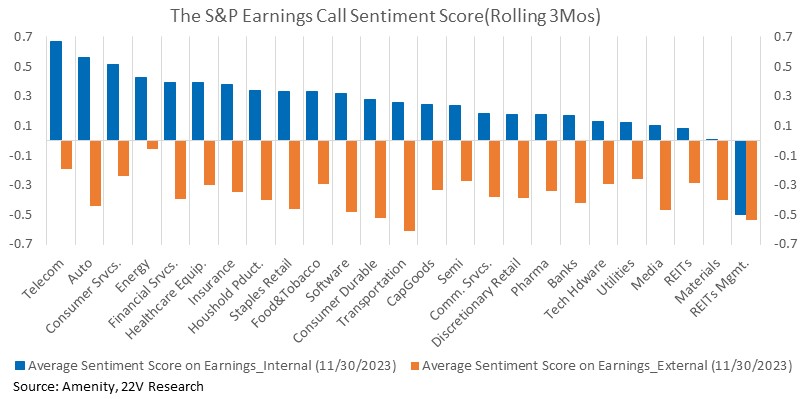
At the industry group level, almost all groups now have positive internal sentiment and negative external sentiment. The biggest spreads (positive internals, negative externals) are in Autos, Telecom, Software, Durables, and Staples Retail. At the end of this report, we list the S&P companies with the largest internal vs. external sentiment spreads. These are the stocks where management was most positive on their internal outlooks and more negative on the macro risks.
4Q Earnings Could Be Much Better Than Currently Expected: Management sentiment toward their own businesses, and profitability was strong coming out of 3Q reporting. What made headlines during reporting was the intense negative management commentary around external forces – the macro economy and unspecified headwinds. That has increased concerns that an economic inflection point is coming that will lead to slower EPS growth. Negative revisions reflecting those concerns, with consensus 4Q23 S&P EPS no at $55 (+1.8% y/y), down from $57.80 (+7.5%) at the start of 3Q reporting. The widening spread between internal views and external risks creates room for positive revisions IF the economy doesn’t slow rapidly.
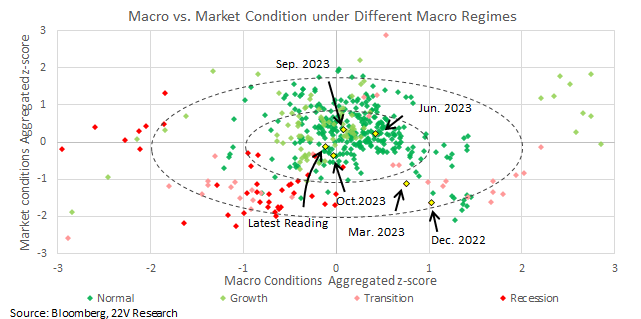
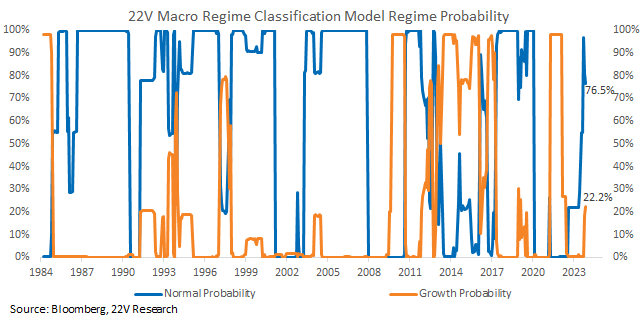
Our macro regime classification model puts the economy in a solid expansion with little in the macro backdrop to suggests a recession is imminent (HERE). That is reinforced by the dovish shift in Fed rhetoric around inflation, and their willingness to allow some easing of financial conditions. A recession could still happen, but the burden of proof has shifted. Until hard data deteriorates significantly or the Fed signals its intent to tighten financial conditions materially a no recession outcome is the quantitative base case.
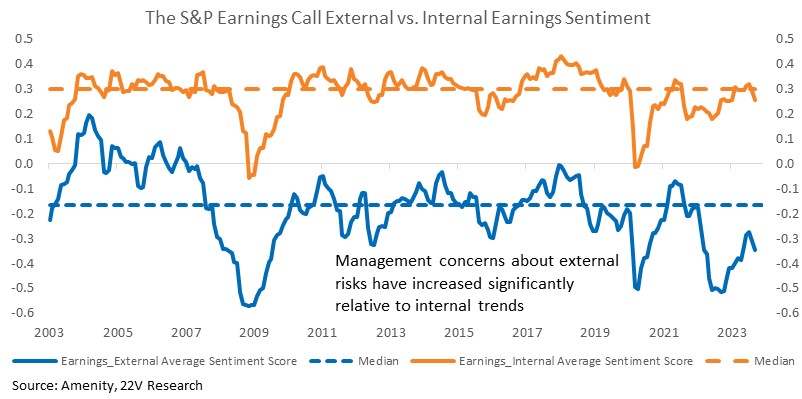
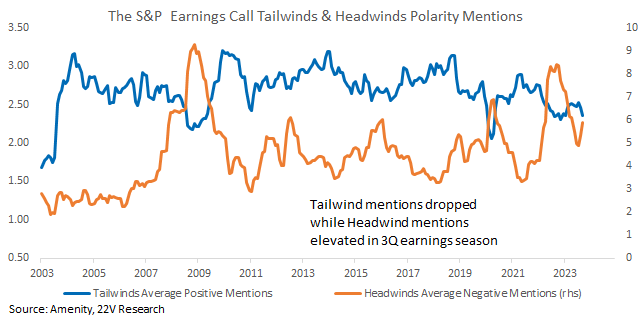
Concerns towards recession risk and general macro headwinds have led to fewer macro Tailwind comments and increased macro Headwind concerns. Historically negative headwind mentions were more volatile and cyclical. That makes sense. Macro concerns are poorly defined and hard to quantify, particularly for company managers that many be significantly removed from broad economic trends.
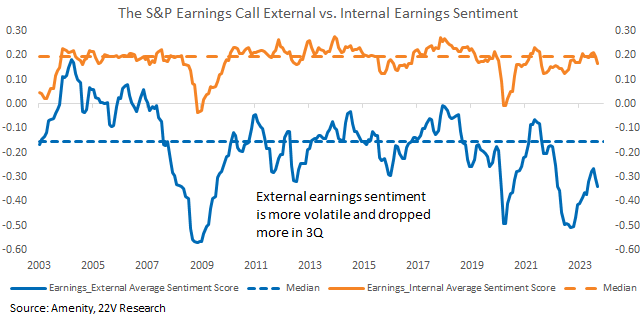
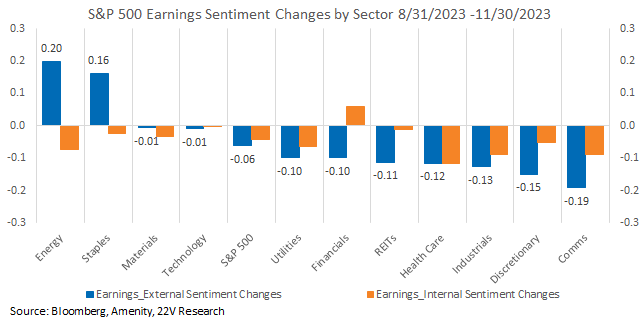
We break earnings sentiment into two groups, externals which reflects the impact from macro events, and internals which are more tied to business trends, consumer shifts, industry or operational changes. Both the internal and external earnings sentiment declined in 3Q, so there is some softening of internals too, which is what we expected to see given the slowing of economic activity coming out of the 3Q growth surge. External earnings sentiment has dropped faster and from a much lower level though, reflecting how much broad macro concerns are weighing on company views.
As our Macro Regime Model indicates (details HERE), the current macro backdrop looks increasingly Normal. That is consistent with other broad recession risk measures, which show declining near-term recession odds. We are not predicting a rebound of earnings sentiment into 4Q, but weakness in sentiment should ease as vague macro concerns dissipate.
At the sector level, Energy has the highest earnings sentiment both internally and externally. Defensive sectors have better external earnings sentiment, which makes sense as their earnings are less impacted by macro cyclicality. Staples and Discretionary have relative better internal earnings sentiment, which is in line with the still strong consumer demand trends.
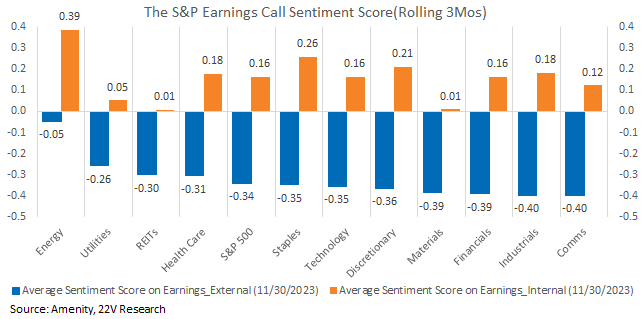
Energy and Staples are the only two sectors posting improved external earnings sentiment over the past quarterly, while Early Cyclical sectors, Communications and Discretionary have seen the most external earnings sentiment decline. That leaves some sentiment rebound more likely within those sectors if a sharp slowdown is avoided.
Historically there is a strong correlation between margin results sentiment and internal earnings sentiment. However, the series diverged in 3Q as margin results sentiment continued to climb along with strong margin readings. If a soft-landing can be achieved, earnings sentiment is likely to rebound to catch up with margin changes, or if macro or market deterioration weights on stock profitability, margin sentiment may face more downward pressure.
At the industry group level, almost all groups now have positive internal sentiment and negative external sentiment. The biggest spreads (positive internals, negative externals) are in Autos, Telecom, Software, Durables, and Staples Retail.
To help screen for potential upside surprises, companies that could see upward revisions to guidance and estimates ahead of 4Q reporting, below we list the S&P companies with the largest internal vs. external sentiment spreads. These are the stocks where management was most positive on their internal outlooks and more negative on the macro risks.