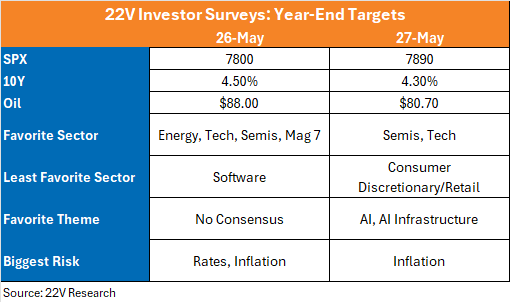
Weekly – Per the new format, we mark to market our main themes each week. Themes are bolded and market to market follows.
Theme – Lower Speed Limit Economy. GDP growth needs to be at or below 2%, assuming productivity trends hold at roughly 2%, to keep inflation in check. This theme is low conviction, as it is based on macro variables that are hard to measure in real time (Productivity and Unit Labor Costs). Marking to Market – PCE price data came in a bit less warm than consensus estimates but still supports our 2% or below GDP growth theme. The ex-tariff pace of inflation has quickened with the 12-month rate running at least 2.5%. That is 50 basis points above the Fed’s target, making it more likely the Fed will target GDP growth at or below 2% for the next few quarters to avoid a renewed tightening of the labor market. Current core inflation DOES NOT indicate a need to raise rates. 2% GDP growth with no rate hikes is a fine backdrop.
A recurring question in meetings, related to this theme, is whether the Fed will raise rates. Our view is that the Fed will likely accept slower growth rather than hike rates. The economy SHOULD slow some from the current unusually strong pace of underlying demand as the fiscal impulse and post-tariff reacceleration tailwinds fade (consumer, business activity-ex AI – and hiring trends seemed to pause in 2H25 and are bouncing back). If growth slows to the 2% range as we expect, the Fed is unlikely to cut. Our call supports some flattening of yield curves over the next 3 – 6 months but is not negative for risk assets (more below).
Moving to a Hawkish Bias Would Make Us Negative on Risk Assts. We Are Not There. What Would Lead to the Fed Being Hawkish – The Fed moving to a hawkish bias mean the Fed attempting to force GDP growth well below 2% and the urate higher to reduce inflation. Recession probabilities would increase, and risk assets would suffer. Peter Williams believes moving to a hawkish bias would likely require a series of inflation prints over the summer hot enough (roughly a series of 0.3s) to bring the Fed’s 2026 forecast close to 3.5%. Fundamentally, hawkish policy would come from the Fed being forced to capitulate on their benign ‘26H2 and ’27 inflation forecasts. Last week’s core PCE data came in at 0.2% MoM.
Theme – Stay long risk assets in general (small caps), cyclicals, and fundamental factors like Earnings Momentum, Growth Momentum, Value, GARP: Marking to Market – Risk-on internals were supported by data last week. The Market Internal Regime remained in Everything Rally for the second consecutive week. There has been a sentiment shift from Strait of Hormuz (SOH) over the past few weeks (UST yields and oil prices lower) and PCE data were less bad. In May, the market experienced two Broad Sell-off regimes in the first two weeks, when inflation worries increased significantly.
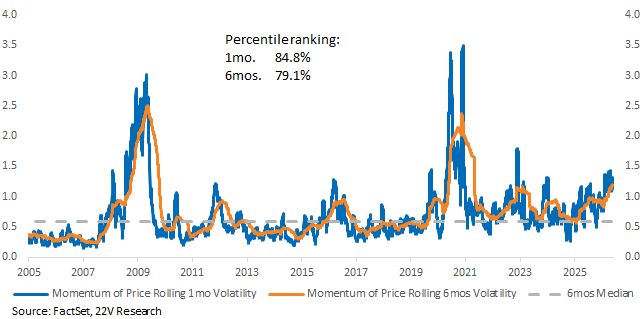
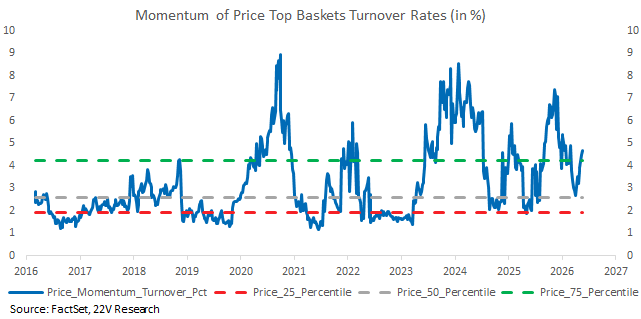
We are long Price Momentum long term, BUT, as we highlighted last week (HERE) the Volatility of Price Mo has been rising for both short-term and long-term this year, currently reaching its 80th %tile. The turnover rate for the factor has also climbed higher, implying: 1) higher factor volatility short term; 2) increased chasing of momentum gains. Both suggest increased risk for forward drawdown. We argued a fading of the price Momentum factor in the 5/17 weekly (HERE) and it will probably continue for a bit as some lagging Cyclicals that are not in the Momentum baskets, (Software, Retail, Airlines, Banks) catch up some.
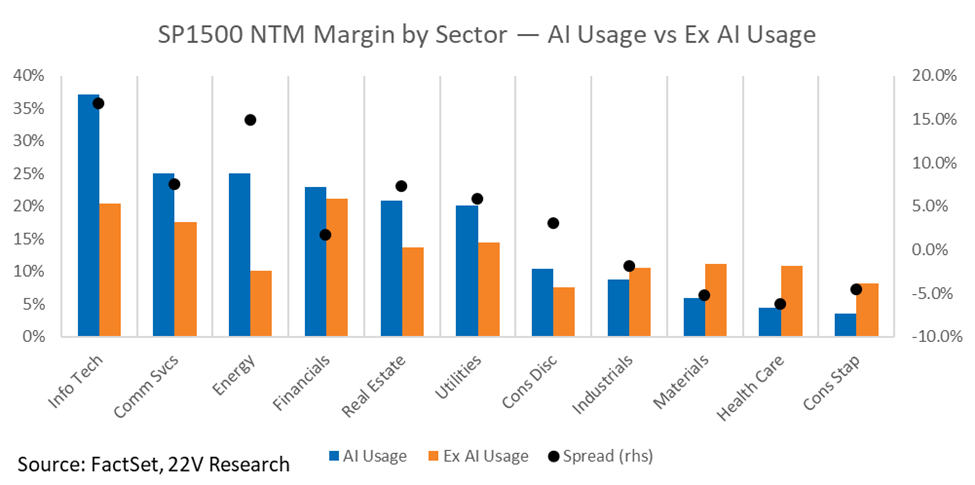
Theme – Idio, particularly AI driven Idio, is the Major Driver of Returns: Marking to Market – The risk to AI Capex spending remains low as 7 of the 11 sectors in the S&P 1500 show higher NTM margins for AI users vs. non users. The more industries that benefit from AI, the higher the justifiable spend, and the more bullish it is for the AI buildout beneficiaries longer term.
Idio We Like – Two weeks ago we noted that being short bonds (long yields) and long Defensives requires the SOH to stay closed for longer. Sentiment has become increasingly bearish on bond prices (bullish yields). We expected a sharp reversal lower in Defensive sectors and higher in Retail, Banks and Airlines assuming the SOH situation did not get worse (5/20 Daily). Non-AI related inflation hedges, which we define as Deep Cyclicals (Energy, Industrial, Materials) that do not benefit from AI demand have suffered since and we think Retail, Airlines and Banks have room to the upside still.
Dauvin Peterson, 22V’s Data Infrastructure and Commodities expert, identified liquid cooling as one of the best investment themes of the AI buildout. In short, the thesis is based on a higher than expected TAM given next generation of chips require liquid cooling (Dauvin’s full explainer HERE). ECL is a good potential long – it’s one of the primary beneficiaries but is lagging the rest. Dauvin has a recap of a conversation with IR HERE that helps clear up the investment thesis.
Tickers: MOD, ETN, SU FP, ECL, MAIR, JCI, TT, CARR, CC and DOV
At the beginning of earnings season, we argued there may be some upside in S&P 500 Software ex Hyperscalers IF enough companies began proving they weren’t being displaced by AI, given the hits to forward earnings growth and cash return already priced in. Net net, earnings and the narrative shift around earnings reinforce our view that Software ex Hyperscalers is no longer an obvious short.
We were lucky enough to host a webinar this week with João Landau, Founding Partner & CIO of Vista Capital, one of Brazil’s leading hedge funds. Replay link HERE.
João thinks there is asymmetric upside in domestic-facing Brazil equities, with the presidential election as a catalyst (replay HERE).
Background supports are: 1) real interest rates stabilized around 8% over the past year, 2) the unemployment rate has reached historic lows of ~5%, 3) inflation has exceeded forecasts but remains relatively contained given the urate (this has been a major surprise), and 4) Brazil’s equity market valuation has reached decade lows, with IVBX P/E ratios around 12x.
Theme – FCI Tightening Risks is More About Labor Costs for Now. Marking to Market – This has moved a bit to the background but is still relevant. Short story, with real GDP growth running +2%, a lower unemployment rate (<4.2%) or higher wage growth (>4%) would increase the odds that financial conditions tighten. None of those are happening yet, but we have the payroll report this coming week and that will be important.
FYI – The current 3.8-4% wage growth trends minus 2% productivity = roughly 2% core inflation OVER TIME. What is happening now suggests that the current inflation overshoot does not originate in the labor market. According to the standard economic models, the current bout of high inflation is LIKELY transitory. This helps explain why longer term inflation expectations (5yr5yr forward) are still anchored and financial conditions easy. If investors didn’t believe the current bout of inflation was transitory, 10yr yields would likely be much higher.
Charts related to the comments above are below.
INFLATION IS MAIN CONSTRAINT: According to investors, inflation is the biggest risk to equities. That is why some slowing of economic growth in 2H26 (our call) is not negative for stocks. 10yr yields and inflation expectations will likely move lower IF growth slows some.
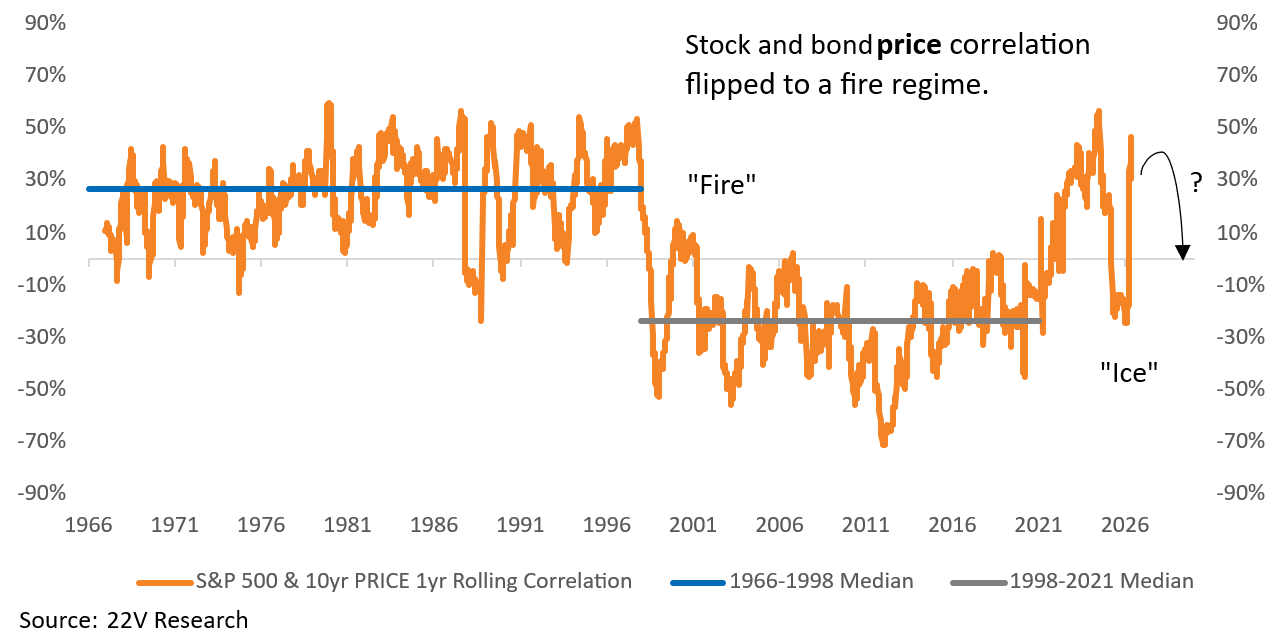
The negative correlation between stocks and bond yields reinforces our view that inflation is the constraining factor on the Cycle.
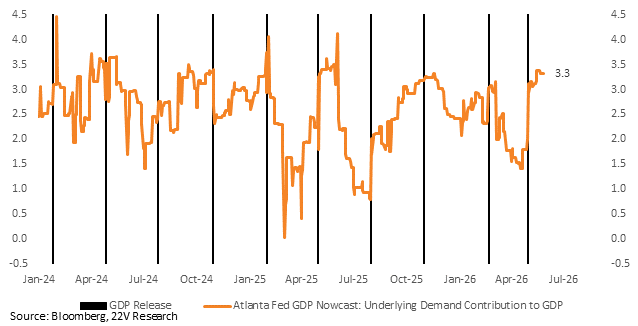
The appropriate neutral rate appears to be higher because the economy has proven more resilient than expected to the Iran war. The Atlanta Fed GDPNowcast is currently tracking +3.3% “core” GDP growth (consumption + investment) for 2Q. We cover the details in full in a short video HERE. Lower demand growth would lower inflation risk.
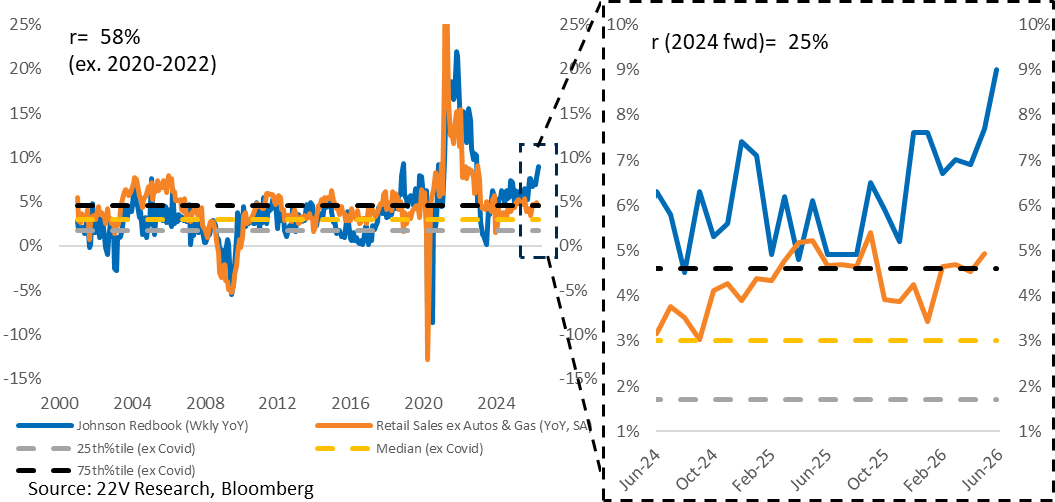
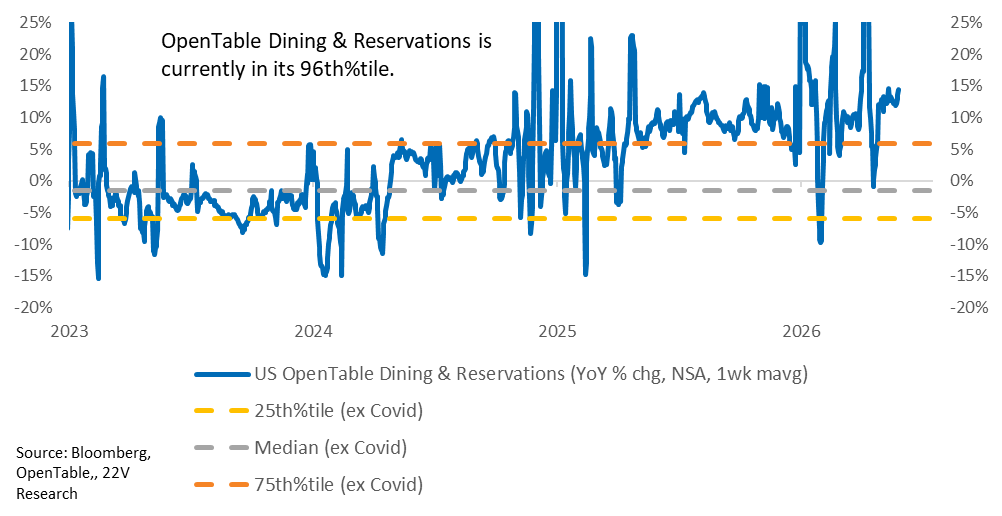
Consumer Spending Remains Strong. Johnson Redbook and Open Table data remain unusually firm. From the Bernstein Strategic Decisions Conference, according to BAC: employment key – yes, airline spend is up (more tickets bought + higher prices), gas spending higher, restaurant spend higher, but employment is the key.
IDIO DRIVER OF RETURNS: AI spending will ultimately be justified by margin improvements across as many users as possible. 7 of the 11 sectors in the S&P 1500 have higher NTM margins estimates for AI users vs non users. The largest improvements are estimated to be in asset light, high labor cost/revenue sectors, like Tech. This is supported by the companies that quantified their AI improvement in Q1 having higher Selling, General & Administrative expenses/revenue than the rest of the index and lower Property, Plant & Equipment (HERE).
The volatility for Price Mo has increased in 2026. Both the short-term and long-term factor volatility are up near their 80th %tiles, which is rare outside of recessions.
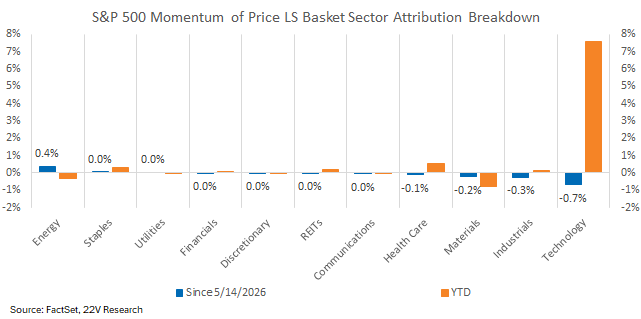
The return breakdown for Price Mo shows Tech exposure is a large contributor to the factors YTD gains. Momentum vol is tied to sentiment swings around Tech in general and AI in particular.
The turnover rate in the top decile of Price Mo top has increased sharply since April, suggesting increasing investors disagreement about factor forward performance. Though higher turnover rate itself doesn’t suggest future drawdowns, the current 80th %tile reading implies : 1) higher factor volatility short term; 2) increasing momentum chasing.
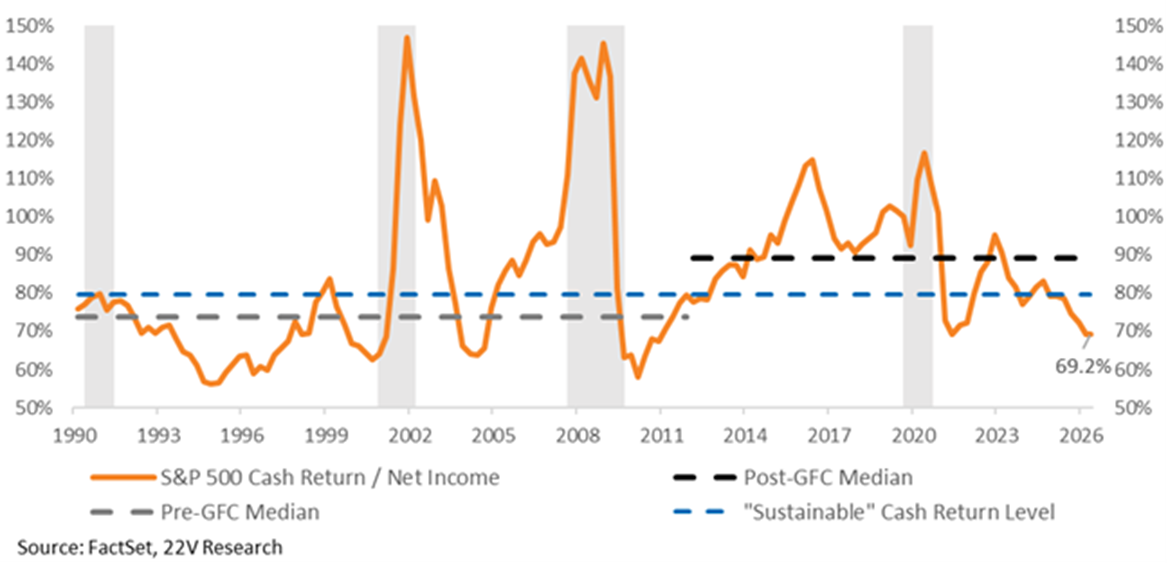
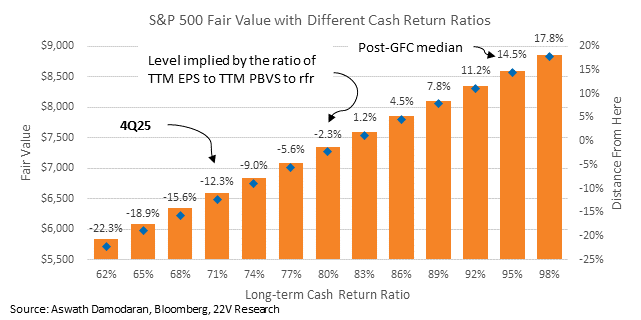
CASH RETURN & FAIR VALUE: We model fair value for the S&P 500 by discounting expected cash return (dividends + buybacks). Cash return as a percentage of net income has declined as Hyperscalers redirect toward AI capex, weighing on fair value estimates.
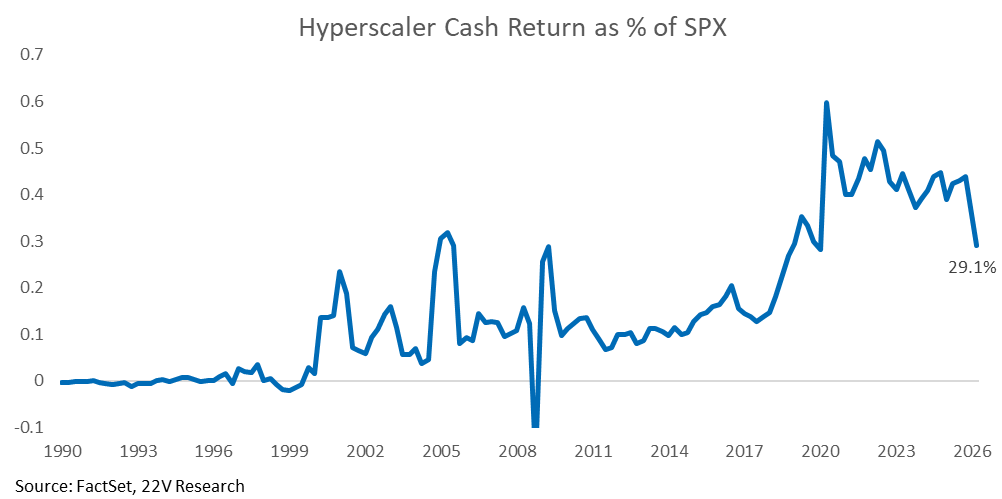
Investors are concerned that the persistent competition between Hyperscalers could impair cash returns for years. However, NVDA’s earnings highlighted a more optimistic case to consider even if Hyperscaler cash return remains impaired. NVDA is returning more of its revenue, partly from Hyperscaler spend, to investors.
If cash return stays at its 4Q level in perpetuity, fair value is another -12% lower from here. However, there’s upside IF cash return rebounds, and NVDA’s dividend and buyback announcements highlight an underappreciated way cash return can rebound even if Hyperscalers are stuck in a prolonged spending battle.
LONG DOMESTIC BRAZIL: We were lucky to host a webinar this week with João Landau, Founding Partner & CIO of Vista Capital, one of Brazil’s leading hedge funds. Replay link HERE. João thinks there is asymmetric upside in domestic-facing Brazil equities, with the presidential election as a catalyst. The background supports are: 1) real interest rates stabilized around 8% over the past year, 2) the unemployment rate has reached historic lows (~5%), 3) inflation has exceeded forecasts but remains relatively contained given the urate (this has been a major surprise), and 4) Brazil’s equity market valuation has reached decade lows, with IVBX P/E ratios around 12x.
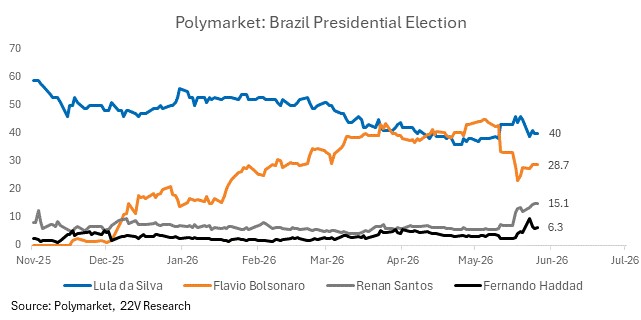
The upcoming election has been an overhang on the index. In short, investors REALLY dislike President Lula and Lula’s odds of winning have recently increased. But President Lula faces hurdles in re-election amid low approval ratings, especially among evangelicals and youth. The polls are misleading in Joao’s view. If Lula loses, there is asymmetric upside in Brazil equities that are more domestic facing. Joao made the case that local investors with money are likely to reallocate a significant amount of capital back to local Brazil if Flavio Bolsonaro wins.
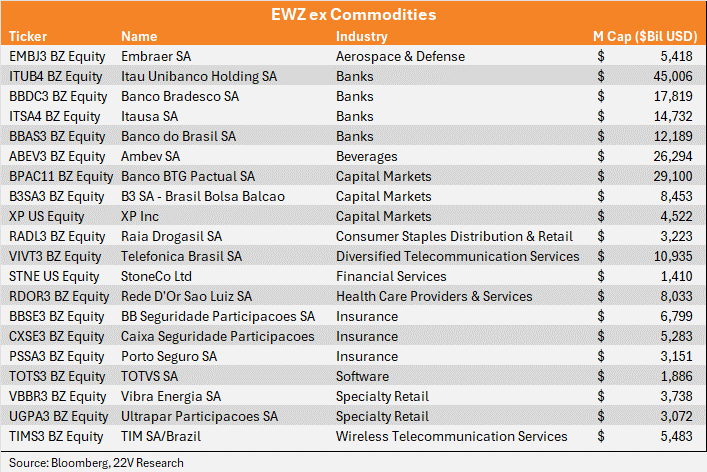
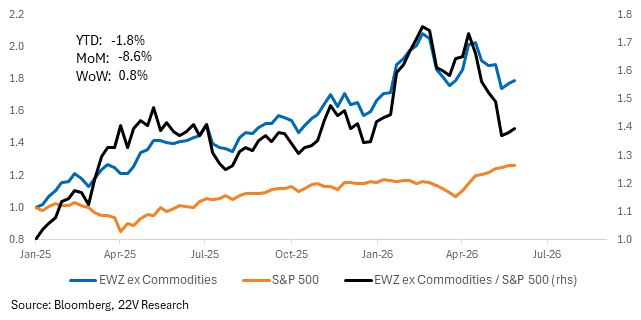
Own the EWZ ETF ex commodities. Commodities are largely driven by factors outside of Brazil but have large representations in indices. PBR (Petroleo Brasileiro) is an oil company with a 14.5% weight in the EWZ ETF. EWZ ex commodities, charted below, have fallen -14% as Lulu’s odds of winning the election have improved, which provides an interesting opportunity to be long now.