Weekly – Per the new format, we mark to market our main themes each week. Themes are bolded and market to market follows. Recent data reinforced our positive LONGER TERM macro support for risk assets, but last week we were increasingly vocal about hedging the risk of the Straight of Hormuz (SOH) being closed for longer. We start by marking to market that risk. Sorry for the caveat, but if the SOH opens tomorrow, much of the near-term risk we highlight will fade.
Short Term Risk Theme – Demand Destruction Increasingly Being Priced – Inflation data have been on the hawkish side, but the longer-term macro picture (more below) suggests a 4-4.5% 10yr yields backdrop. In the post COVID era, when the 10yr approached 4.5%, investors have discounted a greater risk of a growth slowdown. During those periods, risk-off factors outperform risk-on, Small caps underperform, and the Mag 7 outperform. The 10yr hit 4.6% on Friday after starting last week at 4.4%. Friday was a 91st %tile DoD increase in yields. The SOH closure is the primary driver of the RISK that 10yr yields increase, shorter term inflation expectations (1-3 years) move higher, and financial conditions tighten.
There has been a sentiment shifted on the SOH over the past week or so. Investors have accepted that SOH will be closed for longer. At the same time, supply pressures are becoming more intense. The FRBNY’s global supply chain pressures index jumped sharply in April and looks like it may start to press covid- and Ukraine-era levels if the SOH does not reopen soon. Supplier delivery times from the ISM readings have surged. The pass through of supply chain issues has still not fully hit the data. Commodity and Macro investors we met with last week are increasingly worried about supply shortages showing up in with-in the next 2 to 3 weeks.
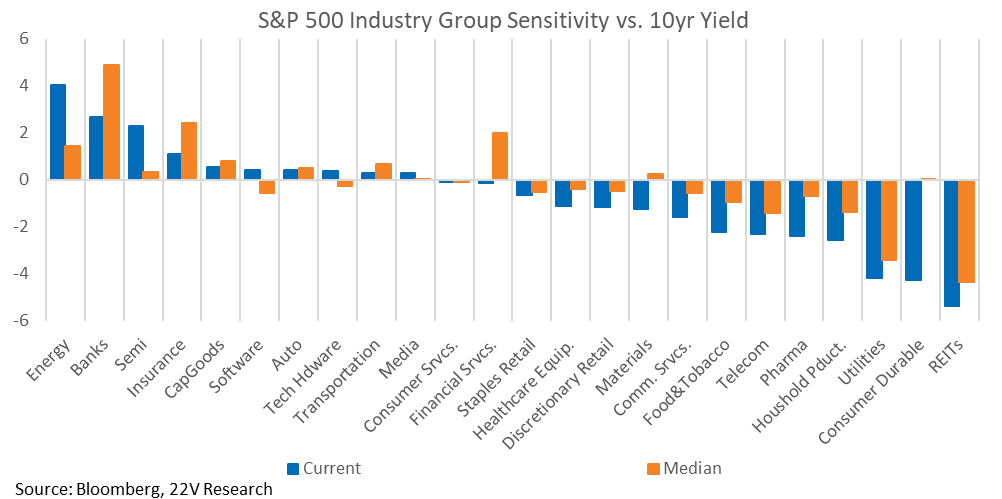
As we pointed out last Monday (HERE), beta-adjusted returns to risk-off factors started to improve two weeks ago. More than half of the S&P had negative sensitivity to the 10yr yield (HERE) and most industry groups are showing more negative sensitivity to 10yr yields than normal. Higher realized sensitivity confirms the a “higher yields are bad for risk assets” backdrop. Additionally, volatility suppression from strong earnings results is fading as reporting winds down.
All of the above is why we recommended last Monday to HEDGE against upside risk in VIX (JJ note HERE), and downside risk to the IWM and risk-on factors. Marking that call to market, the S&P 500 was flat WoW, but economically sensitive non-AI cyclicals underperformed significantly. Retailers (XRT -6.7% WoW), Banks (KRE -4.1% WoW), Airlines (JETS -6.6% WoW) and Homebuilders (ITB -7% WoW), were particularly weak. Small caps were -2% WoW and the Earnings Risk Factor was -2.8% WoW vs the Low Earnings Vol Factor. The internal market regime was classified as a Broad Sell-Off last week.
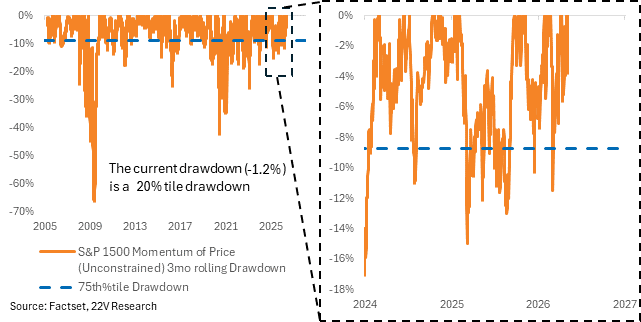
The Winners at Risk NOW – The selloff of non-AI related Cyclicals was first and that makes sense. The more 10yr yields increase, FROM HERE, the greater the likelihood that investors reduce exposure across the board and the YTD winners see a large drawdown. The Price Momentum factor has been the best performer YTD (by far), but drawdowns in Price Momentum tend to be rapid. In the most recent drawdowns – urate spiking in the summer of 2024, Liberation Day, the Iran War – it took ~2 weeks for Momentum to drop -10%. We would hedge against a Momentum drawdown now. Our Momentum factor is highly exposed to Semis, Energy, Tech Hardware, Cap Goods, and Materials. Those are the same industries that are driving small cap outperformance. This very group started to come under pressure last Friday and we would continue to hedge against downside market risk through IWM.
If the SOH opens tomorrow, much of the risk we pointed out will fade and risk-on factors will be supported. Given the positive Longer-Term macro trends highlighted below. The asymmetric UPSIDE risks IF the SOH reopens soon is non-AI themes. Those are Airlines, Retailers, Regional Banks, and Homebuilders.
Theme – Lower Speed Limit Economy. GDP growth needs to be below 2%, assuming current productivity trends hold, to keep inflation in check. FYI – This theme is low conviction, as it is based on macro variables that are hard to measure in real time (Productivity and Unit Labor Costs). Marking to Market – This theme looks too conservative, which is positive for risk assets. With real GDP growth running +2%, a lower unemployment rate (<4.2%) or higher wage growth (>4%) would increase the odds that financial conditions tighten. Neither is happening. Last week, the Atlanta Fed Wage Growth data came in at +3.8% vs 4.0% previous. Confirming the dovish trends in labor compensation in the most recent payroll report.
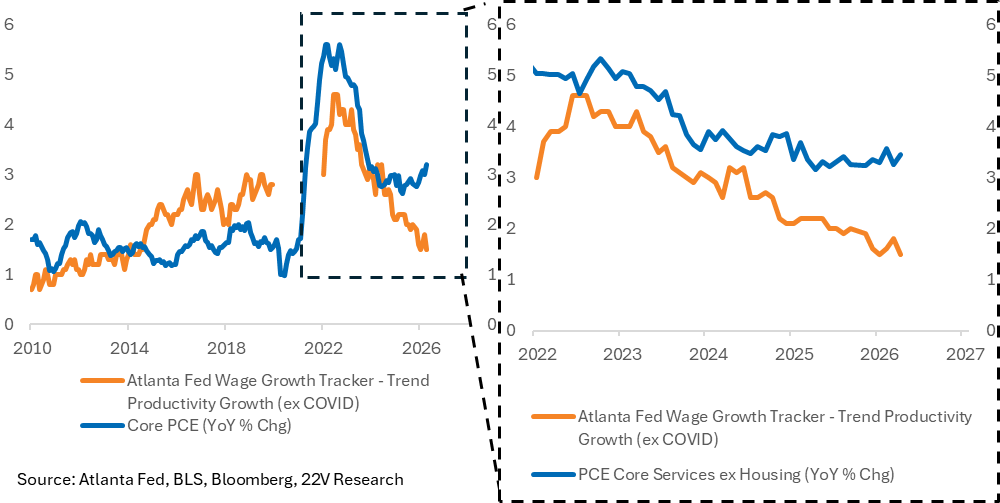
Wage growth continuing to ease despite recent strong productivity, reinforces the view that the current inflation overshoot does not originate in the labor market. According to the standard economic models, the current bout of high inflation is LIKELY transitory. This helps explain why longer term inflation expectations (5yr5yr forward) are still anchored.
It is possible core inflation stays high, defined as 3-3.5% for the rest of 2026, despite dovish wage trends. That could happen if consumers either lower their savings rates or access credit to maintain current spending levels despite weaker wage trends. The Fed needing to tighten financial conditions, despite relatively weak wage growth, would be very negative for risk assets.
Consumers could lower savings/lever up, but we would not assume that happens. The strength we are witnessing in consumer spending and economic growth today (Atlanta Fed GDPNow for 2Q26 is at +4%!) is likely related to the fiscal impulse offsetting the energy shock. The fiscal impulse should fade now and with it, some consumer tailwinds. If we are correct, the Fed will stay on hold as economic growth slows, inflation concerns would decline and 10yr yields would have downside risk.
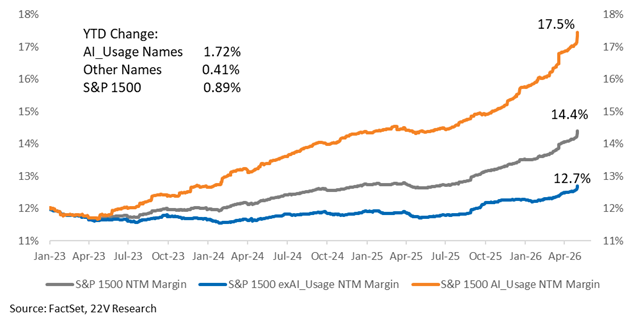
Theme – Stay Long Risk Assets in general (small caps), cyclicals, and fundamental factors like Earnings Momentum, Growth Momentum, Value, GARP: Mark to Market – Risk to this theme for now given the SOH closure. Longer Term trends favor this theme. Two points to focus on. 1) The increase in corporate margins supports the view that AI related demand is outpacing supply (HERE). That lowers the ROI risk for hyperscalers and others investing heavily in AI. Most of the 12% YTD increase in Next Twelve Months EPS estimates are attributed to margin growth rather than revenue. Full-year margin estimates have already been revised up by 50 basis points YTD. Margin sentiment and actual margins of companies referencing specific use cases of AI are significantly better than the index.
2) AI investment is coming out of cash flow. At the economy wide level, companies are not levering up for AI capex. As of 4Q25, the corporate financing gap, the difference between a sector’s retained profits (cash flow after dividends and excluding earnings retained overseas) and its capital expenditures, is negative (HERE). A negative financing gap indicates a financial surplus, meaning companies are generating more internal cash flow than they are spending on capital projects. The outlook for the AI investments, out of cash flows, has improved (see above).
Charts related to the comments above are below.
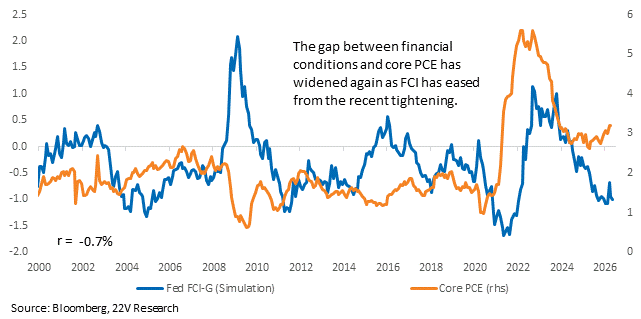
INFLATION DATA: The gap between core inflation and financial conditions is widening. There is a greater risk of a financial conditions tightener trade now. We would still be long the mega themes that are working, like the AI capex buildout, but hedge against a drawdown. The longer the SOH closure continues the greater the odds of a sharp tightening in FCI.
Wage growth is continuing to ease despite recent strong productivity, reinforcing the view that the current inflation overshoot does not originate in the labor market. According to the standard economic models, the current bout of high inflation is likely transitory. The Fed should be on hold and financial conditions remain around current levels if the current inflation overshoot is transitory.
MOMENTUM DRAWDOWNS: Momentum drawdowns tend to be rapid. We would hedge against a Momentum drawdown now given the SOH appears to remain closed and 10yr yield are moving higher globally.
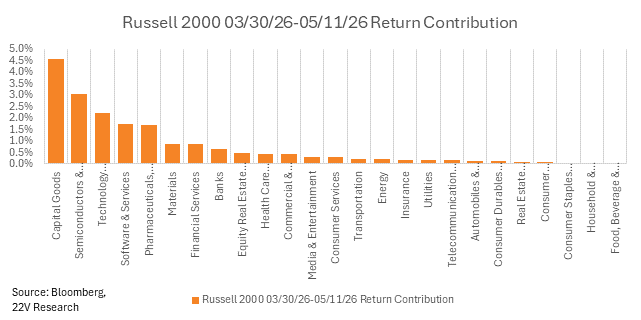
Small cap returns are dominated by the AI capex beneficiaries – Cap Goods, Semis, Tech Hardware – making small caps a good option to hedge against a Momentum drawdown.
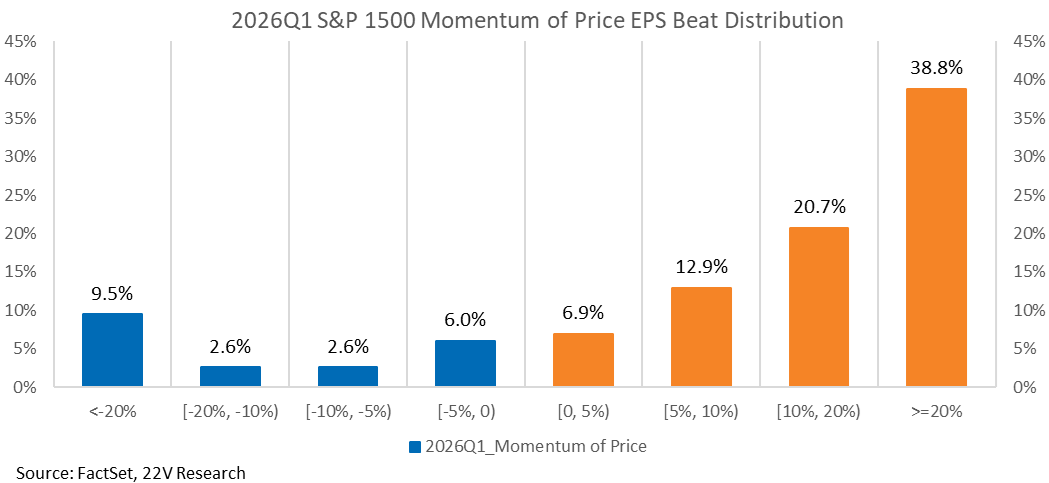
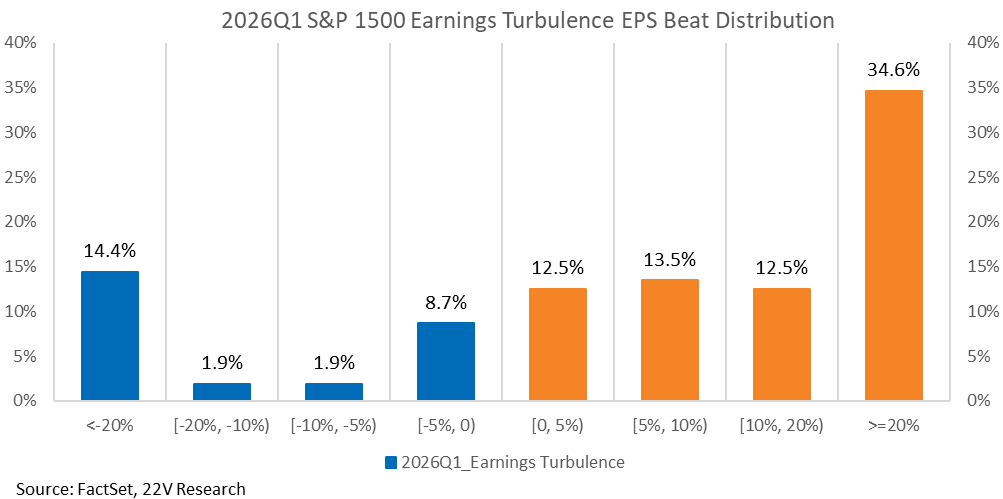
A plurality of Price Momentum AND high Earnings Turbulence names beat earnings by >=20%. The fundamentals support continued outperformance. The longer term base case is continued outperformance of AI buildout names and risk-on factors on the back of very strong earnings. SOH complicates things now.
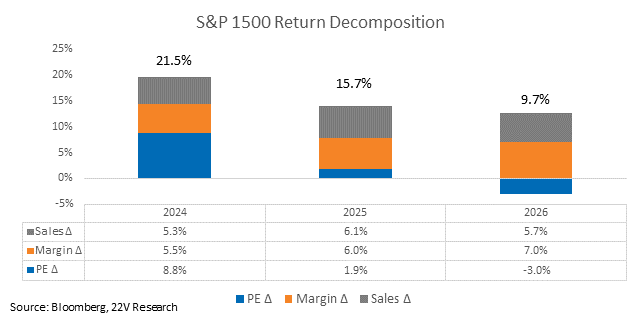
MARGINS: Most of the 12% YTD increase in Next Twelve Months (NTM) EPS estimates are attributed to margin growth rather than revenue. Full-year margin estimates have already been revised up by 50 basis points YTD.
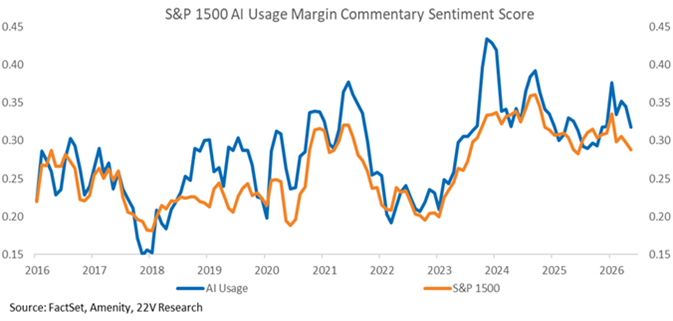
Margin sentiment and actual margins of companies referencing specific use cases of AI are significantly better than the index.
At the economy wide level, companies are not levering up to fund investments in AI capex. As of 4Q25, the corporate financing gap, which is the difference between a sector’s retained profits (cash flow after dividends and excluding earnings retained overseas) and its capital expenditures, is negative. Note the difference with 1999.
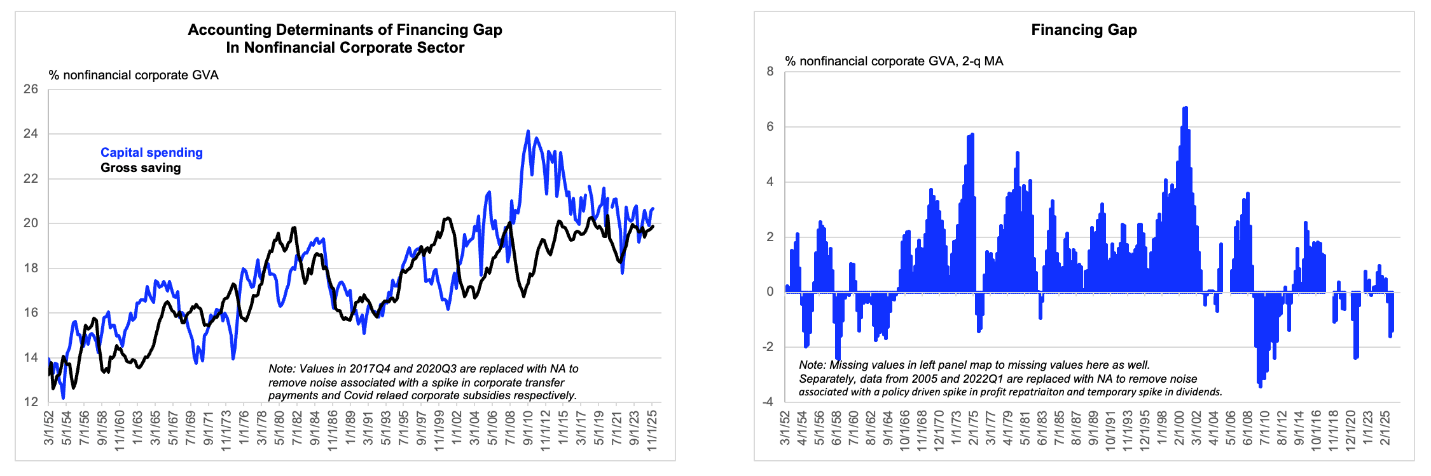
Source: Federal Reserve, FH calculations and data cleaning to make the underlying trends more obvious. Data are actual to 2025 Q4 and censored as indicated in the chart.
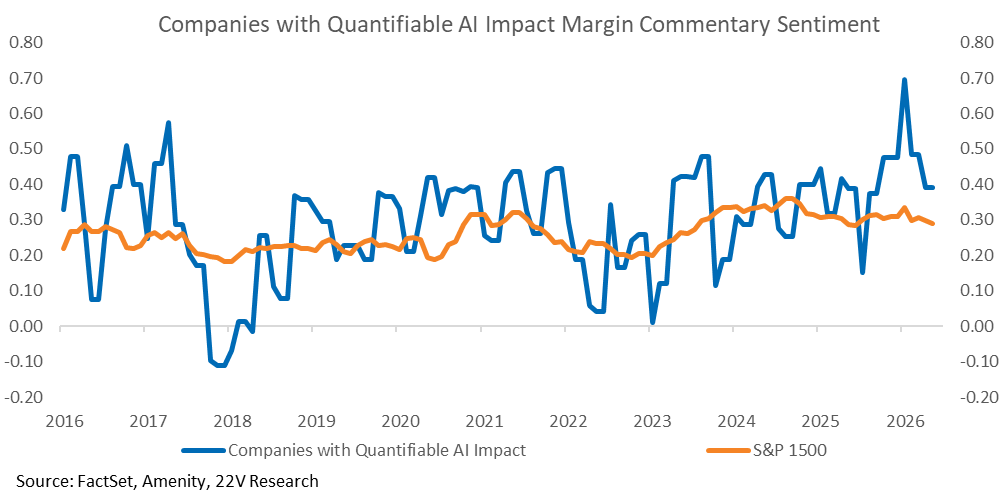
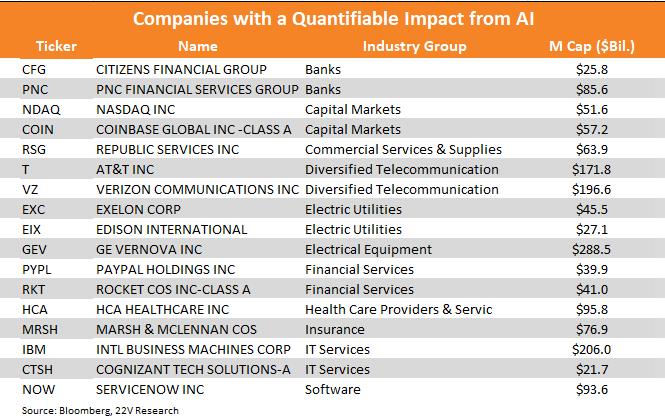
AI QUANTIFIERS: Companies who quantified the impact from their AI tools have much higher earnings sentiment than the rest of the index. They haven’t diverged from the index, for which sentiment is moving lower, but the spread is what is relevant here.
Companies that mentioned use cases of AI, but did not quantify the impact, also have higher margin sentiment than the index.
We use an LLM to filter earnings transcripts for comments detailing the numerical improvement in operations from AI. In aggregate, the early quantifiers have guided to 80bps of margin improvement, annually.
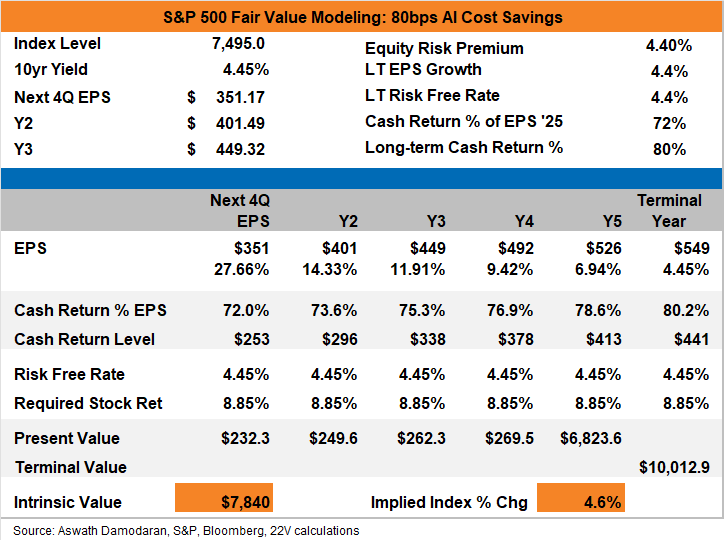
IF AI SAVES 80bps: There are two direct ways that cost savings increase fair value – a higher path of earnings and a higher long-term cash return ratio (long-term cash return is a function of ROE). Together, that’s worth +400 points (+5%). The equity risk premium would also move lower (fair value higher), an indirect result but one we have high conviction in. The equity risk premium is more difficult to model, so we provide a range of estimates; the magnitude of the impact would be another +~10% to as high as another +~50%. Full Report HERE.
10Y YIELD CORRELATIONS: The Mag 7 is outperforming, in aggregate, and may continue to even if yields increase and financial conditions tighten from here. Unlike small caps, risk-on factors, and other Cyclicals, the Mag 7 is less sensitive to 10yr yields.
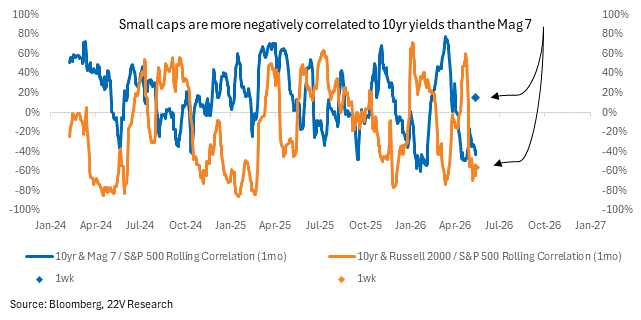
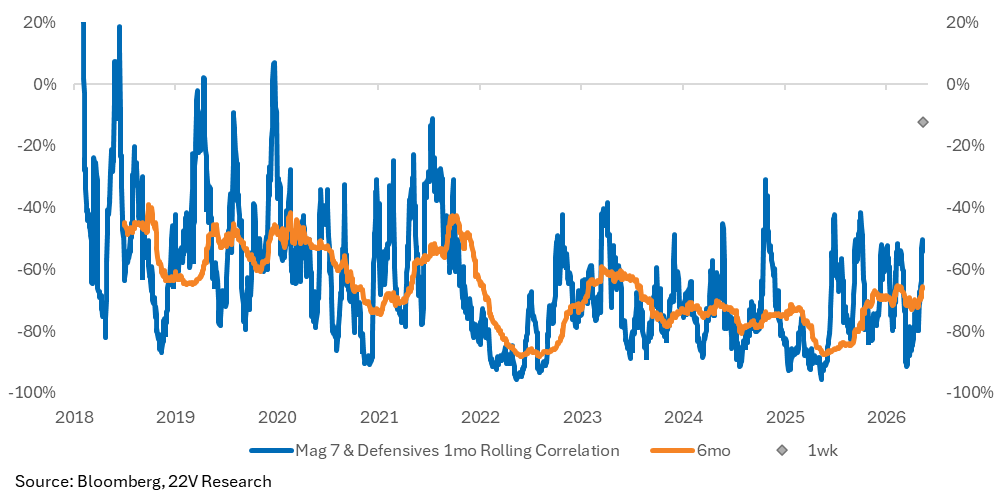
The spread in correlations has widened this week – more negative for risk-on and small caps, positive for the Mag 7. The Mag 7 correlation to Defensives is typically negative but also eased this week.
The only industry groups showing more positive sensitivity to the US 10yr than normal are Energy, Semis, Software, and Tech Hardware. Those groups also have low macro influence, so the direction of the 10yr is less relevant.