

Main point: It still seems too early to expect the AI story to deliver a negative shock to aggregate demand growth.
The question of whether the booming AI buildout will end up being profitable for the major players involved is beyond my paygrade. The range of opinion around whether it will even raise productivity growth is extremely wide, as you will have noticed. And I think this piece from The Yale Budget Lab makes an insightful point.
The only point I would venture here is that there is a scenario that may still be underappreciated. It is possible that the boom is a rational and defensive response to a technology innovation that threatens the market power of big incumbent tech. Specifically, this capex boom may be about trying to erect new moats to contain the decline of supernormal profits that would otherwise be triggered by a new technology admitting new entrants. In this scenario, you might short the stocks without shorting the capital spending boom itself. I mention this not to bearish the stocks, but just to point out that there is one more scenario where the boom persists longer than folks may imagine.
Returning to my own knitting, there are two senses in which the AI buildout might prove a threat to expansion. The first is that aggregate demand growth has been dangerously concentrated in capital spending related to AI. If this were the case, then a mere stabilization of capex in the AI space would reveal underlying weakness. However, it is easily shown that that is not the case.
The second way in which the AI boom might be destabilizing would involve the level of spending having already become excessive. In this case, an AI collapse might conceivably collapse an otherwise healthy set up for aggregate demand. In my view, this question has become tougher as the AI boom has persisted and as the flow of spending here has begun to look elevated by the standards of earlier booms. Still, for now, I remain inclined to take the over for a couple simple reasons I will review in the remainder of this note.
Wise or not, they plan to do more
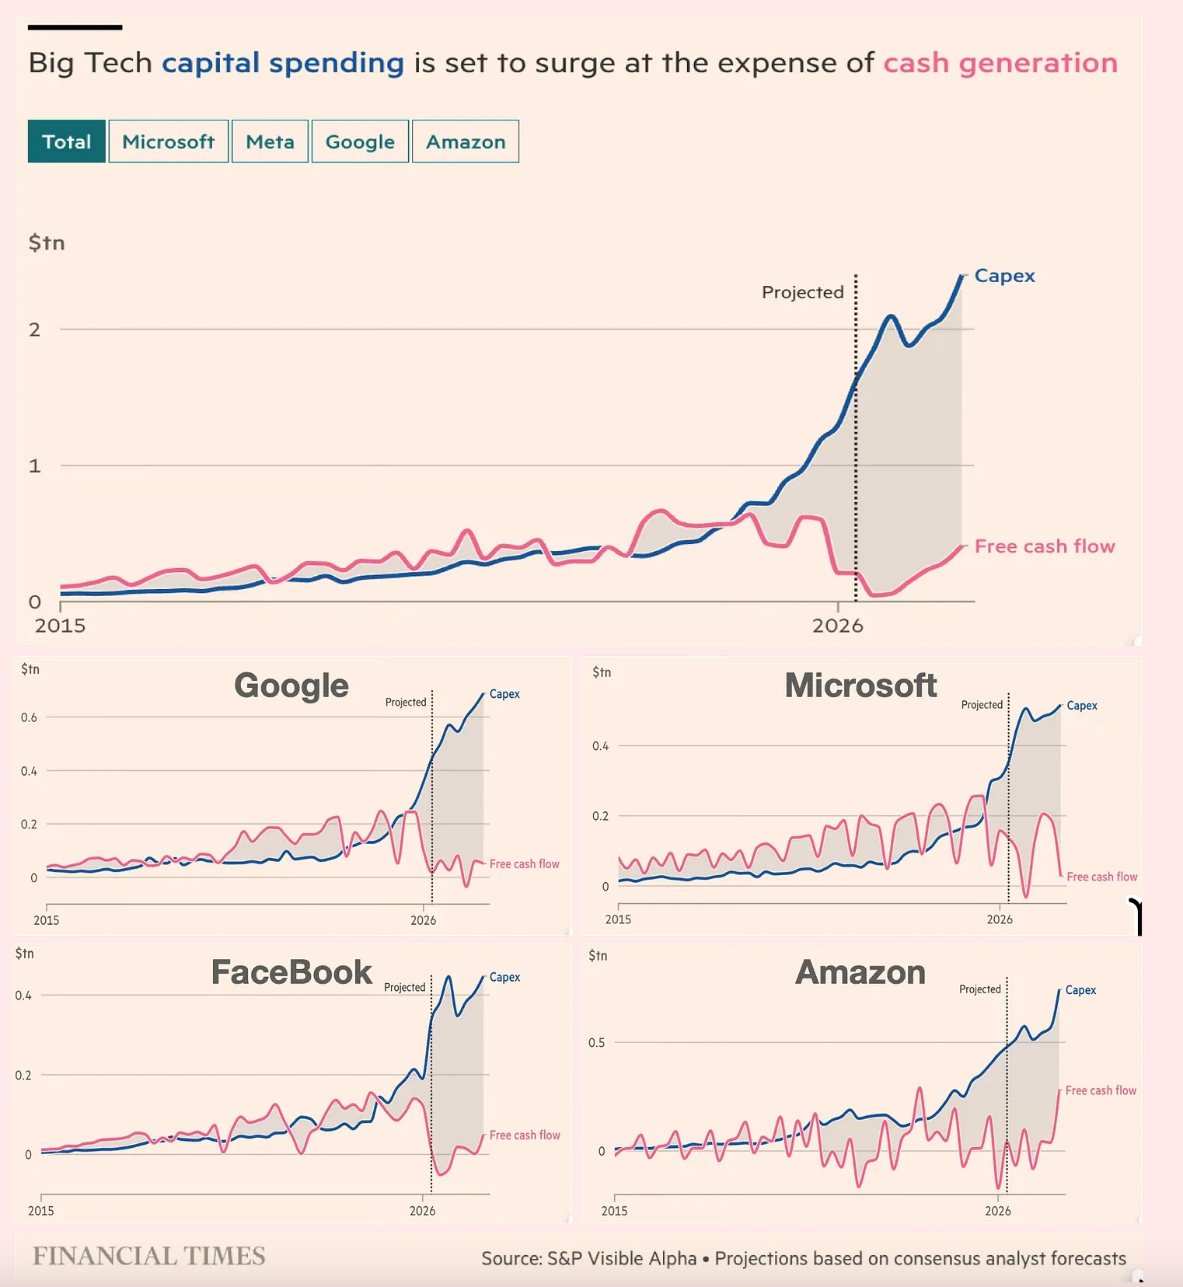
Let’s start with what is forthrightly a cheat on my behalf but in service of a point I think is relevant. It is a cheat because I am looking at the capital spending plans by the Big Four hyperscalers, as inferred from the consensus among analysts, rather than telling an economic story about what they can manage. The chart below was brought to my attention by another interesting blog post on this subject by Brad Delong, who wonders about how much cash these firms plan to “light on fire.” And it reminds me of a distinction that I think remains worth emphasizing. The capital spending plans are very aggressive and – if implemented – might well take spending in this space to an excessive level. But that is different from saying that capital spending in the space is already excessive. And separate from that, there is probably some information in the plans to increase spending. I think a reduction of capex would be more likely if, for example, they were not planning to raise it dramatically. That may sound sort of obvious, so maybe take this as a reminder rather than a unique insight.
Shifting now to the macro data, it is difficult to quantify how this spending boom compares with earlier General Purpose Technology (GPT) waves because the relevant capital spending items are not necessarily fully determined by the GPT with which they are associated. Nevertheless, I take a stab in the chart below at comparing the obvious suspects in this episode with the obvious suspected during the 90s boom, which was associated with the laser / integrated circuit GPT. This chart shows why it is a bit tougher now to dismiss the idea of an overshoot, at least on the basis of historical comparisons. Measured relative to GDP, the scale of the spending increase now compares closely with that achieved during the 1990s, and it has been much more compressed in time.
This capex cycle more broadly does not remotely compare with the 90s
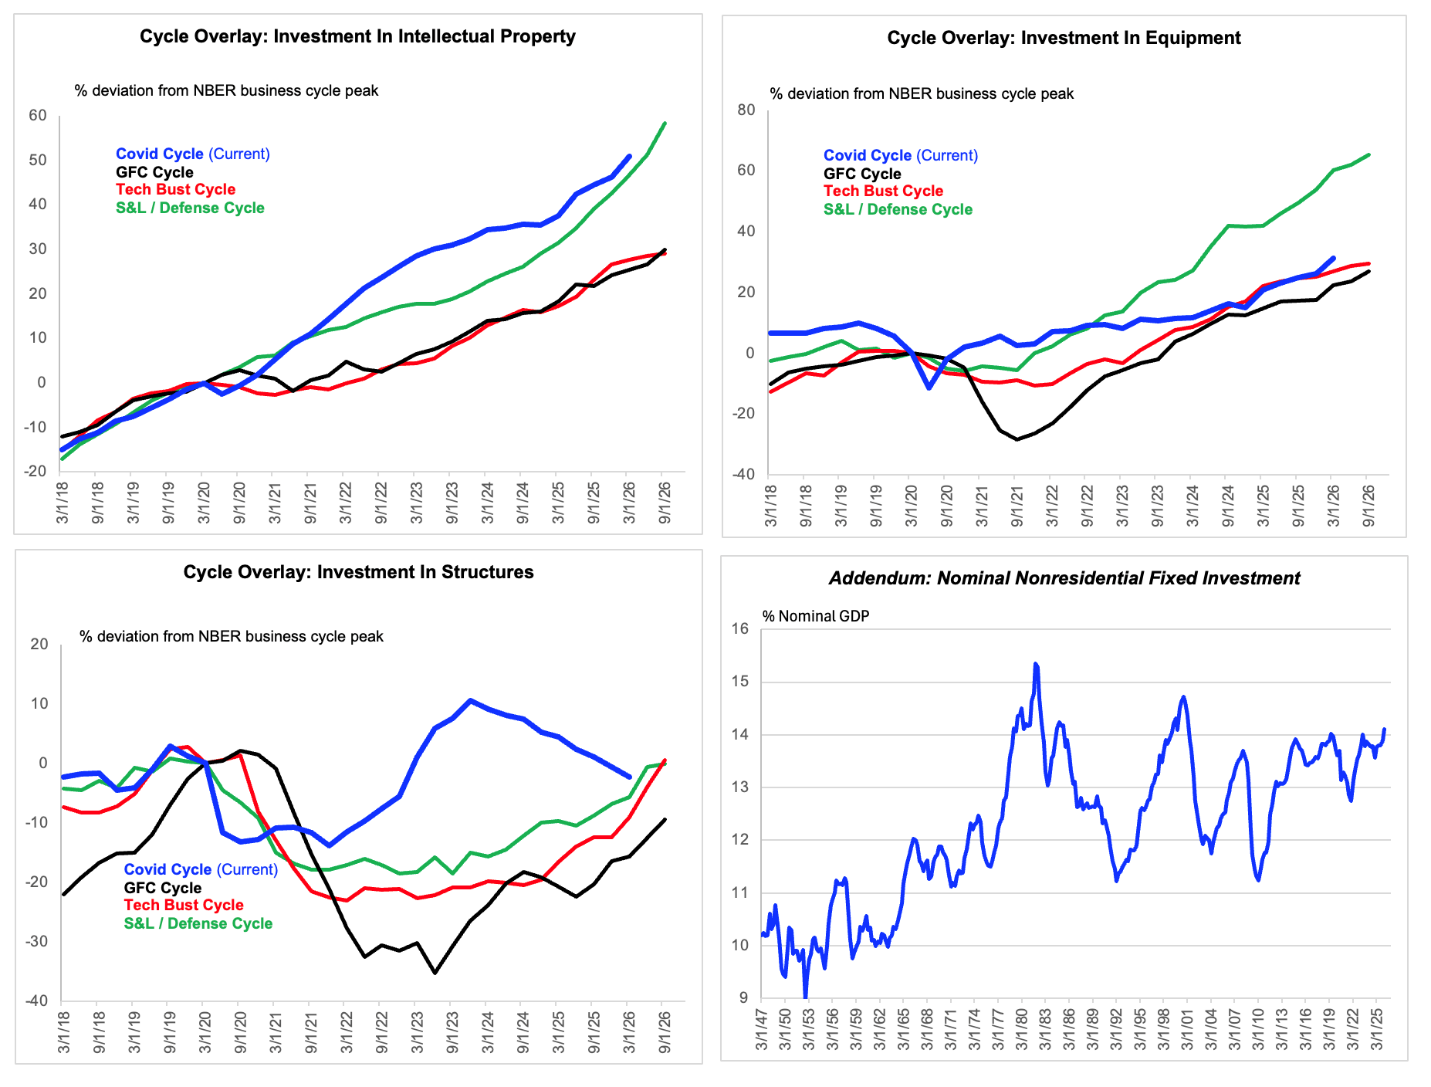
Data are actual to 2026 Q1
However, the scale of the spending in outright terms is lower. And what is true of components of capex that are most closely linked with AI is also true of capex generally. Real capex in intellectual property development, including software, has followed a path similar to that during the 1990s. But it is not obvious that this represents an excess, given the nature of the GPT. And perhaps more to the point, overall equipment spending, including in tech items, has not been particularly strong, and structures spending has been declining outright, despite the very minor lift from data center bricks and mortar. Note in the bottom right panel of the chart below that this cyclical upswing in the ratio of nominal capex to GDP looks tiny compared to that of the 1990s. The level is comparable, but that is probably not as relevant as the change, because of the confounding effects of rising deprecation rates.[1]
Meanwhile, there is no comparison between the aggregate financing needs of the US corporate sector in this episode and that of the 1990s. During the late 1990s, the nonfinancial corporate sector was running a massive and unprecedented financing gap. The data for the “current” period are a bit stale, because we are about two weeks out from a quarterly update of the US Financial Accounts. But as of the fourth quarter of last year, the financing gap was meaningfully negative. This fits roughly with a message from the first chart in this note, the one brought to my attention by Brad Delong. This boom is largely internally funded so far.
Again, no comparison
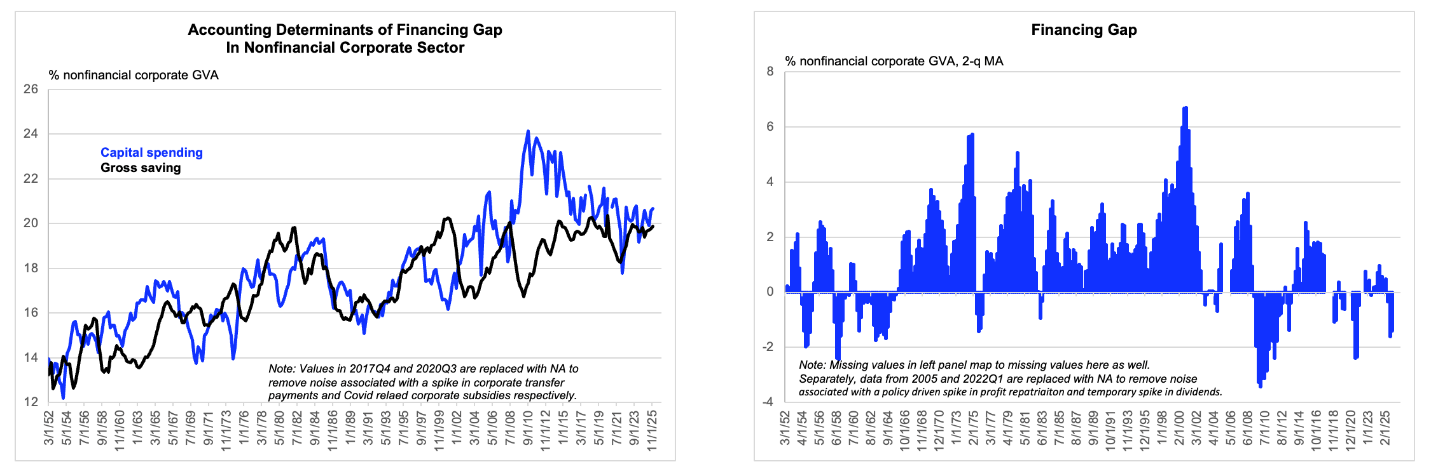
Data are actual to 2025 Q4 and censored as indicated in the chart.
[1] Another way to put this is that the rate of growth of the relevant real capital stocks does not currently seem excessive, especially in comparison with the 1990s.

