Summary: Two weeks ago, the narrative was of economic data being consistent with a positive economic GROWTH shock, but NOT necessarily an inflation shock. That is why Cyclicals continued to outperform Defensives. Given how strong economic growth appeared to be though, the risk that inflation remains too high for the Fed, leading to a sharp tightening of financial conditions, increased (from low levels) relative to before the FOMC. That is why market internals had been trading very similar to 3Q23 – Mega caps and Low Vol outperforming at the expense of everything else. As an example, GARP with Earning risk/high Vol exposure has done poorly until last week. GARP with Low Vol/High Quality has done VERY well. GARP provides alpha but can be overpowered by exposure to the wrong risk factors at the wrong time.
Investors have internalized the point above. Our Investor Survey (HERE) indicated small-caps are preferred in an “in-line” or trend economic growth backdrop (2-2.5%ish), and Value is expected to perform better. Mega caps, Large caps, and Growth are favored in the tails of too strong or too weak economic growth.
Marking to Market – The Tighter Financial Condition Tail Declined Some Last Week: Fed officials (Powell/Waller in particular) noted that CPI revisions, which were benign on Friday, were an important factor in gaining confidence that core inflation is falling. Last year, the three-month annualized change in core PCE for December 2022 increased to 3.6% from 2.9% after the CPI revisions. That was a shock, so it made sense Fed officials didn’t want to be surprised again. It would be weird to make a firm commitment to cut rates based on recent dovish inflation data only to have that data revised away. But the revisions were mild, so that tail risk is reduced some.
Does this mean a March cut? NO. But the benign CPI revisions combined with the headline decline in the Atlanta Fed wage tracker last week should significantly decrease the risk the Fed needs to tighten financial conditions again. That is something many investors have been worried about. 6+ cuts is not coming back either (growth is still too strong for that). That is why UST yields and the USD did not move much lower on the CPI revisions.
Bottom Line: Investors should expect much higher confidence in 3-4 cuts. In a 2-2.5% real GDP growth backdrop (our call is 3-4 cuts and 2-2.5% GDP. GDP risk remains to the upside), that is a positive for risk assets. SMID, Value, and Earnings Risk factors posted stronger relative performance last week and that should continue. Yields and the USD should remain range bound unless CPI readings are an outlier.
Risk: The risk of 2 cuts or less would remain high if activity data doesn’t slow. That is why we are keeping an eye on the Atlanta Fed GDPNow cast. The 1Q24 Nowcast declined from 4.2% on Payroll Friday to 3.4% last week. That is still high in level terms, but directionally dovish. Combined with the benign CPI revisions, they decrease the risk of tighter FCI. Actual CPI is on Tuesday.
Post Fed Meeting Reaction Function Going According to Script Again: When we quantitatively (HERE) looked at the reaction in risk assets when the Fed surprises markets, which we define as meetings where financial conditions shift relative to their pre-meeting trends, risk-off factors tend to lead. Specifically, Low Vol tends to be the best performing factor, which is exactly what we saw after the FOMC meeting. During this rate hiking cycle though, in the month AFTER the FOMC surprise, risk-on factors tend to rebound. Returns and sensitivity to Low Vol are negative following surprises. What that means for February is Low Vol is likely to struggle, while Price Reversal, risk-on, and Growth are likely to lead. This is already happening. A special thanks to much more significant disinflationary trends in goods and services and firmer than expected EPS trends should be mentioned here!
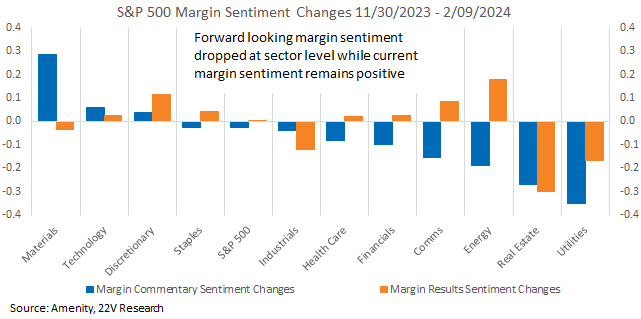
Earnings/Margin Support: 79% of reporters have posted better than forecast EPS this earnings season. Our internal (company) and external (macro) management sentiment readings have rebounded in 4Q after a mixed start. Better macro trends are creeping into investor sentiment as well (HERE). The bottom line is ongoing and significant upside surprise to S&P earnings. Margins within Tech remain the highest of all sectors, and profitability has been slipping some across most other sectors. The outlook for margins remains solid, though. Pricing power and price sentiment both climbed during 4Q reporting, and overall margin sentiment remains high (HERE). For now, both earnings and margin readings for Early Cyclical sectors are most positive.
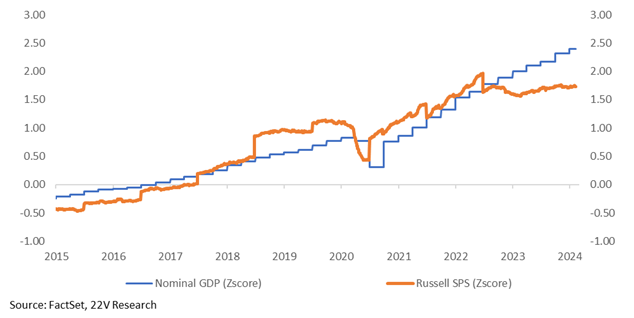
Something To Monitor in the Small Cap Debate: There is a gap between nominal GDP and Russell sales expectations that is a very odd relative to history. If GDP growth continues around its current pace, a meaningful catch up in Russell sales should be expected. Some investors believe a more permanent shift to services vs goods is the driver of this divergence. We disagree, but monitoring Russell sales expectations vs Nominal GDP will be a way to track that thesis.
Charts and commentary below…
Indicators – At the Margin Dovish Data Last Week: The Atlanta Fed wage tracker reinforced that the wage growth uptick in the payroll report was related to the sharp decline in hours worked. That is why the labor income proxy was benign. A benign labor income proxy would indicate companies are not pressured to pass on higher wage costs. The decline in the Atlanta Fed wage tracker also suggests easing services inflation. That’s important now because deflation won’t continue for the full year (see Peter’s goods economy deep dive HERE).
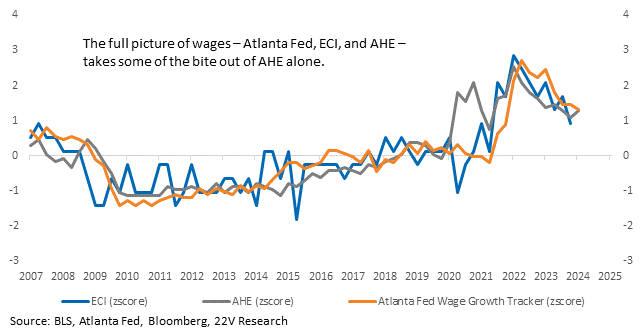
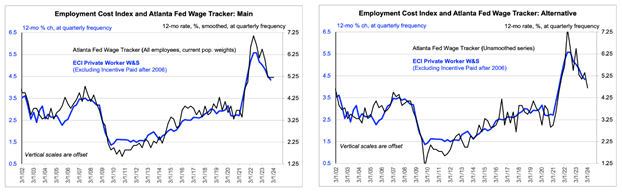
As Gerard noted in a report (HERE), the decline in the Atlanta Fed Wage Tracker “is fully consistent with the Fed claim that the trend and outlook for wage growth is moderating”. Gerard goes on to make the point that the way he looks at the data is not necessarily dovish, but that is a long-term theme. Benign CPI revisions and the headline decline in the Atlanta Fed wage tracker does increase the odds of a broadening out of winners. SMID cap names, ex financials, have had a strong 4 days as 10yr yields have stabilized.
Source: BLS, 22V Research
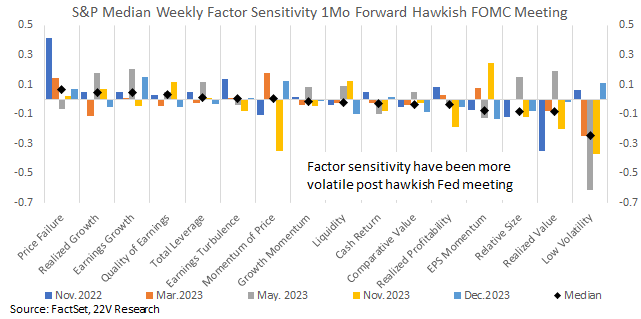
Post Fed Meeting Reaction Function Going According to Script Again: Internals following FOMC surprises have been mixed this cycle but tilt toward risk-on leadership. Filtering FOMC days for periods where financial conditions trends have reversed shows Liquidity and Earnings Turbulence have the best returns over the subsequent month. Low Volatility has been the worst performing factor. One likely reason for this trend is that macro and earnings data have consistently surprised to the upside. So, disappointing FOMC days led to an initial risk-off move that is reversed over the next month as data continues to confirm that the economy and markets are growing despite high short rates.
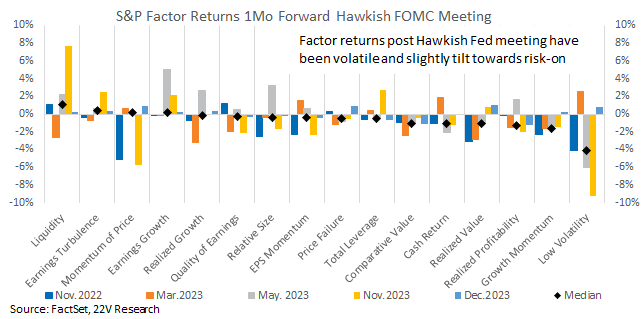
S&P factor sensitivity 1 month after FOMC surprises suggests a similar trend as historical returns. Specifically, Low Volatility tends to be a poor performer after those surprises. Price Failure and Growth factors have the highest sensitivities. In other words, stock prices were more likely to reverse after FOMC surprises and S&P names with strong Growth characteristics are more likely to be favored.
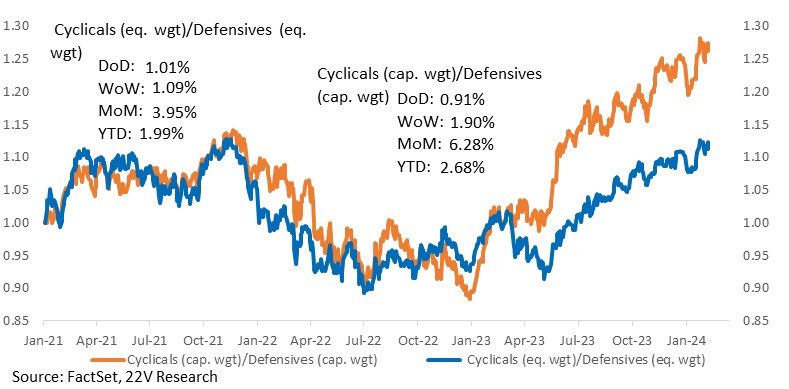
Cyclicals are still outperforming Defensives, a trend we expect to continue.
Our favorite fundamental factor is GARP (see the 2024 Outlook for more details). During 3Q23, our SMID cap GARP portfolio was dragged lower by size and risk positioning. The GARP contribution was positive, but exposure to those risk factors hurt. If the market continues to trade like 3Q23, fundamentals will still deliver alpha, but risk exposures will need to be neutralized.
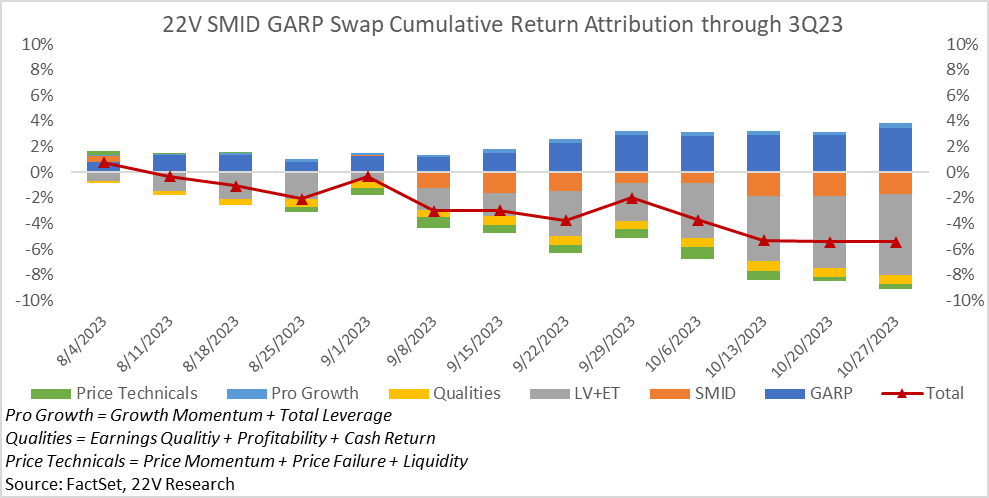
The factor allocation that would’ve generated the best return during 3Q23 was GARP + Low Vol. However, that would’ve required timing the runup in yields. Right now, similarly, Low Vol positioning would require confidence in the path of economic data. If you are confident that economic growth will cool, without a significant tightening in financial conditions, GARP exposure with small size and Earning Risk exposure will benefit. I.e., the pain has already been felt. If you are unsure how the economy will play out or think financial conditions have material risk to tighten more, GARP + Quality exposure would be best. FYI: GARP + Quality had the best risk-adjusted return during 3Q. We are happy to send this list of stocks along.
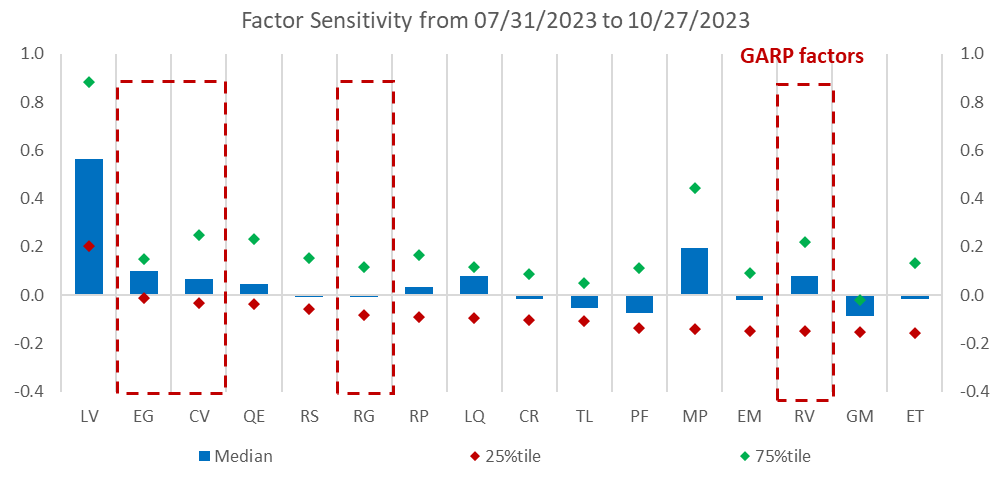
Source: FactSet, 22V Research
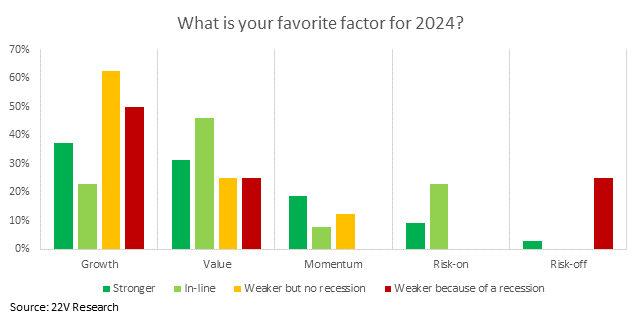
Investor Positioning FROM HERE: According to our survey of investors (HERE), the Growth factor is the favorite factor to own in a stronger or weaker growth backdrop. Value in an in-line backdrop. Megas/large caps best in a stronger or weaker growth backdrop. Small caps in an in-line backdrop. That makes sense, if economic growth is significantly above or below 2%, owning Mega caps/growth assets makes sense as longer term recession risk increases. More Cyclical assets, like Small caps and Value underperform as investors have difficultly pricing in a longer economic Cycle.
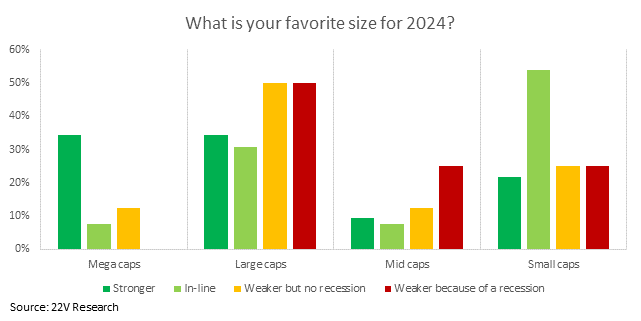
Value is favored in a backdrop of trend economic growth.
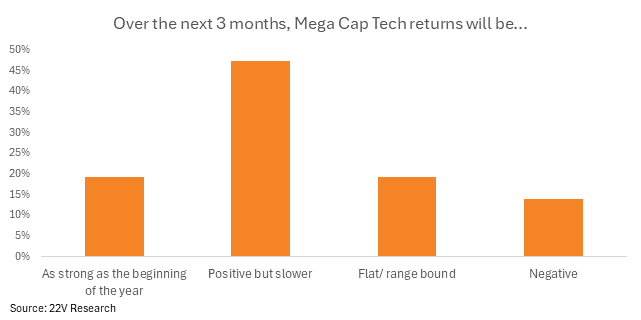
FYI: Broadly speaking, investors think mega cap tech returns will be positive but slower over the next 3 months.
Small Cap Debate Monitor: There is a very odd gap between nominal GDP and Russell sales expectations. If GDP growth continues around its current pace, a meaningful catch up in Rusell sales expectations should be expected. Some investors believe a more permanent shift to services vs goods is the driver of the divergence. We disagree, but monitoring Russell sales expectations vs Nominal GDP will be a way to track the validity of that thesis.
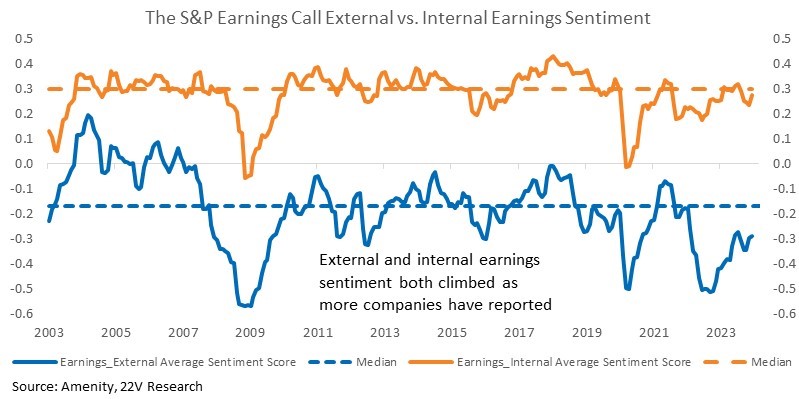
Earnings/Margins Improve: With nearly 70% of S&P companies reported, 4Q earnings are handily beating estimates. 79% of reporters have posted better than forecast EPS. Economic growth expectations have been revised higher as well, and inflation has remained stable. Our internal (company) and external (macro) management sentiment readings have rebounded in 4Q after a mixed start. Better macro trends are creeping into investors sentiment as well (HERE).
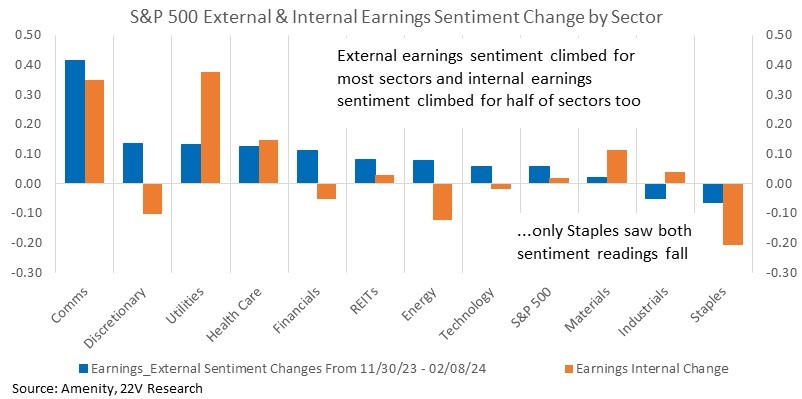
At the sector level, external sentiment changes over the past quarter have almost all been positive. The only decliners are Industrials and Staples. Early Cyclicals, which are more sensitive to the economic cycle, have seen the greatest increase led by Comms and Discretionary. Internal earnings sentiment changes, which are more tied to industry and company cycles, have been more mixed between Cyclical and Defensives. Staples is the only sector where both internal and external sentiment has deteriorated. That seems to confirm the view captured in our survey where Staples was the least favored by investors in all backdrop (survey result HERE).
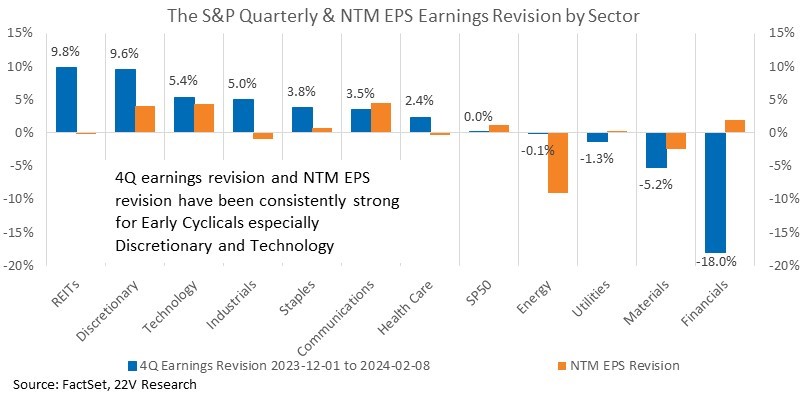
S&P NTM EPS estimates continued to climb during 4Q reporting season as well. Again, Cyclicals, particularly Early Cyclicals have led NTM EPS growth revisions. New York Community Bancorp’s dismal earnings weighed on the overall sector and has led to Financials 4Q earnings revision dropping -18%.
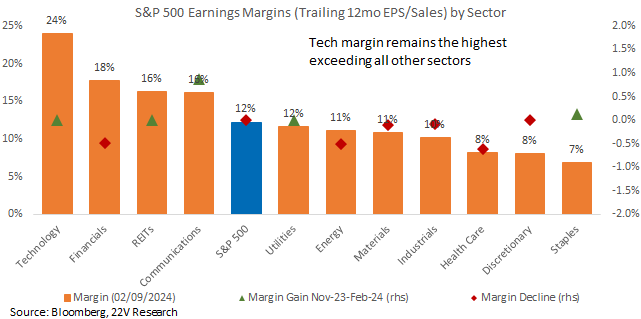
Margins within Tech remain the highest of all sectors, and profitability has been slipping some across most other sectors. Tech margins are one of the reasons it remains a favorite sector among investors. Staples margins are the lowest among all S&P sectors but did increase a touch during reporting.
The outlook for margins remain solid though. Pricing power and price sentiment both climbed during 4Q reporting and overall margin sentiment remains at higher level (HERE). The latest pricing sentiment readings increase concerns about forward earnings especially for Defensives including Utilities and REITs. Materials, Technology and Discretionary margin sentiment continues to be strong, even as the broad index signaled some weakness. For now, both earnings and margin readings for Early Cyclical sectors are mostly positive.