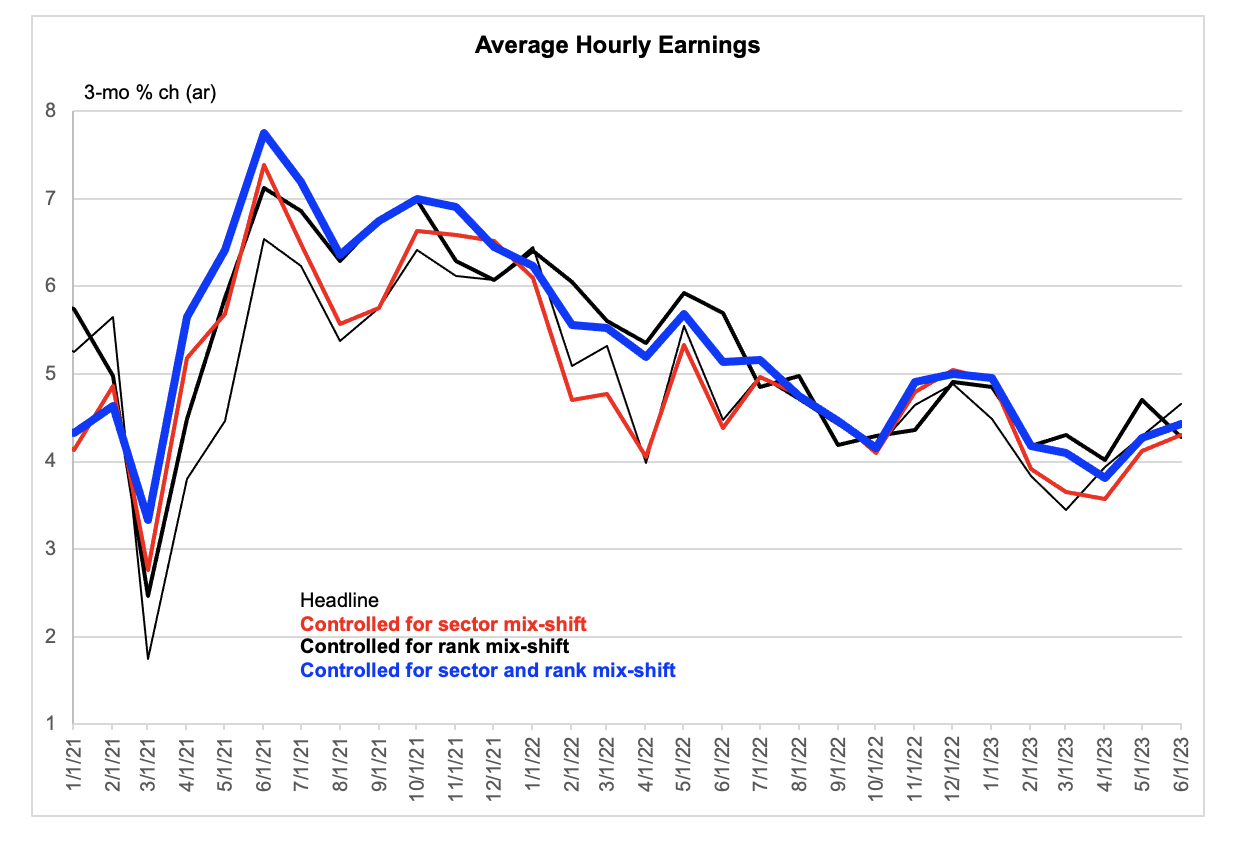
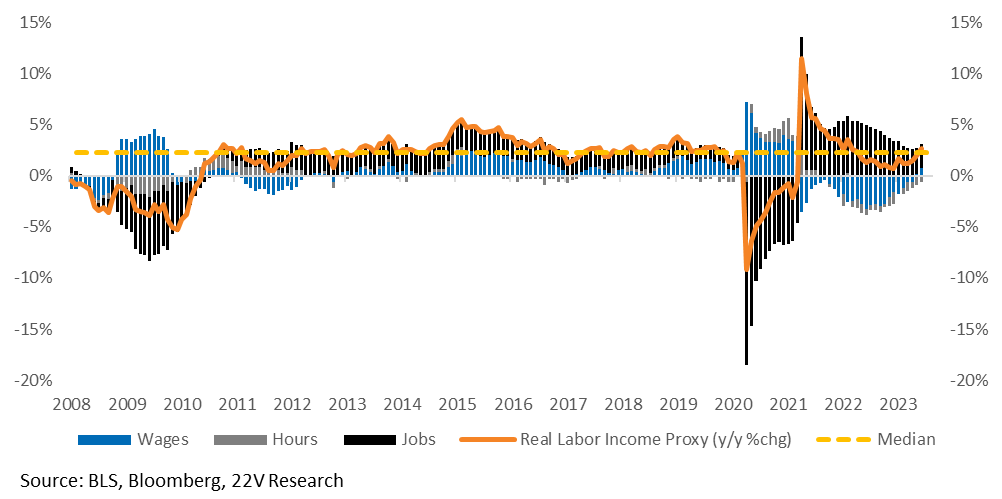
Weekly: As we have frequently noted over the past 6 months of Weekly reports, the data last week confirmed that 1) a recession is not near, and 2) the low risk the economy will slip into recession in the next three months declined further. Some have suggested that the payroll report was weak, with negative revisions to private employment being cited, but that being a problem is a MAJOR stretch. Nominal wage growth may be bottoming at a very strong +4% level, and as Gerard noted (HERE) the labor income proxy (employment * average workweek * times wages) beat by 32 bps in level terms.
According to Gerard, the labor income proxy “looks strong enough to sustain trend or above trend real personal consumption expenditure (PCE) growth of about 2.5%, which happens to be the six-month growth rate there.” PCE growth is down from last year’s 5/6% boom levels but is still stronger than the post-GFC period. For now, most of PCE is still concentrated in the service sector. That means investors need to be careful extrapolating to the overall economy any negative spending comments from goods producers this earnings season. That trap caught many investors last earnings season.
Quantitively, the 22V Macro Regime model (HERE) suggests the US economy remains in “Transition” (data is not giving a clear recession or normal economic signal), but the probability of moving into a “Normal” regime increased in June. That is consistent with other macro growth indicators such as the NY Fed Weekly Economic Index, PMI readings, and still strong labor market data. Moving toward a more “normal” backdrop is generally negative for Low Volatility names.
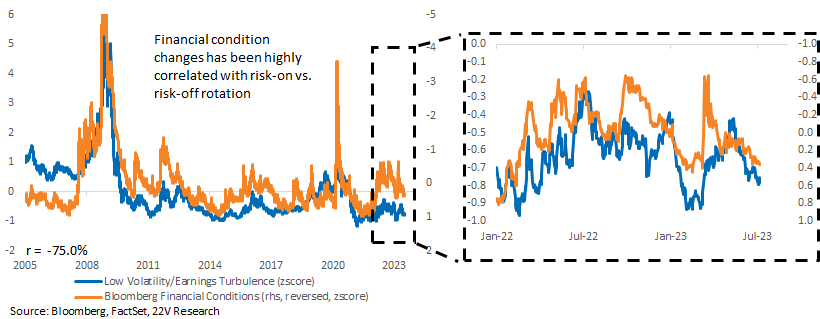
Overall, the macro backdrop suggests financial conditions will remain stable to easier unless CPI is much stronger than expected. Stable to easier financial conditions would be an ongoing support for risk-on factors in 2H. The bottom line is, the current risk-on, Cyclical leadership with a Deep Cyclical rebound should continue in 2H. We still favor “destocking losers’ and higher-quality, Earnings Turbulence names over Low Volatility.
An important reminder, and we detailed last week (HERE). Relative to the broader equity market, the S&P is more risk-off and less risk-on exposed, under a continued risk-on rotation, market returns should be limited.
Two Important Caveats: It is important to acknowledge that macro influence and volatility remain high, and the economy is still in “Transition” (more HERE). That is a risk to our risk-on call this month. Also, the still elevated medium-term recession risk is not really about the economic momentum. Gerard points out that the Fed needs to keep the growth below trend to achieve the desired disinflation. “That has little to do with contemporaneous strength or weakness in the activity indicators.” If CPI surprises to the upside and wage growth threatens to reaccelerate, the Fed could tighten financial conditions more, which would be a significant risk to our risk-on call.
FYI – the VIX is Low, But Macro Still Matters: There has been a divergence between macro influence on the S&P and the VIX and it has reached extreme levels. This can be seen by looking at the divergence between how much the S&P is driven by “macro” (as seen in the first principal component) and the low level of the VIX. When macro influence is very high, typically the VIX would be higher. And vice versa. Our read of this divergence is as follows. The stability of macro forces over the past few months has allowed equity vol to decline, but market trends remain tied to those macro forces. Market vol (and internals) will remain tied to unpredictable shifts in macro data that are common during transitions. So, it remains dangerous to extrapolate current trends.
Charts & Commentary below, that back up the comments made above…
Wages & Payroll: As we have noted frequency in the past 6 months of Weekly reports, data last week confirmed that 1) the economy is not in a recession, and 2) the already low risk that the economy will slip into recession within the next three months moved even lower following the firm payroll data. Wages appear to be bottoming, which is inconsistent with a labor market that is weakening meaningfully.
Source: BLS Bloomberg, 22V Research
The labor income proxy (employment * average workweek * times wages) beat by 32 bps in level terms and looks strong enough to sustain trend or above trend real personal consumption expenditure (PCE) growth for now of ~2.5%.
Quantitively (HERE), the 22V Macro Regime model suggests the US economy is still in “Transition” (data is not giving a clear recession or normal economic signal), but the probability of being in a “Normal” backdrop increased in Juned. That is in line with other macro growth indicators such as the NY Fed Weekly Economic Index and the stabilization of PMI readings.
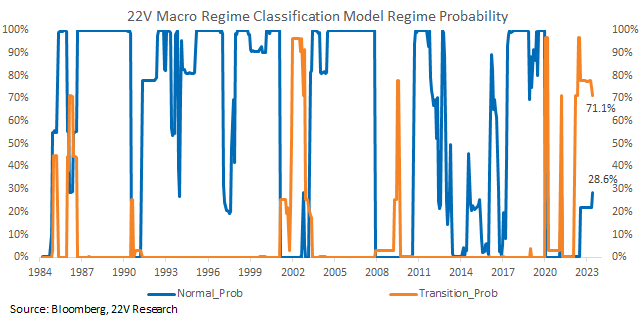
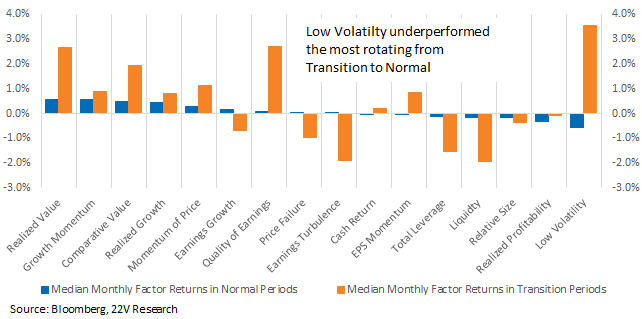
Value and Momentum factors have outperformed during Normal periods historically, while performance of Low Volatility diverged the most between Transition and Normal (gaining in Transitions and falling in Normal periods). That makes sense as uncertainty tied to “Transitions” should favor risk-off characteristics like Low Volatility. Since mid-May, risk-on factors have outperformed, and Low Vol has been one of the worst factors. Those trends are consistent with the modest improvement in broad economic data.
The current macro backdrop suggests financial conditions will remain stable to easier UNLESS CPI comes in much higher than expected. Stable to easier FC would be an ongoing support for risk-on factors in 2H.
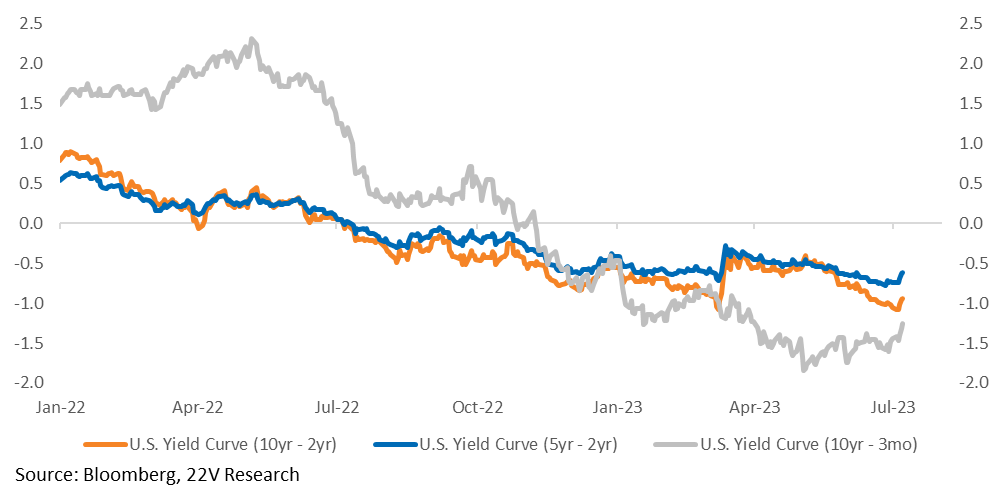
Yield Curve Thoughts: Yield curves have been steepening, across durations, and increased last week. It was a “bear steepening” with short rates moving higher more slowly than yields. Curves are still deeply inverted though because longer-term (8-12mo) recession risk is unusually high. The Fed needs economic growth to remain below trend to slow inflation, which is why recession risk is high, and that will keep curves inverted. If stronger than expected labor market indicators were a clear risk to the economy and suggested the Fed needs to raise rates more, yield curves would not have bear steepened. That could change if CPI data comes in too hot, yield curves would presumably invert more if inflation is too strong and force the Fed to signal more aggressive policy and an incremental increase in their recession tolerance.
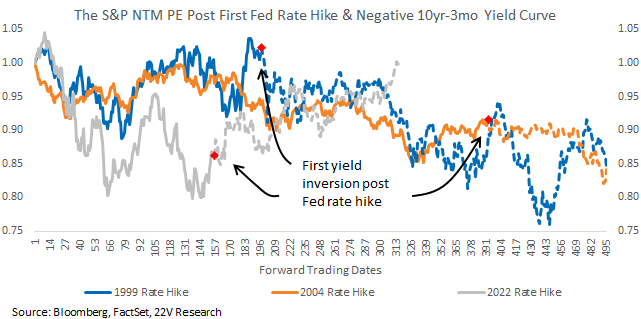
Yield curve signals are not perfect, and the timing of recessions following inversions can vary significantly. As we have pointed out before (HERE), the current curve inversion period has been weird relative to history. S&P multiples usually decline following the first yield curve inversion, but they have increased during this period. Recession probability is higher than normal, but the unusual increase in S&P multiples suggests some divergence relative to other periods. The post-COVID period may be so odd relative to history that rules of thumb are LESS useful. We didn’t say they were not useful, just less so.
Caveats: There has been a divergence between macro influence and market vol that has reached extreme levels. This can be seen by looking at the divergence between how much the S&P is driven by “macro” (as seen in the first PC) and the low level of the VIX. When macro influence is very high, typically the VIX is too. Our read of this divergence is as follows. The stability of macro forces over the past few months has allowed equity vol to decline, but market trends remain tied to those macro forces. Market vol (and internals) will remain tied to unpredictable shifts in macro data and transition periods tend to have unpredictable shifts in the data. Hence, we need to be careful with extrapolation of current trends.
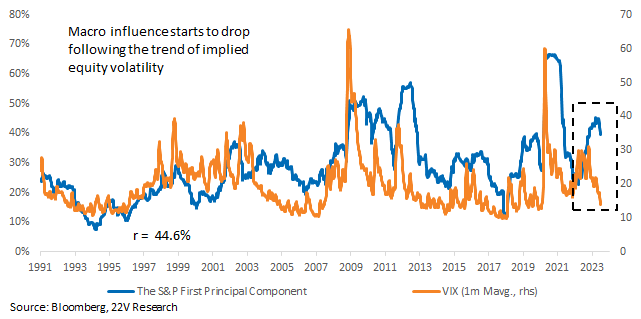
Since we are still technically in a “transition” phase with high macro influence over the S&P, we don’t want to get too carried away in pricing in a normal economic backdrop. Our Tactical call remains to be long destocking losers, Earning Turbulence relative to Low Volatility, and Deep Cyclicals. But we are conscious of how fast the economic ground can shift. Stocks that benefit from lower correlations have had a great run recently, and we would expect that to continue in 2H23. Unless the economic backdrop deteriorates much quicker than we are expecting.
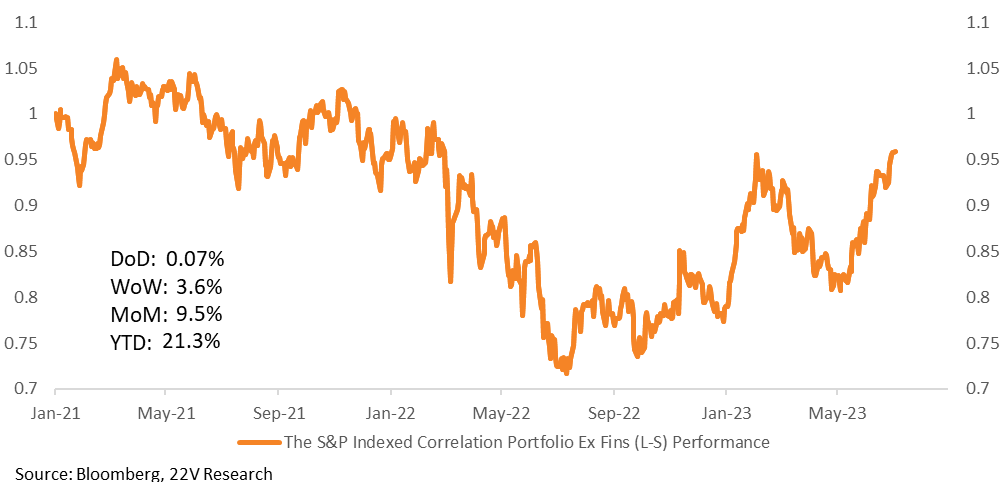
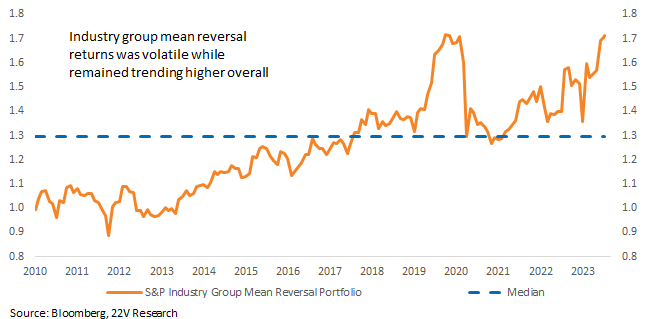
Economic Transitions are prone to mean reversion. Consistent with that, a dummy portfolio that goes long the prior month’s worst performing industry groups and short the best has outperformed for two years, illustrating the danger in extrapolating economic narratives that drive market internals from month to month.