Today we look at the market and fundamental patterns around yield curve inversions, rate hikes cycles, and recessions, comparing them to current trends. Recessions are relatively rare and poorly defined, so this isn’t a statistical exercise, just a series of observations. One important one is that investors are willing to price a soft landing (mild/no recession) when data points in that direction.
Despite rapid rate hikes and the deep yield curve inversion NTM S&P PEs bottomed in late-3Q last year. Since the first full week of January, the S&P has been above the psychological -20% drawdown level associated with bear markets. Indexed price returns are moving away from historical recessions patterns (’81-‘82, Dotcom Bubble and GFC). NTM Earnings expectations have firmed, but the large rebound in price from the October low means multiple expansion is responsible for ALL of the S&P’s gains. More recently, from SVB’s failure to now, the market is up ~11% (ln) and fundamentals account for about a third of that return.

The 2022-’23 bear market was longer than normal, and may not be over, given the heightened level of macro uncertainty. The point is that the broad market trend suggests investors are not discounting markets the same way they have during previous recessions. On its own, that is not important, but it is more interesting given the bottoming of growth, firming of earnings, etc.,
Macro readings are still very unusually distributed. Unemployment is lower and inflation higher than in recessions, but PMIs are much lower than is typical in a normal backdrop. If a soft landing is the end point of this slowdown, the Urate and inflation need to gradually normalize, which suggests more months of macro uncertainty. The fastest path to a clearer macro backdrop is the Urate and inflation normalizing quickly, which would be consistent with a recession. Uncertainty is probably the best option for risk assets given the current backdrop.
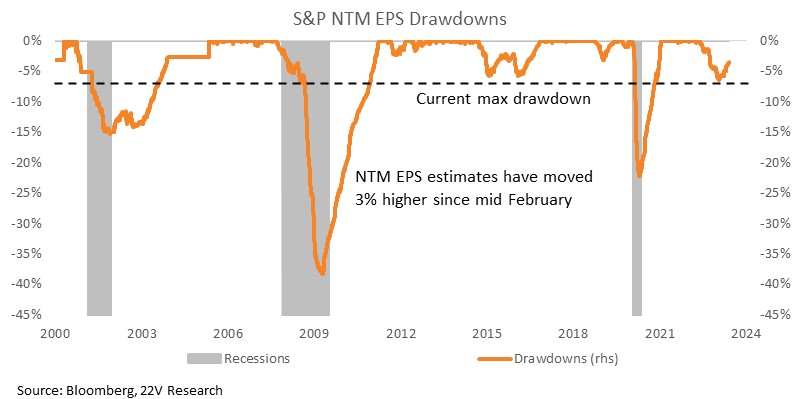
Market Trends Diverging from Historical Yield Curve Inversions: High frequency macro suggest U.S. growth is stable at a low (below trend) level. The absence o a collapse in growth has been enough to support a rebound in earnings sentiment, guidance, and sell-side estimates. NTM earnings expectation have improved even since the Fed delivered its “hawkish pause”, signaling potential for two more rate hikes this year. Since their relative low in February, the S&P NTM EPS estimates are up 3%, a trend we expected to continue near term. The -6.4% NTM EPS drawdown has been much milder than what was seen during recently recessions. The current path is more like the 2015 slowdown. The history of NTM estimates is limited and recessions are relatively rare and poorly defined, so this isn’t a statistic, just an observation.
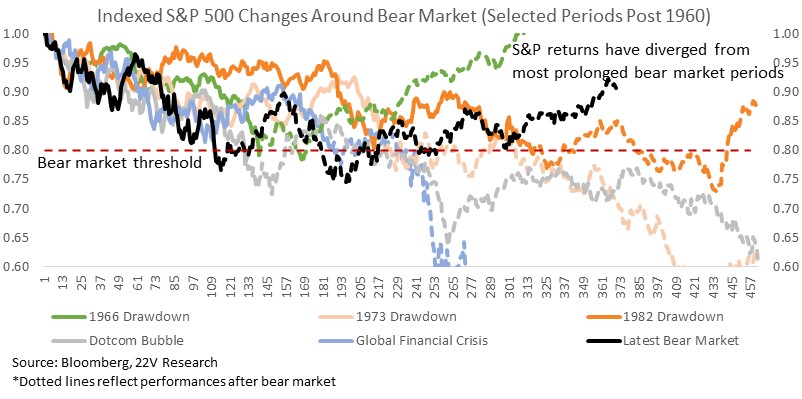
S&P returns have rebounded as fundamental data has firmed and macro data have stabilized, at a low level, despite rapid rate hikes and the deep yield curve inversion. Since the first full week of January the S&P has been above the psychological -20% drawdown level associated with bear markets. Indexed price returns are moving away from historical recessions patterns (’81-‘82, Dotcom Bubble and GFC). The 2022-’23 bear market was longer than normal, and may not be over, given the heightened level of macro uncertainty. The point of the below chart is that the broad market trend suggests investors are not discounting markets the same way they have during previous recessions. On its own that is not important, but it is more interesting given the bottoming of growth, firming of earnings, etc.,
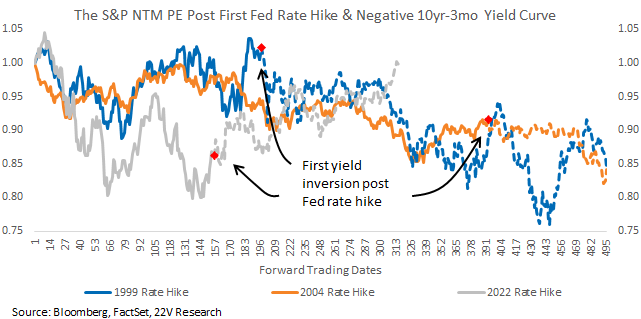
Earnings expectations have firmed, but the large rebound in price from the October low means multiple expansion is responsible for ALL of the S&P’s gains. More recently, from SVB’s failure to now, the market is up ~11% (ln) and fundamentals account for about a third of that return. The S&P multiple bottomed in September of last year (chart HERE), a few weeks ahead of the first 10yr–3mo yield curve inversion of this cycle. Historically, S&P multiples have fallen further after yield curve inversions. In absolute terms, recession multiples tend to bottom around 14.5-15x.
Historical recessions have all followed a yield curve inversion, given enough time. As long as there are yield curve inversions and recession, that will necessarily be true. But, not all recessions have started NEAR an inversion. Historically, 46% of recessions did not start within 1 year of a yield curve inversion, and 27% of recessions did not start within 2 years of a yield curve inversion. Nearishby recession risk is elevated while the yield curve remains inverted, which is consistent with 81% of investors we surveyed expecting a recession this or next year (survey HERE). At the same time, S&P multiple expansion suggests those same investors are willing to price a soft landing (mild/no recession) when data points in that direction. Investors accept that a nearby recession is not a forgone conclusion.
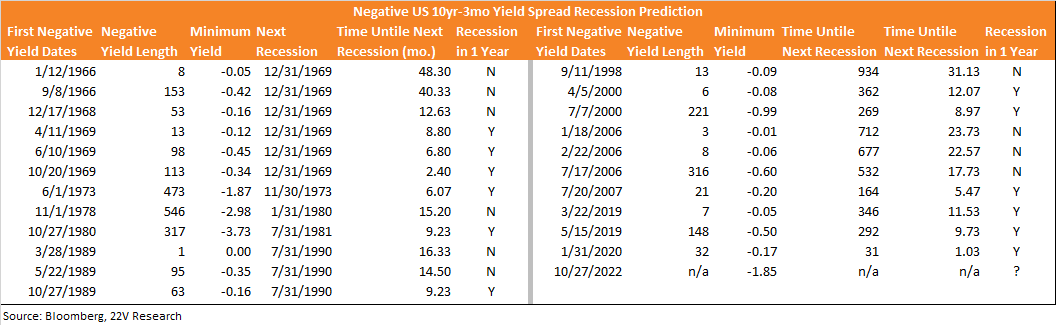
Uncertainty the Best Probable Path for Risk: Today there are good reasons to be uncertain about the path of growth. Macro readings are still very unusually distributed. Credit spreads and Consumer Confidence remain in their normal ranges, and their latest readings are higher than average. Unemployment is lower and inflation higher than in recessions, but PMIs are much lower than is typical in a normal backdrop. If a soft landing is the end point of this slowdown, the Urate and inflation need to gradually normalize, which suggest more months of macro uncertainty. The fastest path to a clearer macro backdrop is the Urate and inflation normalizing quickly, which would be consistent with a recession. Uncertainty is probably the best option for risk assets given the current backdrop.
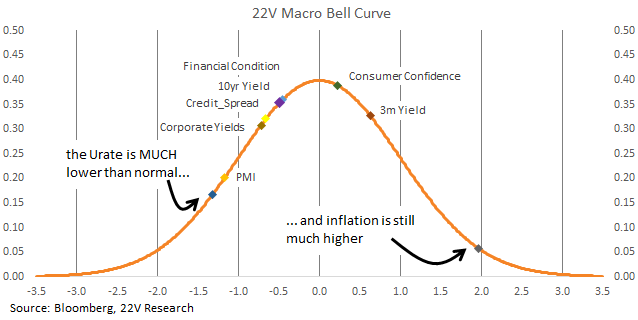
Changes in unemployment around rate hiking cycles have varied. It usually took several months for labor markets to reflect the impact of rate hikes. The change in unemployment during this cycle is similar to the trend in 1999, where it took about two years before the Urate increased meaningfully. Again, a gradual increase in unemployment is the path to a soft landing, suggesting the long period of macro uncertainty is the best likely path for risk assets.
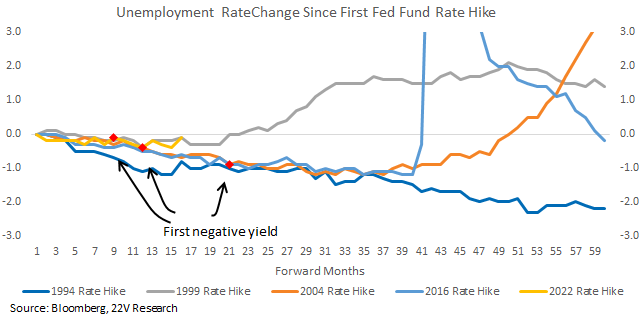
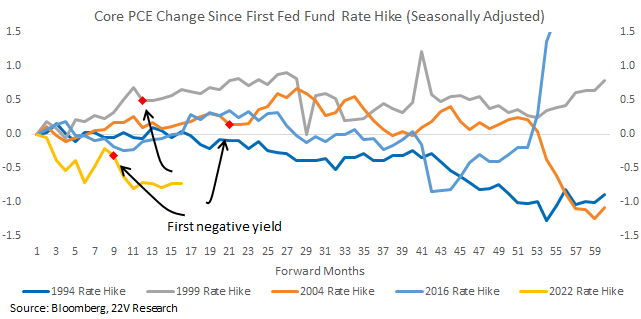
Inflation dropped MUCH quicker during most previous rising rate cycles since 1990. Though core PCE remains too high, super core readings, which have been the focus of policy makers, dropped recently. The backdrop is moving incrementally toward allowing for more two-handed policy decisions, where the FOMC is less focused on fighting inflation and can pay more attention to engineering a soft landing.