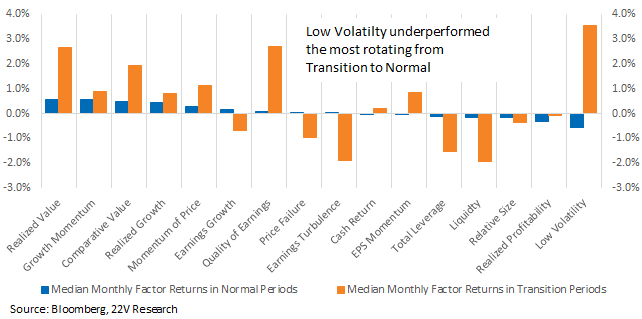
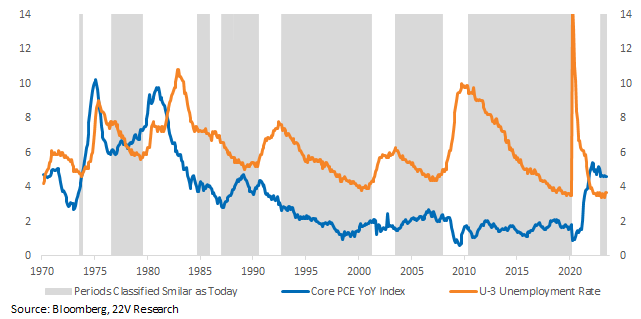
The post-COVID macro backdrop has differed from most of the past three decades due to high inflation and one of the fastest Fed rate hike cycles in history. Extending our Macro Regime Classification model back to the 1970s, to include the last high inflation, and rapid rate hikes periods, leaves us with seven regimes rather than the four that have existed since 1985. Those new regimes belong almost exclusively to the 70s and 80s. The relative stability of the past 30yrs of macro data compared to the 70s and early 80s flattens out the model signals, removing all nuance from the post-GFC to COVID period.
Measuring the distance (Euclidean) of changes in macro variables today relative to all previous periods generates a result similar to that of our regime model. Changes in macro data over the past 30 years have been more similar than compared to the 70s and 80s. Volatility tells a similar story. Macro readings during 1970s-1980s were more volatile, leading to much higher macro dispersion during those periods. So, even with similar inflation levels, the overall backdrop during 1970s -1980s is not particularly comparable to today.
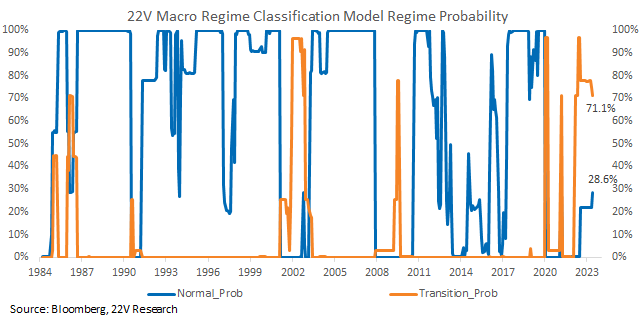
Our shorter-term, standard Macro Regime model, which we still think is more useful in guiding investments today, remains in “Transition.” The probability of rotating into a “Normal” backdrop increased further over the past month after incorporating new data releases. That is in line with stabilizing macro growth indicators such as the NY Fed Weekly Economic Index and PMI readings. The increasing probability that today is “Normal” and the declining odds of “Transition” means two things. 1) Macro data is moving further away from a recession-like backdrop. 2) The odds that we are in a Normal backdrop, which would suggest persistently lower correlations and more consistent risk-on/Cyclical outperformance, has increased. Put simply, our Macro Regime model indicates soft landing odds have increased.

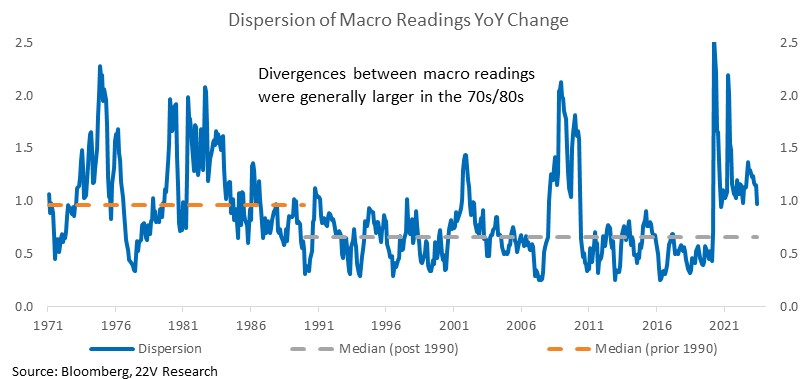
Value and Momentum factors outperformed during most Normal periods historically and returns to Low Volatility diverged the most between Transition and Normal. The more a normal backdrop is priced in, the more risk-on factor leadership is likely to be. Since mid-May, risk-on factors have led risk-off, consistent with the decreasing probability of a recession. The Value vs. Growth trade remains complicated by the high correlations between the two factors, as well as their alignment to risk-on factors. We continue to favor Growth factors given the Fed’s focus on maintaining below-trend growth to reduce inflation.
Comparing the Macro Regime of the 1970s to Today: The post-COVID macro backdrop has differed from most of the past three decades due to high inflation and one of the fastest Fed rate hike cycles in history. Our macro regime model, which categorized regimes using the distribution of a broad set of economic and market data, has put the economy in “Transition” since early in the rate hiking cycle, a nearly unprecedented period of uncertainty. As a check on the unusually long Transition, we extended our Macro Regime Classification model back to the 1970s so we could include the last period of high inflation. Extending the model to the 1970s leaves us with seven regimes rather than the four that have existed since 1985. There are fewer macro regimes, particularly from 1990 forward, due to the relative stability of macro data over the past ~30 years. That stability, when compared to the 70s and early 80s, also flattens out the model signals, removing all nuance from the post-GFC to COVID period. So, even with similar inflation levels, the overall backdrop during 1970s -1980s is not particularly comparable to today.
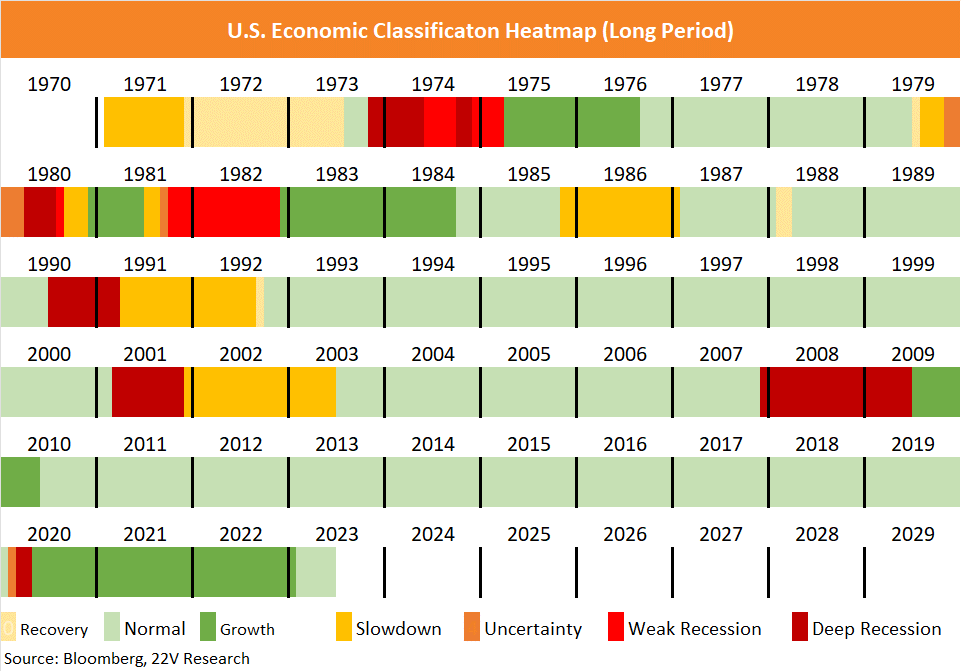
Measuring the distance (Euclidean) of changes in macro variables today relative to all previous periods generates a result similar to that of our regime model. Changes in macro data over the past 30 years have been more similar than compared to the 70s and 80s. Post 1990, the periods that looked most similar to the 70s and 80s were centered around shocks/recessions. Macro distance confirms that the prior high inflation period is not an effective guide to understanding today. That would change IF the economy slipped into recession (though the type of recession would matter).
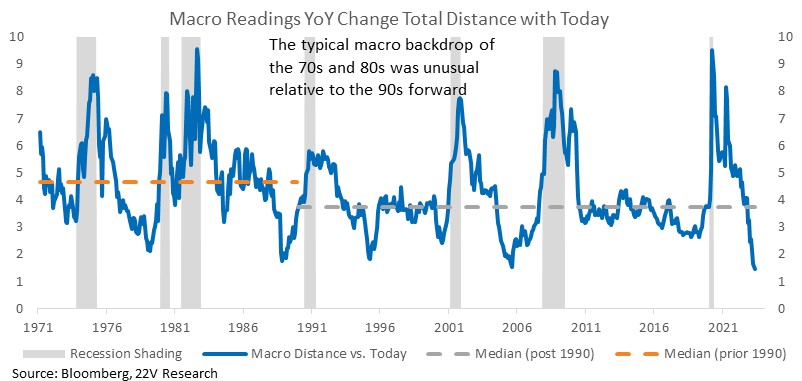
Macro readings during 1970s-1980s were more volatile, leading to much higher macro dispersion during those periods. The volatility of macro readings has been higher in the post-COVID period but has fallen since October of last year as well. Broad macro data began to stabilize at roughly the same time equity multiples and the market bottomed out.
Two of the most unusually distributed data points today are the two covered by the Fed’s dual mandate. Inflation and payroll readings today are MUCH different BOTH the 1990-fwd and the 1970s-1980s trend. Inflation remains higher than in most post-1990 periods while unemployment is low relative to the 70s/80s. That combination suggests increased macro uncertainty, and hints at the possibility of a new paradigm for macro data. If this is a new paradigm, it will not be clear for many years though.
Our shorter-term, standard Macro Regime model, which we still think is more useful in guiding investments today, remains in “Transition.” The probability of rotating into a “Normal” backdrop increased further over the past month after incorporating new data releases. That is in line with stabilizing macro growth indicators such as the NY Fed Weekly Economic Index and PMI readings. Our model is not predictive. It simply determines, given available macro and market data, the probability that the economy is in one of four possible regimes (Growth, Normal, Transition, Recession). The increasing probability that today is “Normal” and the declining odds of “Transition” means two things. 1) Macro data is moving further away from a recession-like backdrop. 2) The odds that we are in a Normal backdrop, which would suggest persistently lower correlations and more consistent risk-on/Cyclical outperformance, has increased. Put simply, our Macro Regime model indicates soft landing odds have increased.
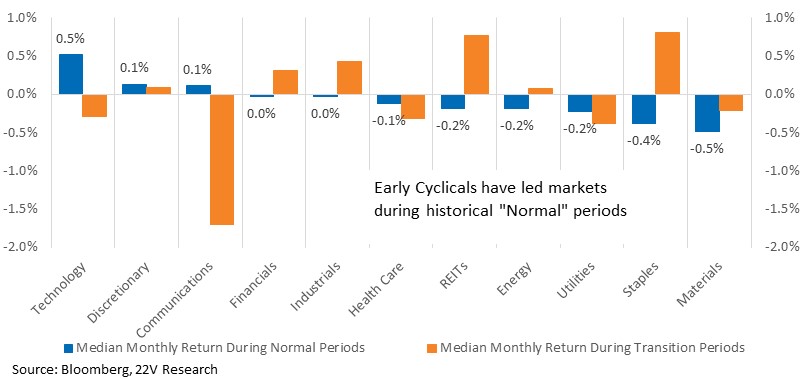
Recent sector returns are more like what we would expect to see during Normal periods. During historical periods classified as Normal, Early Cyclicals lead while both Deep Cyclicals and Defensives see more mixed returns. The outperformance of Early Cyclicals this year has been in line with a shift toward a “Normal” regime. Near-term, we expect some recovery of Deep Cyclicals as left tail risk in the economy eases, while Defensives will continue face headwinds.
Value and Momentum factors outperformed during most Normal periods historically and returns to Low Volatility diverged the most between Transition and Normal. The more a normal backdrop is priced in, the more risk-on factor leadership is likely to be. Since mid-May, risk-on factors have led risk-off, consistent with the decreasing probability of a recession. The Value vs. Growth trade remains complicated by the high correlations between the two factors, as well as their alignment to risk-on factors. We continue to favor Growth factors given the Fed’s focus on maintaining below-trend growth to reduce inflation.