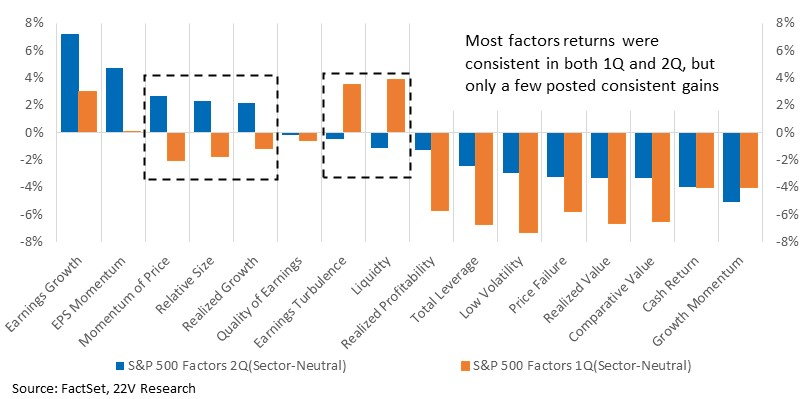
Weekly: During the first half of 2023, Early Cyclicals (Tech, Discretionary, Communications) and only a few factors like Earnings Growth and EPS Momentum, posted consistent gains. Economic growth slowed (from a blistering pace), and EPS came under pressure, so it makes sense that Earnings Growth and Momentum outperformed. Recession risk has been unusually high according to investors. 81% of the clients we polled (HERE) put recession odds for 2023 or 2024 above 50%. That’s roughly consistent with the percent that expected a 2023 recession when we asked in January (81%), during our post-SVB survey (83%), and in our May survey (72%). That helps explain the strong performance of fundamental momentum and Early Cyclicals in 1H23, both of which benefited from slowing economic growth and declining inflation (from peak).
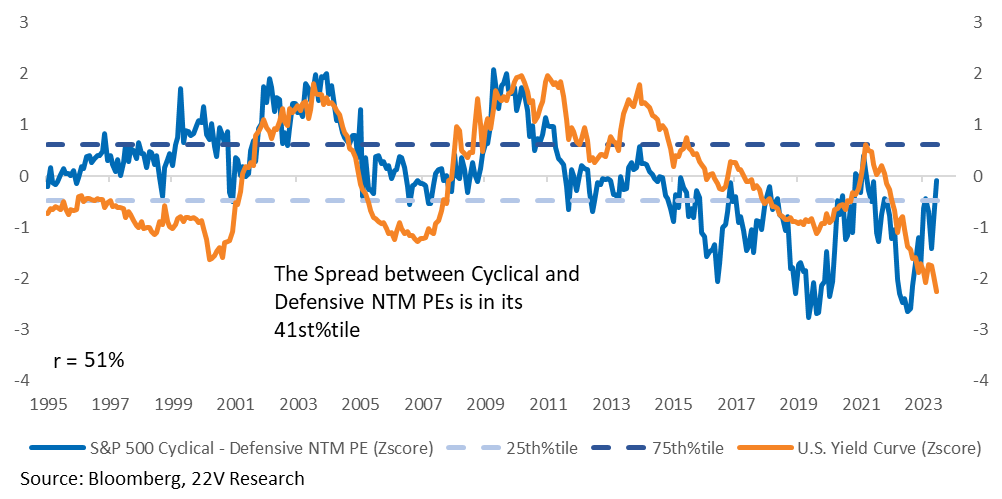
Given the extreme valuation spread of Defensives relative to Early Cyclicals (and all Cyclicals) coming into 2023, Defensives needed a recession to outperform. That recession never showed up, which is why Defensive sectors have been some of the worst performers YTD.
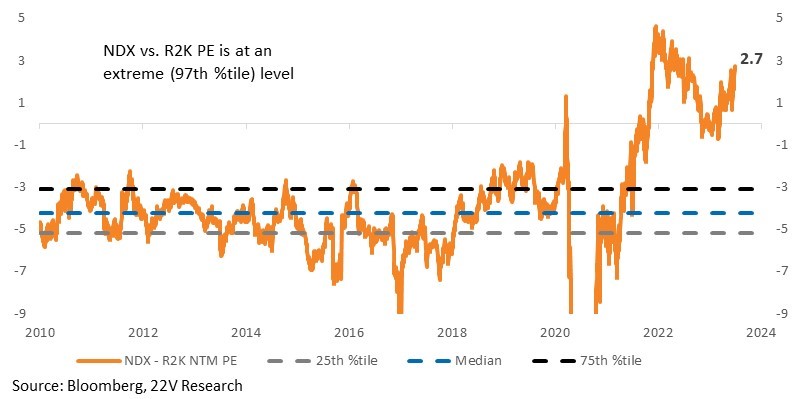
Economic growth is unlikely to reaccelerate meaningfully, so stocks with strong earnings trends should continue to be favored. But the average stock looks better than mega caps today, and the driving force for returns is likely to be less about Value and Growth and about risk and fundamental momentum. FYI – The PE spread between Nasdaq and Russell is extreme, and the NDX PE, currently at 26 (88th%tile historically) is the main driver of that spread. The S&P is up 16% in 1H23, and we are comfortable with our call that the best of the S&P return for 2023 is behind us. Internals will matter more in 2H23.
Relative to the broader equity market, the S&P is more risk-off and less risk-on exposed, if we are correct on a continued risk-on rotation, market returns should be limited.
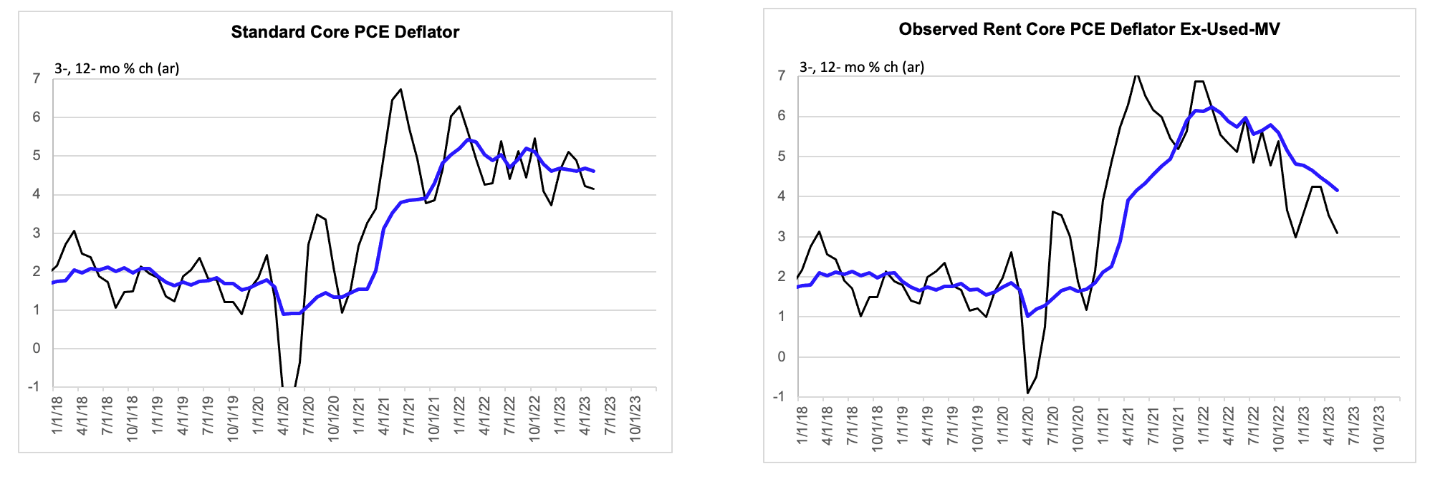
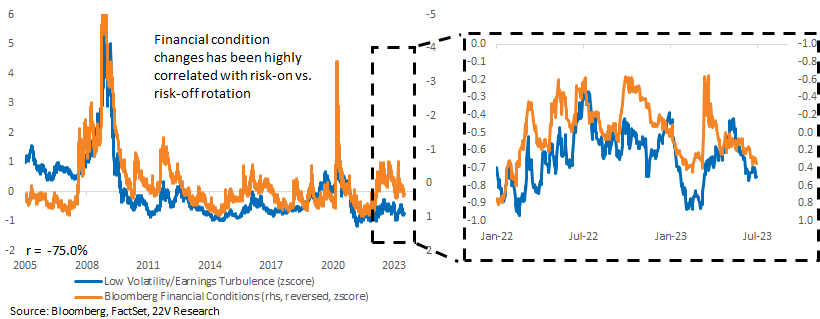
Risk-on and off rotations have been highly correlated with financial conditions historically. Financial conditions have been volatile during the rate hiking cycle, contributing to the frequency and magnitude of swings between risk factors. For now, we see no reason for financial conditions to tighten much. As Gerard pointed out after the PCE data on Friday “There has been far more disinflation than, say, Jay Powell is publicly recognizing”. Gerard’s measure of Core Services (basically the Ex-Government Rent and used Auto data) shows a 3-month annualized rate of just over 3% for core. 4% for the 12-month. That is constructive for risk assets.
The risk according to Gerard is that “there is a very good chance that disinflation from here will be tougher (replay HERE).” Wages staying at too high of a level COULD require the Fed to tighten financial conditions more. But the Fed is not signaling current that they hold that belief. So FCI should be range bound/biased slightly easier and help risk-on factors.
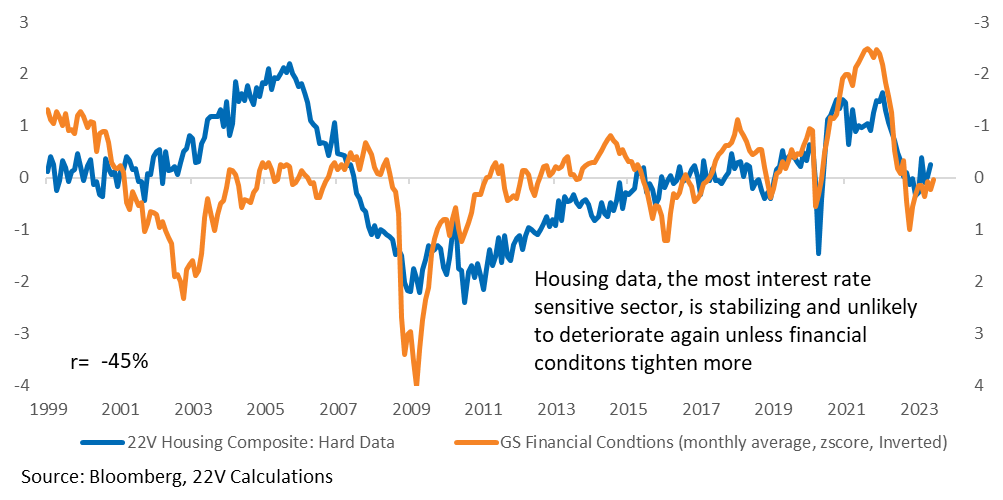
At the same time that, CURRENT inflation trends are positive (again, future inflation could be a problem) and the tail risk to economic growth has declined meaningfully as we head into 2H23. Housing data was a significant drag on the economy last year. Stabilization and a slight improvement in housing data suggest most of the impact from rate hikes (which impact the economy through financial conditions) are already in the economy. That means the lagged impacts of monetary policy are much less likely to drive the economy into recession in the near term. Income growth has cooled, and the underlying trend (in real terms) now looks to be in a range of 1 to 2%. Expect real personal consumption spending to remain in the 1-2% range given the trend in income growth. A bottoming in housing and unusually strong net worth effects (plus 34 trillion vs Jan 2020) will continue to support consumer spending.
Bottom Line: With the macro backdrop improving, despite 5%+ Fed funds, the neutral rate is likely higher than in the recent past. That suggests financial conditions will be stable to easier over the coming months. That will be a tailwind for risk-on factors into 2H. The risk is if inflation and labor demand remain too strong, forcing the Fed to tighten conditions further. With the average stock outperforming, S&P returns should slow meaningfully.
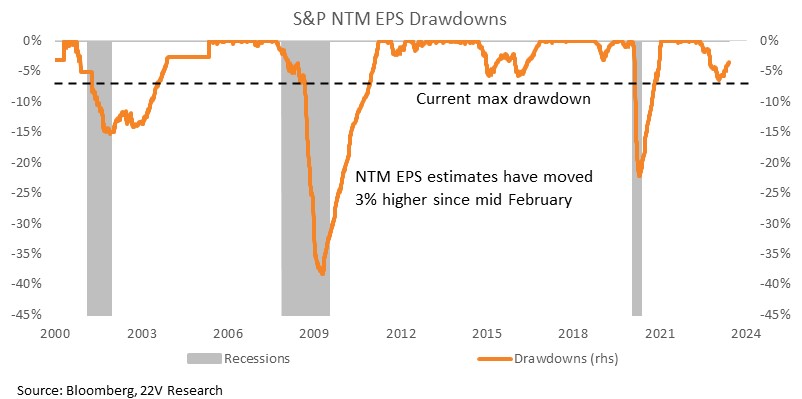
Some Odds & Ends Into 2H23: Since their relative low in February, the S&P NTM EPS estimates are up 3%, a trend we expected to continue near term. The -6.4% NTM EPS drawdown has been much milder than what was seen during recently recessions. The current path is more like the 2015 slowdown. The history of NTM estimates is limited, and recessions are relatively rare and poorly defined, so this isn’t a statistic, just an observation.
The S&P multiple bottomed in September of last year (chart HERE), a few weeks ahead of the first 10yr–3mo yield curve inversion of this cycle. Historically, S&P multiples fallen after yield curve inversions. In absolute terms, recession multiples tend to bottom around 14.5-15x.
46% of recessions did not start within 1 year of a yield curve inversion, and 27% of recessions did not start within 2 years of a yield curve inversion.
So, what does the yield curve tell us now? most market signals indicate higher short rates are required today to lower inflation in the future (hence the inverted curve), but a recession is not the base case to get inflation toward the Fed’s target (inflation goes down the easy way, not the hard way). Again, that could change if the Fed needs to crush growth because inflation is sticky high. But that is not being priced now. Interestingly, investors we survey continue to be far more pessimistic than broader financial conditions on recession risk.
Charts & Comments Below…
Indicators: Housing data were a significant drag on the economy last year, but the stabilization and slight improvement in housing readings suggest most of the impact from Fed rate hikes (which impacts the economy through financial conditions) are already in the economy. That means the lagged impacts of monetary policy are much less likely to drive the economy into recession in the near term. We expect the average stock, destocking losers, deep cyclicals, and small caps to continue to do well over the coming weeks as hard landing risk is reduced.
 There has been far more disinflation than, say, Jay Powell is publicly recognizing. Take a look at the right panel of the chart below. On the other hand, there is a very good chance that disinflation from here will be tougher, for reasons Gerard went over on a call Thursday (replay HERE).
Source: BLS, Bloomberg, 22V Research
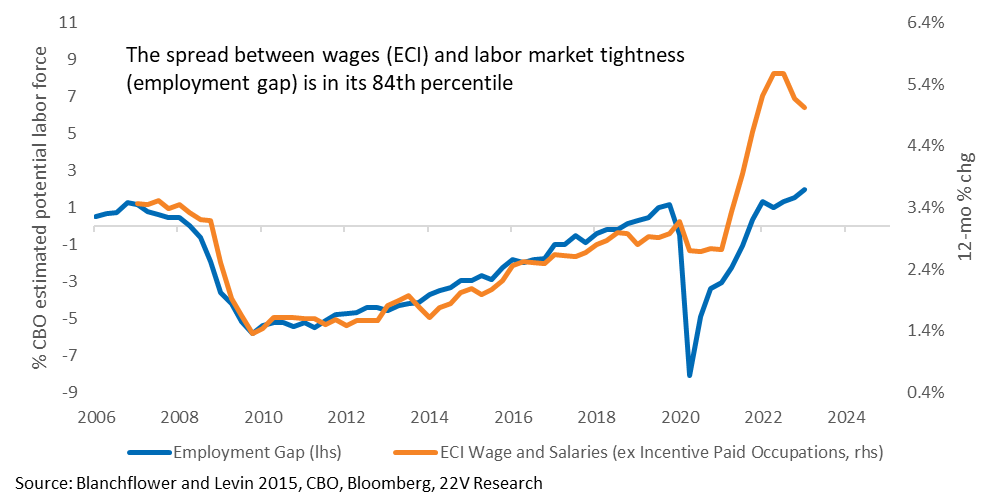
There is a risk that financial conditions need to tighten more, which is something Gerard has highlighted (HERE). The easy part of disinflation (rents and goods prices normalizing) is past. The harder part of getting core PCE below 3% is ahead of us. Wages are still too high even as demand growth has normalized to a slightly below trend pace. That suggests the unemployment rate needs to move higher to get core PCE below 3%. This doesn’t have to be the case. Wages could come down without much labor market disruption. There was a similar urate in 2019 with much lower wages. Macro uncertainty is VERY high, so conviction about macro outcomes needs to remain low.
Risk-on and off rotations have been highly correlated with financial conditions historically. Financial conditions have been volatile during the rate hiking cycle, contributing to frequency and large swings between risk factors. With the macro backdrop improving and the neutral rate likely higher than in the recent past, financial conditions are biased stable to easier over the coming months. That will be a tailwind for risk-on factors into 2H. The risk is if inflation and labor demand remain too strong, forcing the Fed to tighten conditions further.
Improvements in the macro backdrop and easing but still high core inflation readings suggest the neutral rate is higher today. That also suggests financial conditions will remain stable to easier UNLESS wage growth moves higher. Stable to easier FC would be an ongoings support for risk-on factors into 2H.
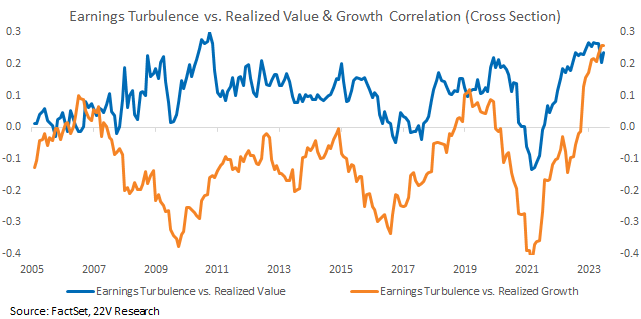
Cross sectional correlations between Earnings Turbulence (risk-on) and Value and Growth are usually negative; Growth and risk-on are usually negatively correlated while Value and risk-on are positively correlated. This year, both correlations have been positive and higher than normal, especially for Earnings Turbulence vs. Realized Growth. Simply put, Growth and risk are much better aligned than normal, and there is less of a distinction between Value and Growth names.
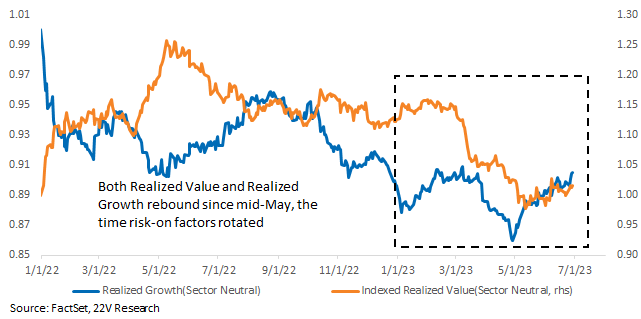
Since mid-May, as the market embraced risk-on factors again, both Growth and Value have moved higher. Risk exposure is the driving force here, not style.
Small vs. Large Now: Housing data is better, wages are elevated, and rates are likely to stay higher for longer. That should favor small caps relative to large caps all things equal. The PE spread between Nasdaq and Russell is extreme and the NDX PE, currently at 25.9 (88th%tile historically) is the main driver of that spread. If the Fed needs to tighten financial conditions more (stocks are part of financial conditions), higher PE stocks are likely to suffer the most.
Market Trends Diverging from Historical Yield Curve Inversions: High frequency macro suggest U.S. growth is stable at a low (below trend) level. The absence of a collapse in growth has been enough to support a rebound in earnings sentiment, guidance, and sell-side estimates. NTM earnings expectations have improved even since the Fed delivered its “hawkish pause”, signaling potential for two more rate hikes this year. From their relative low in February, the S&P NTM EPS estimates are up 3%, a trend we expected will continue near term. The -6.4% NTM EPS drawdown has been much milder than what was seen during recent recessions. The current path is more like the 2015 slowdown. The history of NTM estimates is limited and recessions are relatively rare and poorly defined, so this isn’t a statistic, just an observation.
Earnings expectations have firmed, but the large rebound in price from the October low means multiple expansion is responsible for ALL the S&P’s gains. More recently, from SVB’s failure to now, the market is up ~11% (ln) and fundamentals account for about a third of that return. The S&P multiple bottomed in September of last year (chart HERE), a few weeks ahead of the first 10yr–3mo yield curve inversion of this cycle. Historically, S&P multiples have fallen further after yield curve inversions. In absolute terms, recession multiples tend to bottom around 14.5-15x.
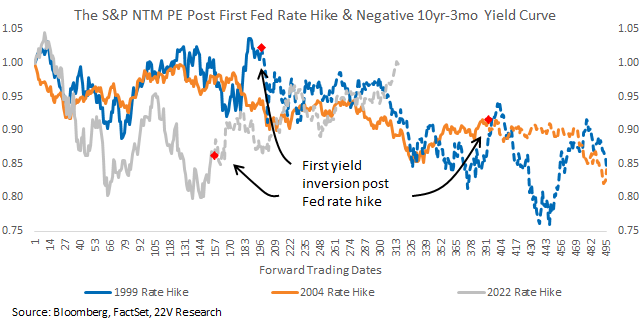
With financial conditions stable, credit spreads narrowing, and stock prices higher, it is difficult to say a bunch of government bond traders have extremely high conviction in a recession, but everyone else does not. The signals from the market today seem to be that higher short rates are required now to lower inflation in the future (hence the inverted curve), but recession is not a base case to get inflation toward the Fed’s target. Again, that could change if the Fed needs to crush growth.
Historically, 46% of recessions did not start within 1 year of a yield curve inversion, and 27% of recessions did not start within 2 years of a yield curve inversion. Nearishby recession risk is elevated while the yield curve remains inverted, which is consistent with 81% of investors we surveyed expecting a recession this or next year (survey HERE). At the same time, S&P multiple expansion suggests those same investors are willing to price a soft landing (mild/no recession) when data points in that direction. Investors accept that a nearby recession is not a forgone conclusion.
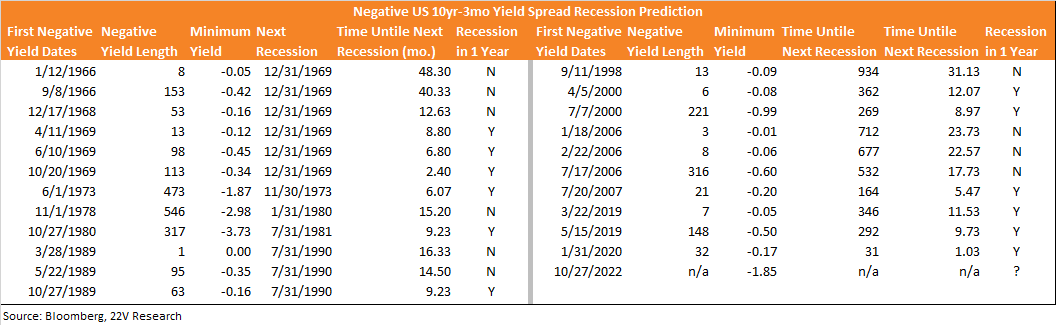
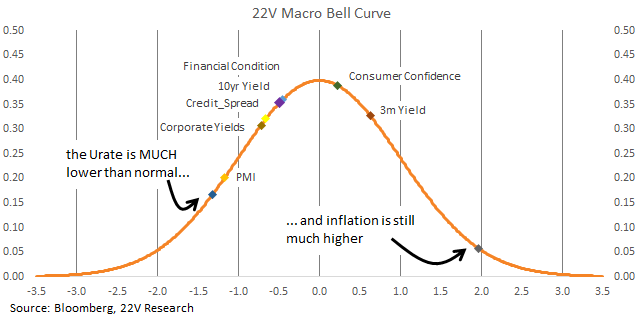
If a soft landing is the end point of this slowdown, the Urate and inflation need to gradually normalize, which suggest more months of macro uncertainty. The fastest path to a clearer macro backdrop is the Urate and inflation normalizing quickly, which would be consistent with a recession. Uncertainty is probably the best option for risk assets given the current backdrop.
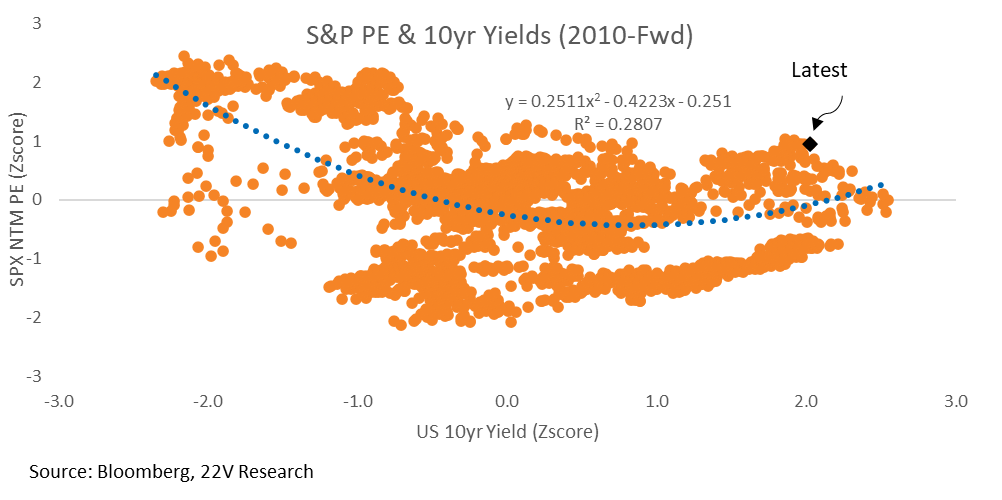
Why 10yr yields move is important and higher yields DOES NOT automatically mean lower markets. Nominal 10yr yields and PEs are not well correlated overtime and there is a HUGE range of yield and PE pairs. In other words, the 10yr isn’t going to be a good guide to the appropriate level of PEs UNLESS the 10yr is a MUCH more precise predictor of PEs today than in the past. Yes, rising yields put downward pressure on PEs, but the direction of markets is more dependent on changes in risk appetites and is influenced by a range of factors (EPS growth, cash return, inflation trends, fed intent etc.).