DAILY STRATEGY: Main Points – 1) if the Fed doesn’t hike today, it would likely help the Momentum factor only at the margin if at all. Idio is the main driver. META/MSFT relieving some fears about AI capex ROIC would be more important. The Fed not hiking AND META/MSFT relieving some AI capex worried would be plus. The Fed is second order. If the Fed does hike, all risk assets will likely suffer on the day.
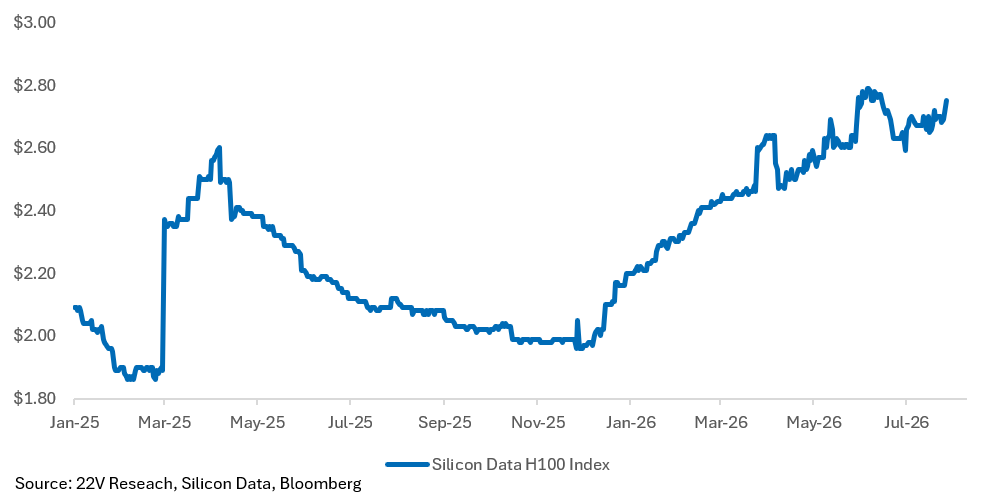
2) The percentage of companies using AI tools is accelerating (some caveats below), margins have come in better than expected, and an indicator of compute demand is increasing. Specifically, the H100 spot index, a benchmark that measures the effective expenditure-weighted price of LLM models expressed as dollar per million tokens is increasing and at a high level. That suggests compute is still tight and demand is high. The implication is that many companies are using AI tools (what they say is confirmed by a demand indicator) and that usage is associated with improving margins. That is positive LONGER TERM for the AI Buildout names.
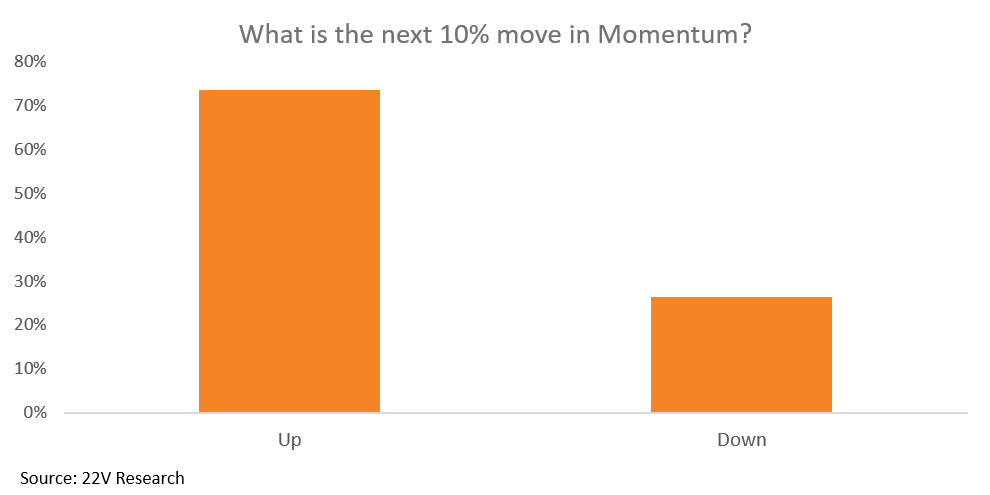
3) 73% of Investors we surveyed expect the next 10% move in the Price Momentum factor to be higher, not lower. History suggests that +10% is the norm after such a large sell-off in Price Momentum factor…but over 12 months.
Background on The Main Points – A few investors noted to us that the Fed not hiking would lead to a bounce in the Price Momentum factor. We get that logic given firm fundamental data from the Price Momentum names, or the companies that impact the price Momentum names through the AI buildout (GOOG firm capex projections). 88% of Price Momentum names have beat on Sales, vs ~73% historically. Beating on sales is typically the most important driver of returns during a normal economic expansion (HERE).
The problem, even post the relatively dovish CPI/PPI data, after which July rate hike expectations collapsed back to 10%, Momentum and Semis remained under pressure. And broader CDS spreads remain unusually tight as Hyperscaler CDS widened. As 22V Data & Infrastructure analyst Dauvin Peterson pointed out last night (HERE). Hyperscaler spending rates and the search for ROIC and margin expansion remain elusive. This seems like the biggest problem. The fed raising rates doesn’t help, but it is second order in our view (see yesterday’s report on more questions than answers HERE).
The 22V view is that AI investment are likely to show long-term benefits, but the market is concerned about the size of the bet right now. And the asymmetric risk has increased. If it is proven that ROIC remains elusive, a sudden pullback in spending is more likely when cash flow has gone negative. Maybe results from META and MSFT have the potential to be market moving. We could see a situation in which the Fed doesn’t hike and META/MSFT relieve some fears on AI value creation. We would react to that happening, not get ahead of it.
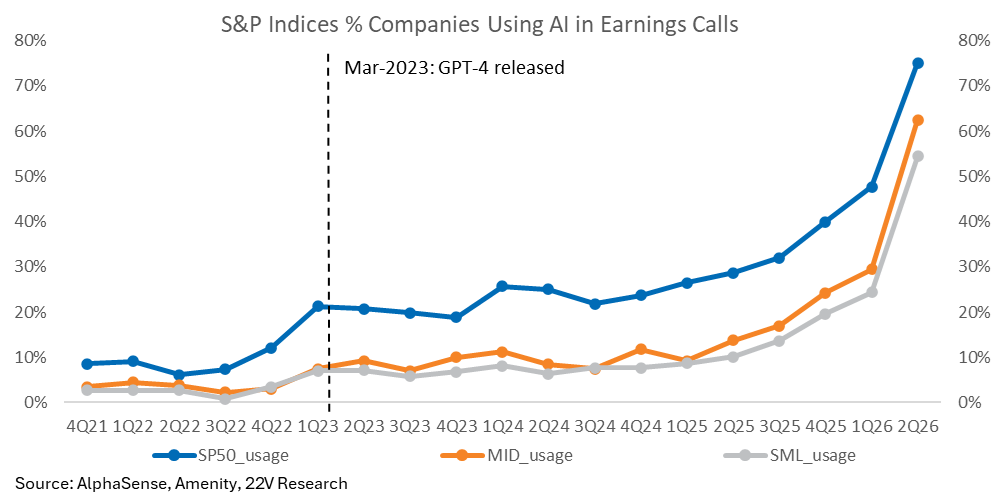
Mark To Market – We believe one of the most important indicators of AI demand is companies showing productivity and margin gains from using AI tools. With roughly 43% of S&P 1500 companies reporting, AI usage appears to be accelerating dramatically (charts below with some caveats). While margins have come in better than expected and an indicator of compute demand (the H100 spot index, a benchmark that measures the effective expenditure-weighted price of LLM models expressed as dollar per million tokens) is increasing and at a high level. That suggests compute is still tight and demand is high.
The implication is many companies are using AI tools (what they say is confirmed by a demand indicator) and that is associated with improving margins. This should be a support for the AI Buildout names longer term. Investors likely need to see what appears to be happening with AI usage and margins at the average company flow into Hyperscaler expressing more confidence on the ROIC from the AI Capex buildout.
Charts and commentary below….
Investors expect the next 10% move in momentum to be higher from here.
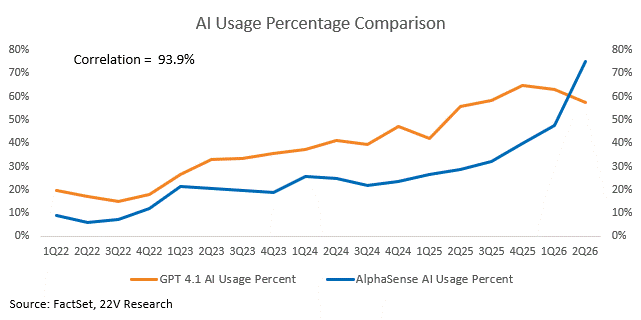
We measure the percent of companies referencing specific use cases of AI in earnings calls (cross checked using a couple different sources and methods of extracting comments). That ratio is increasing over time.
There are discrepancies in when the providers deliver transcripts, leading to differences in usage rates over time. The rate of earnings usage can swing a lot over the course of an earnings season since there is different sector mix shift over time, making intra-earnings season updates more tentative than deterministic.
The H100 spot index is our best measure today and that index remains at its highest level. One might consider that this index could drive higher if the open-source adoption of K3 takes up even more scarce compute resources.
The Silicon Data LLM token expenditure index is a benchmark that measures the effective expenditure-weighted price of LLM models expressed as dollar per million tokens. The index is published as a single blended reading across the LLM inference market.
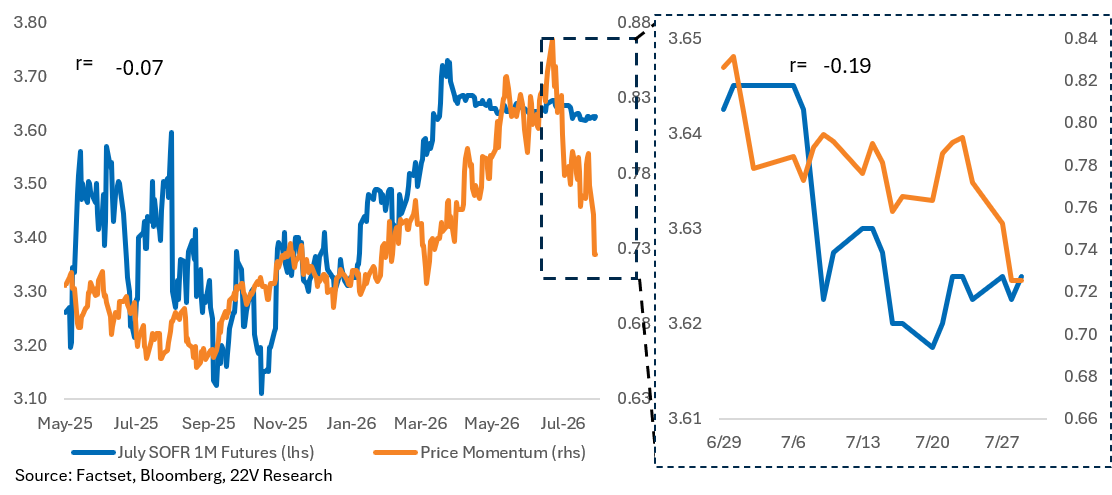
Rate hike expectations have weighed on Price Momentum but are not the recent primary driver of Momentum returns. The correlation is breaking down as idio newsflow increases.
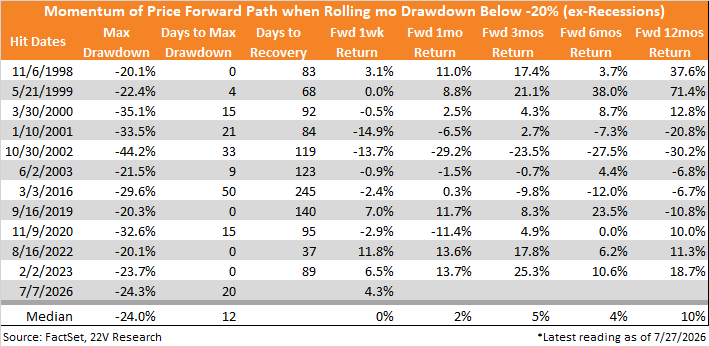
Although the duration and ultimate depth of the current unwind remain difficult to predict, historical non-recessionary episodes in which Momentum of Price drawdowns first breached -20% provide some references. The median maximum drawdown across these episodes was approximately -24%, close to the current level. Subsequent returns were volatile but generally leaned positive, suggesting that the worst of the decline may be behind us, although a rapid recovery to the previous peak is unlikely.