

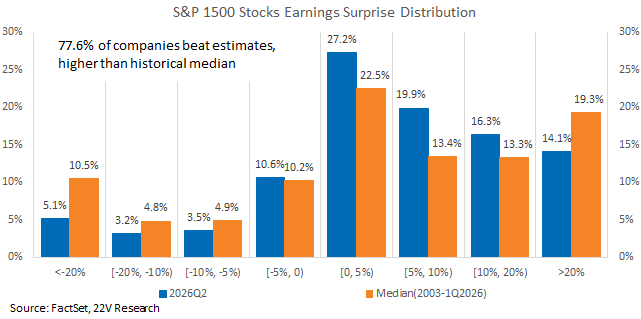
With 20% of S&P 500 companies reported, S&P 1500 earnings growth remains solid. 77.6% of companies have beat EPS estimates, though beats are concentrated in the <=10% range. The 2Q earnings releases are important as a potential catalyst to stabilize Price Momentum performance, however, reported readings for now offer a mixed picture for the factor.
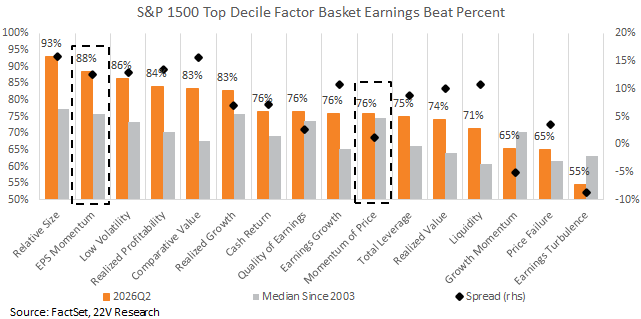
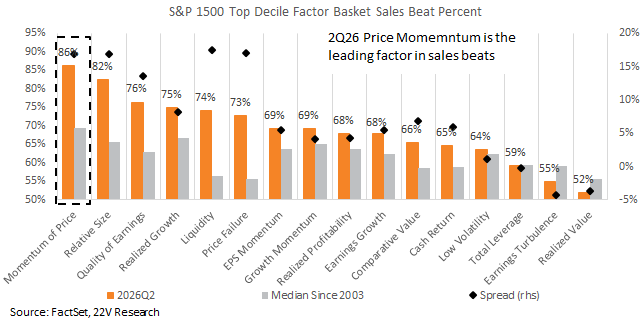
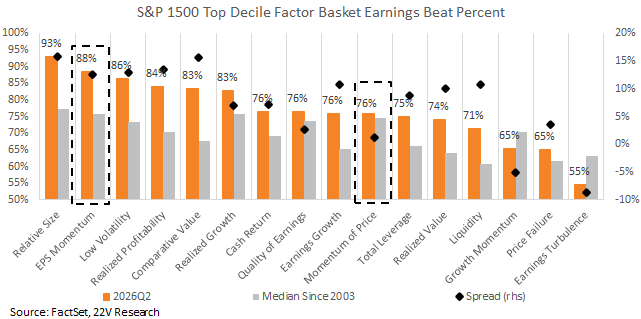
On sale beats, Price Mo names lead all other factors and are posting one of the largest beat rates relative to its own history. The implication is that the elevated revenue expectations of high Price Mo names have largely been met. However, the factor’s 76% EPS beat rate ranks behind half of factors and is less compelling given Price Mos historically high beat rate relative to other factors. EPS Momentum is more interesting, currently ranking second on EPS beats, reinforcing our preference for EPS Momentum over Price Mo. Our L-S swap of EPS Mo vs Price Mo has gained 10.4% over the past month.
Management commentary points to the same divergence. Price Mo remains among the factor leaders in absolute earnings sentiment and has median margin sentiment. However, its earnings sentiment, margin outlooks, and guidance breadth have all trended lower over the past quarter. Strong sales alongside softer EPS and margin commentary suggests cost pressures and capital expenditures are limiting operating leverage of high Price Mo names.
As we expect the strong sales and lackluster earnings combination to continue, upcoming reports from AI beneficiaries could help stabilize Price Mo, but are less likely to resolve longer-term profitability concerns.
175 S&P 500 companies report this week, and we highlight the names with the greatest beat potential and miss risk at the end of report.
Strong Sales but Less Exciting EPS Trends Delivers Mixed Price Momentum Outlook: Earnings surprise for the S&P 1500 remains strong in 2Q. With 20% of companies reported, 77.6% beating estimates. The distribution is less polarized in 2Q than normal and relative to last quarter. Fewer names are posting extreme beats or misses (exceeding +/-20%) while the percentage posting 0-20% beats has increased. The net is that that breadth of earnings beats has improved even as index EPS growth has accelerated to ~27% y/y.
Price Mo earnings releases are an important catalyst for stabilization of the factor following its recent drawdown. So far, reported high Momentum names have painted a mixed picture. Price Mo is the best performing factor in terms of 2Q sales beat raes. It is also one of the factors with the highest sales beat rate relative to its own history. On the top line, the high expectations embedded in Price Mo names have been justified by results.
But the EPS beat rate of high Price Mo names is less impressive. Currently, Price Mo’s 2Q EPS beat rate is ~76%, roughly 7pp above its median. However, Price Mo’s EPS beat rate is in the middle of the pack relative to all factors, which is unusual. Typically, high Price Mo names have the best beat rates Critically, EPS Momentum currently has the second-highest EPS beat rate. As we highlighted (HERE), we favor EPS Mo over Price Mo, and our swap of long S&P 1500 EPS Momentum and short S&P 1500 Price M has gained 10.4% MoM.
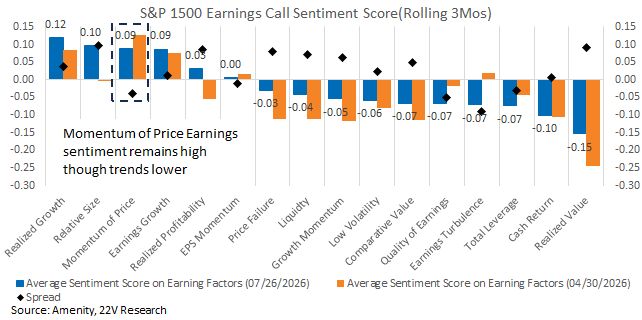
Sentiment readings expressed by management for Price Mo names remain among the highest of all factors, but its earnings sentiment has dropped over the past quarter, falling more than any factor other than Earnings Turbulence and Quality. The bottom line is high Price Mo names continue to enjoy strong level of sentiment, but the direction of travel has been lower.
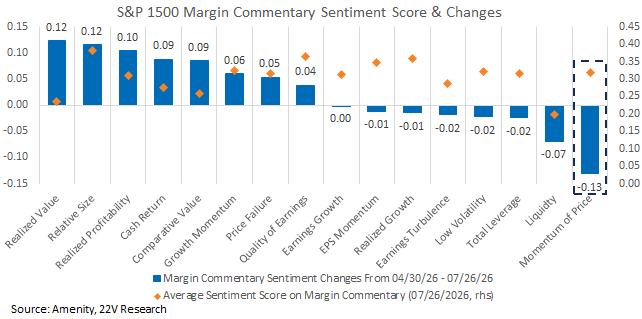
The top decile S&P 1500 Price Mo margin outlook sentiment also dropped, falling the most of all our factors. Price Mo’s absolute margin sentiment remains around that of other factors, but the direction is lower. Margin sentiment declines and lackluster earnings beats combined with strong sales beats suggests increasing costs, capex etc. (see Appendix for details) are weighing on the bottom line performance of high Price Mo names.
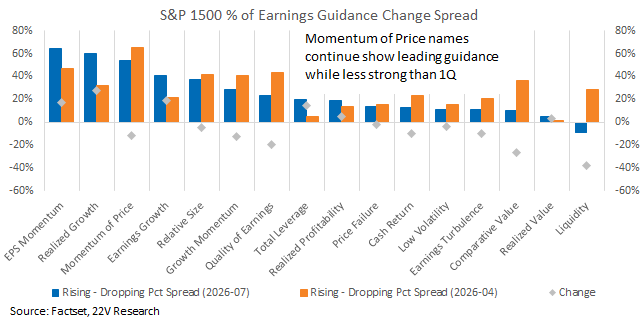
Earnings guidance adds to the cost driven concerns with net guidance by high Price Mo names turning negative. With more Price Mo AI beneficiaries reporting in the coming weeks, a similar pattern of strong sales alongside more cautious EPS and margin commentary is likely to persist. Strong absolute results should help stabilize Price Mo, but are not likely to alleviate longer-term profitability concerns.
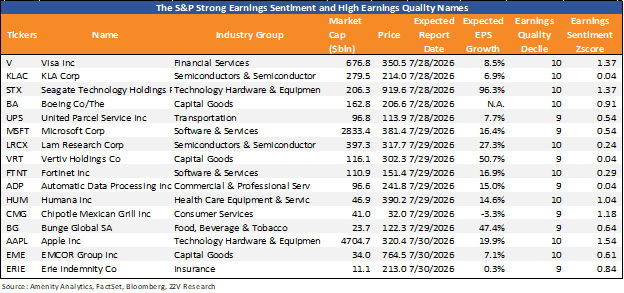
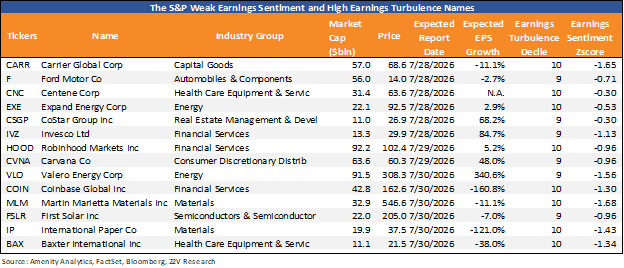
Week Ahead: 175 S&P 500 names are scheduled to report this week. Below we list the names falling in the higher beat potential basket. These names have high Earnings Quality and positive earnings sentiment scores. Those more likely to miss estimates have high Earnings Turbulence and negative earnings sentiment score.
Appendix:
INTC, GEV and JBHT are three names in Momentum of Price Basket that reported over the past two weeks, and they represent three different industries Semiconductors, Electrical Equipment, and Transportation that directly benefited from the Broad AI Buildout. Strong sales but less exciting EPS are expressed repetitively among the top Price Momentum names and we highlight them below.
Intel CEO Lip-Tu Tan highlighted: “Today, we are seeing the strongest revenue growth in more than 15 years.” While CFO David Zinser mentions “Operating profit for CCPG was $2.3 billion, 26% of revenue, and down approximately $173 million quarter over quarter, due to inventory charges taken to optimize our factory network”.
GE Vernova Inc CFO highlighted: “In the second quarter, we booked orders of $24.2 billion, an 88% increase year-over-year. Revenue increased 68% on a reported basis. Equipment backlog to $41 billion, up 69%.” But also included that “EBITDA margins expanded 320 basis points to 18.8%, mainly driven by favorable price and higher volume more than offsetting inflation as well as additional expenses to support capacity investments at Gas along with R&D.”
J.B. Hunt Transport Services, Inc. CFO Brad Delco stated, “Our revenue increased 35% with load growth of 14%, but our gross profit dollars declined 12%, primarily due to higher purchase transportation rates.”

