Back Quantitative

Quant Market in Numbers: Price Momentum Drawdown & EPS Momentum Relative Tailwind

Published on July 7, 2026

Download the PDF Report

By

Dennis DeBusschere

Sophia Wang

Kevin Brocks

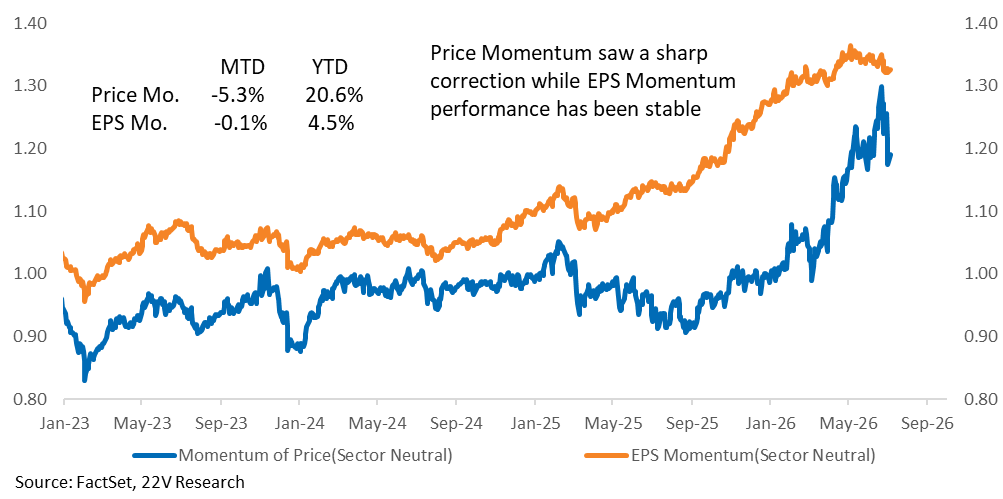
Momentum factors, including both EPS and Price Momentum, have surged since last September, with Price Mo accelerating this year (HERE) until the past few weeks. Price Mo has struggled as winners in AI and Semis have pulled back, leaving a -17.4% drawdown for the unconstrained Price Mo basket. In contrast, EPS Momentum remains resilient and slipped just -1.8% from its peak.

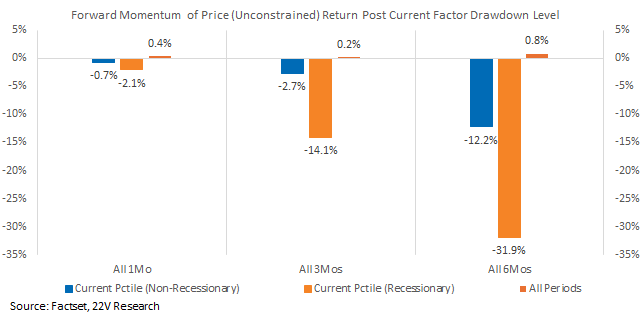
Historically, 1, 3, and 6 month forward returns to Price Mo are weaker than usual, regardless of recessionary or non-recessionary periods, following similar declines. However, S&P forward return over the same forward periods tend to be better than normal. The exception is over 1) short periods 2) during recessions. The bottom line is Price Mo weakness tends to signal further weakness in Price Mo only.
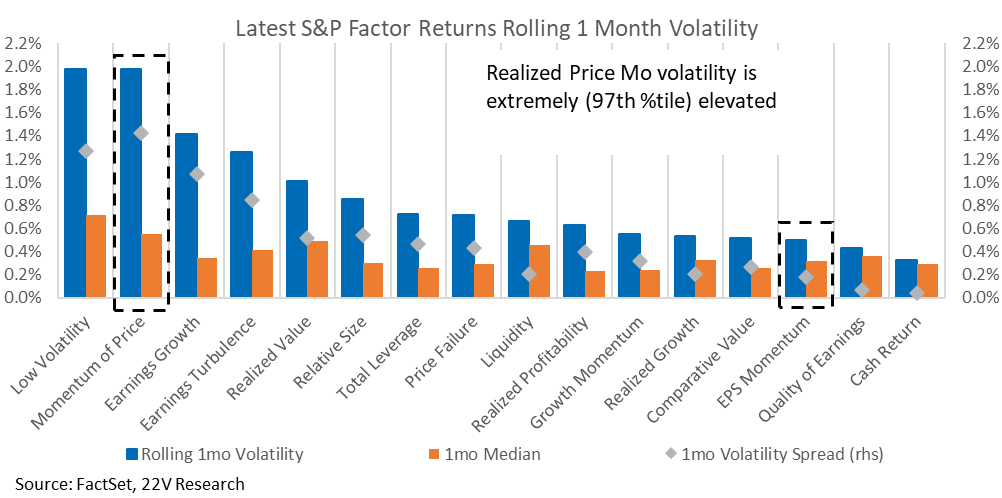
Although the recent correction has reduced some of the excesses in Price Momentum, volatility of the factor remains well above its long-term median at the 97th and 93rd percentiles for rolling 1 month and 6 months readings. That high volatility reflects the divergent views about Price Momentum.

Relative to Price Momentum, the volatility for EPS Momentum is much lower on an absolute basis and relative to its long-term median, leaving less risk to the factor. Our tradable Swap MS22EVPM Index which long S&P 1500 top decile EPS Momentum and short Momentum of Price has gained 5.4% YTD and we expected further gains if Momentum factors continue to follow their historical patterns. We list S&P 1500 top decile EPS Momentum of Price names at the end of this report.

Price Momentum Drawdown & EPS Momentum Relative Tailwind: Both EPS Momentum and Price Momentum have strengthened significantly since September, reflecting a broad improvement in both earnings revisions and market sentiment. However, the two factors have diverged over the past month. Price Momentum has experienced a sharp pullback over the past two weeks as profit-taking and increased market volatility weighed on recent AI and Semis winners. In contrast, EPS Momentum has remained resilient, slipping just –1.8% from its peak.
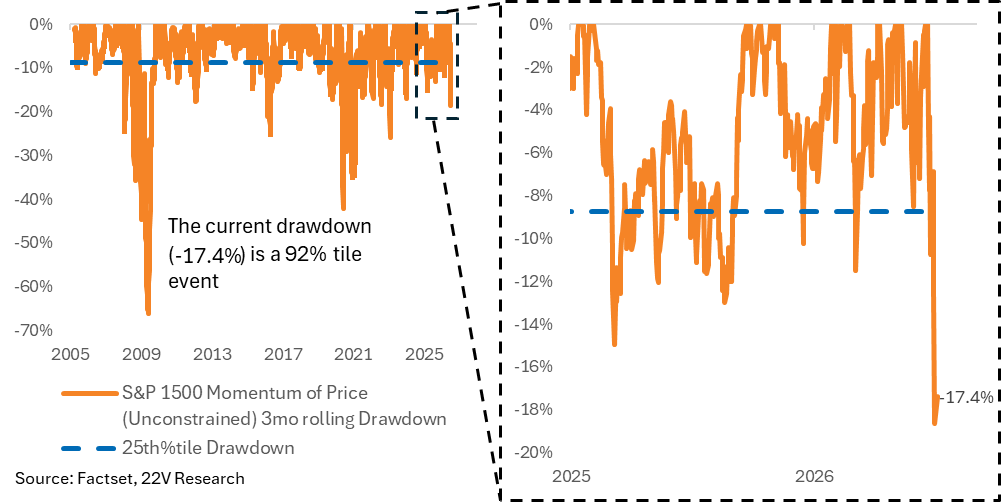
Though Price Mo returns have shown skewness historically, which could see sharp plunge in a short-term, the recently pullback for unconstrained basket remains to be a 92%th percentile move, and rarely happens outside Recessions.
For historical Price Mo drawdowns similar as today, the median forward return for the factor has been weaker than usual and turned negative on forward 1 month, 3 months and 6 months basis, even during non-recessionary periods.
A graph of a graph showing the amount of the rate of the current factor

AI-generated content may be incorrect.

That continued weakness tends to be isolated to Price Mo. The median forward return for the S&P following periods of Price Mo drawdowns tends to be stronger than for all periods, especially over the short term during non-recession periods, which is more comparable to today.
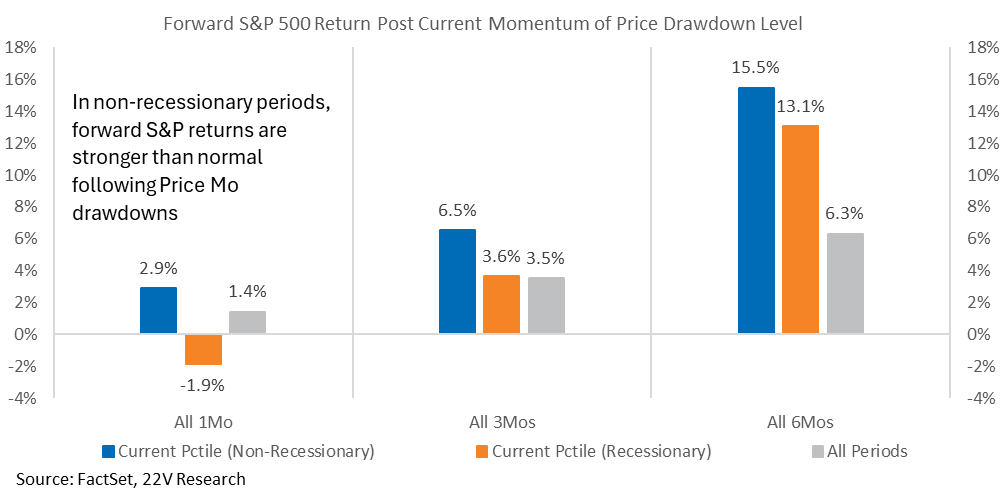
The risks to Price Mo have increased as factor volatility has reached extreme levels. The current Price Mo volatility is at its historical 97th and 93rd percentiles using a 1mo and 3mo measurement period. That has not happened outside of a recession since 2005. Although the recent correction has reduced some of the excesses in Momentum of Price, volatility remains well above its long-term median, suggesting return dispersion within the factor is still high.
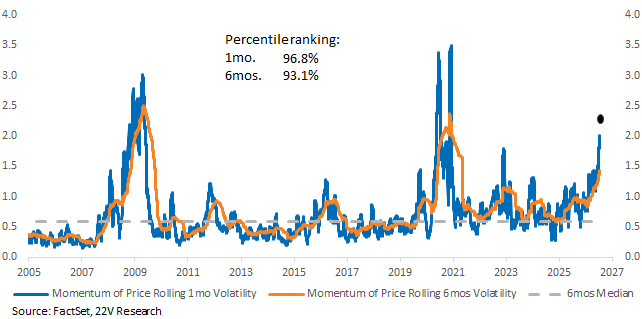
A graph of a graph with blue and orange lines

AI-generated content may be incorrect.

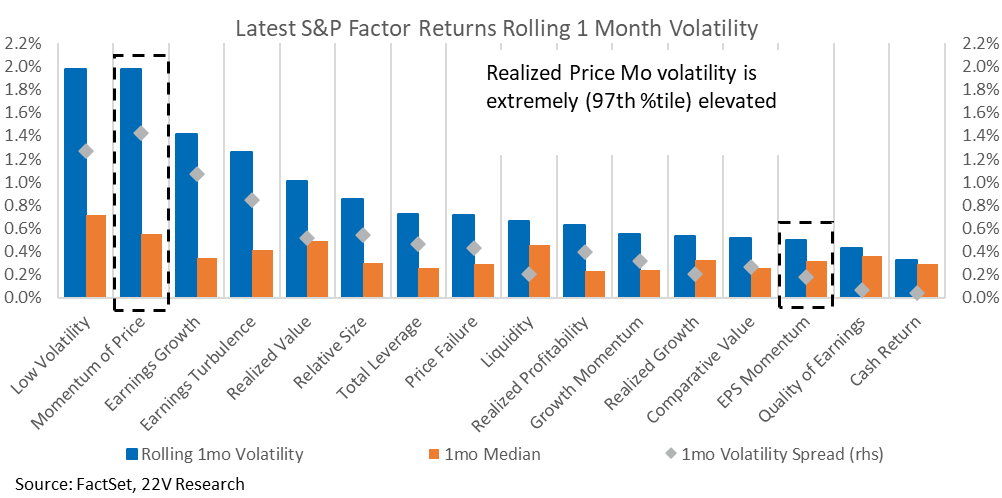
Currently, Price Mo volatility is only behind Low Volatility in terms of absolute readings, and is the largest in terms of spreads to its typical vol. By comparison, EPS Momentum volatility remains one of the lowest measured both absolutely and relative to its long-term median.
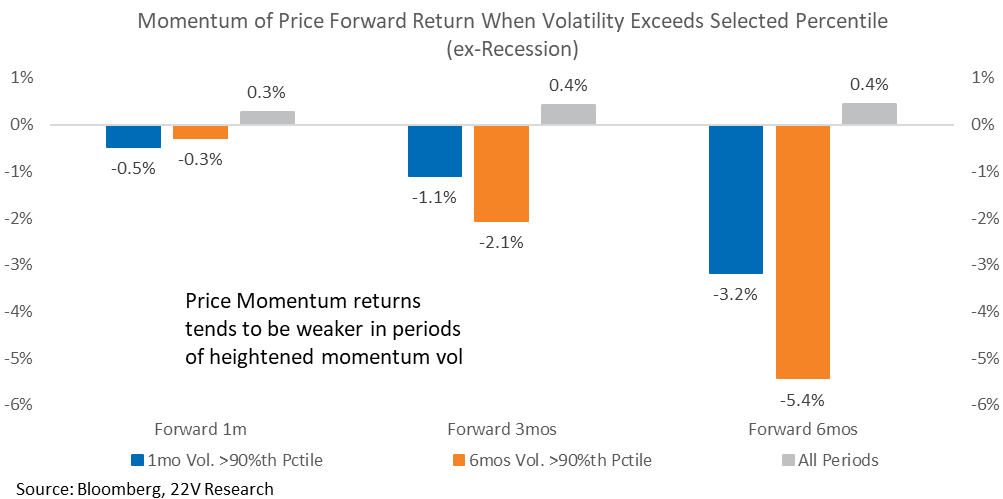
In line with factor returns post sharp drawdowns, Price Momentum median forward returns post sharp vol spikes has also been weaker than usual and performed negatively.
The S&P median forward returns 1 month after Price Momentum vol spikes have been better than all periods as well, both for recessionary and non-recessionary regimes.
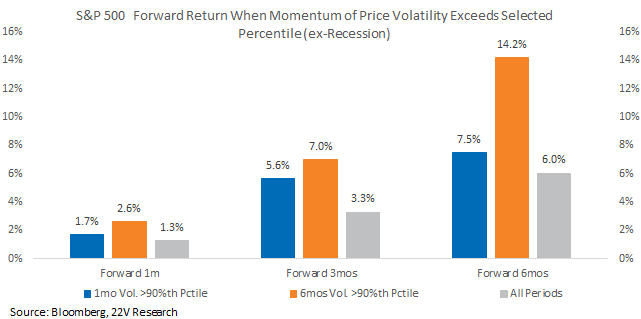
A graph of a graph with numbers and text

Description automatically generated with medium confidence

We have a tradable Swap (ticker: MS22EVPM Index), which long S&P 1500 top decile EPS Momentum and short Momentum of Price basket. The LS Swap gained 5.4% last week on Momentum of Price slump, and is expected to climb further if Momentum of Price volatility stays.
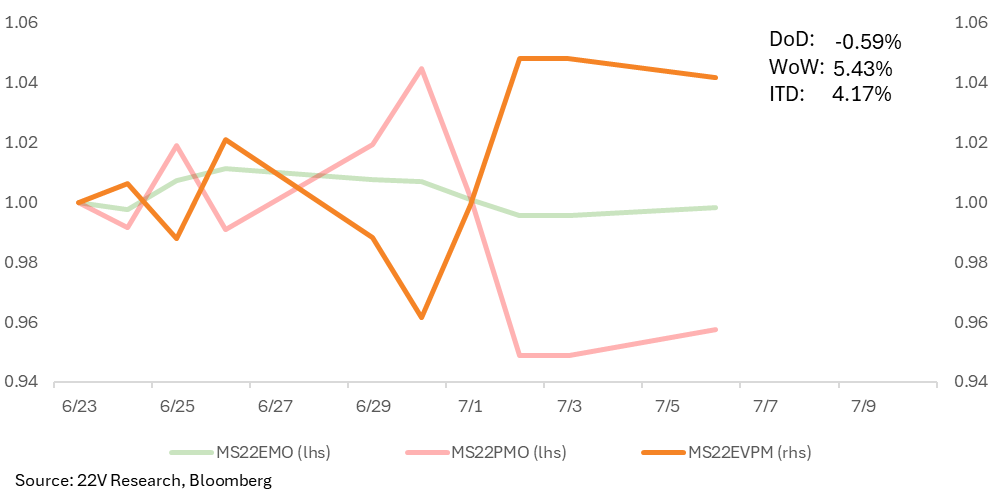
A graph of different colored lines

AI-generated content may be incorrect.

Below we list S&P 1500 names falling in top decile EPS Momentum basket, the group has a relative better outlook than Momentum of Price names.
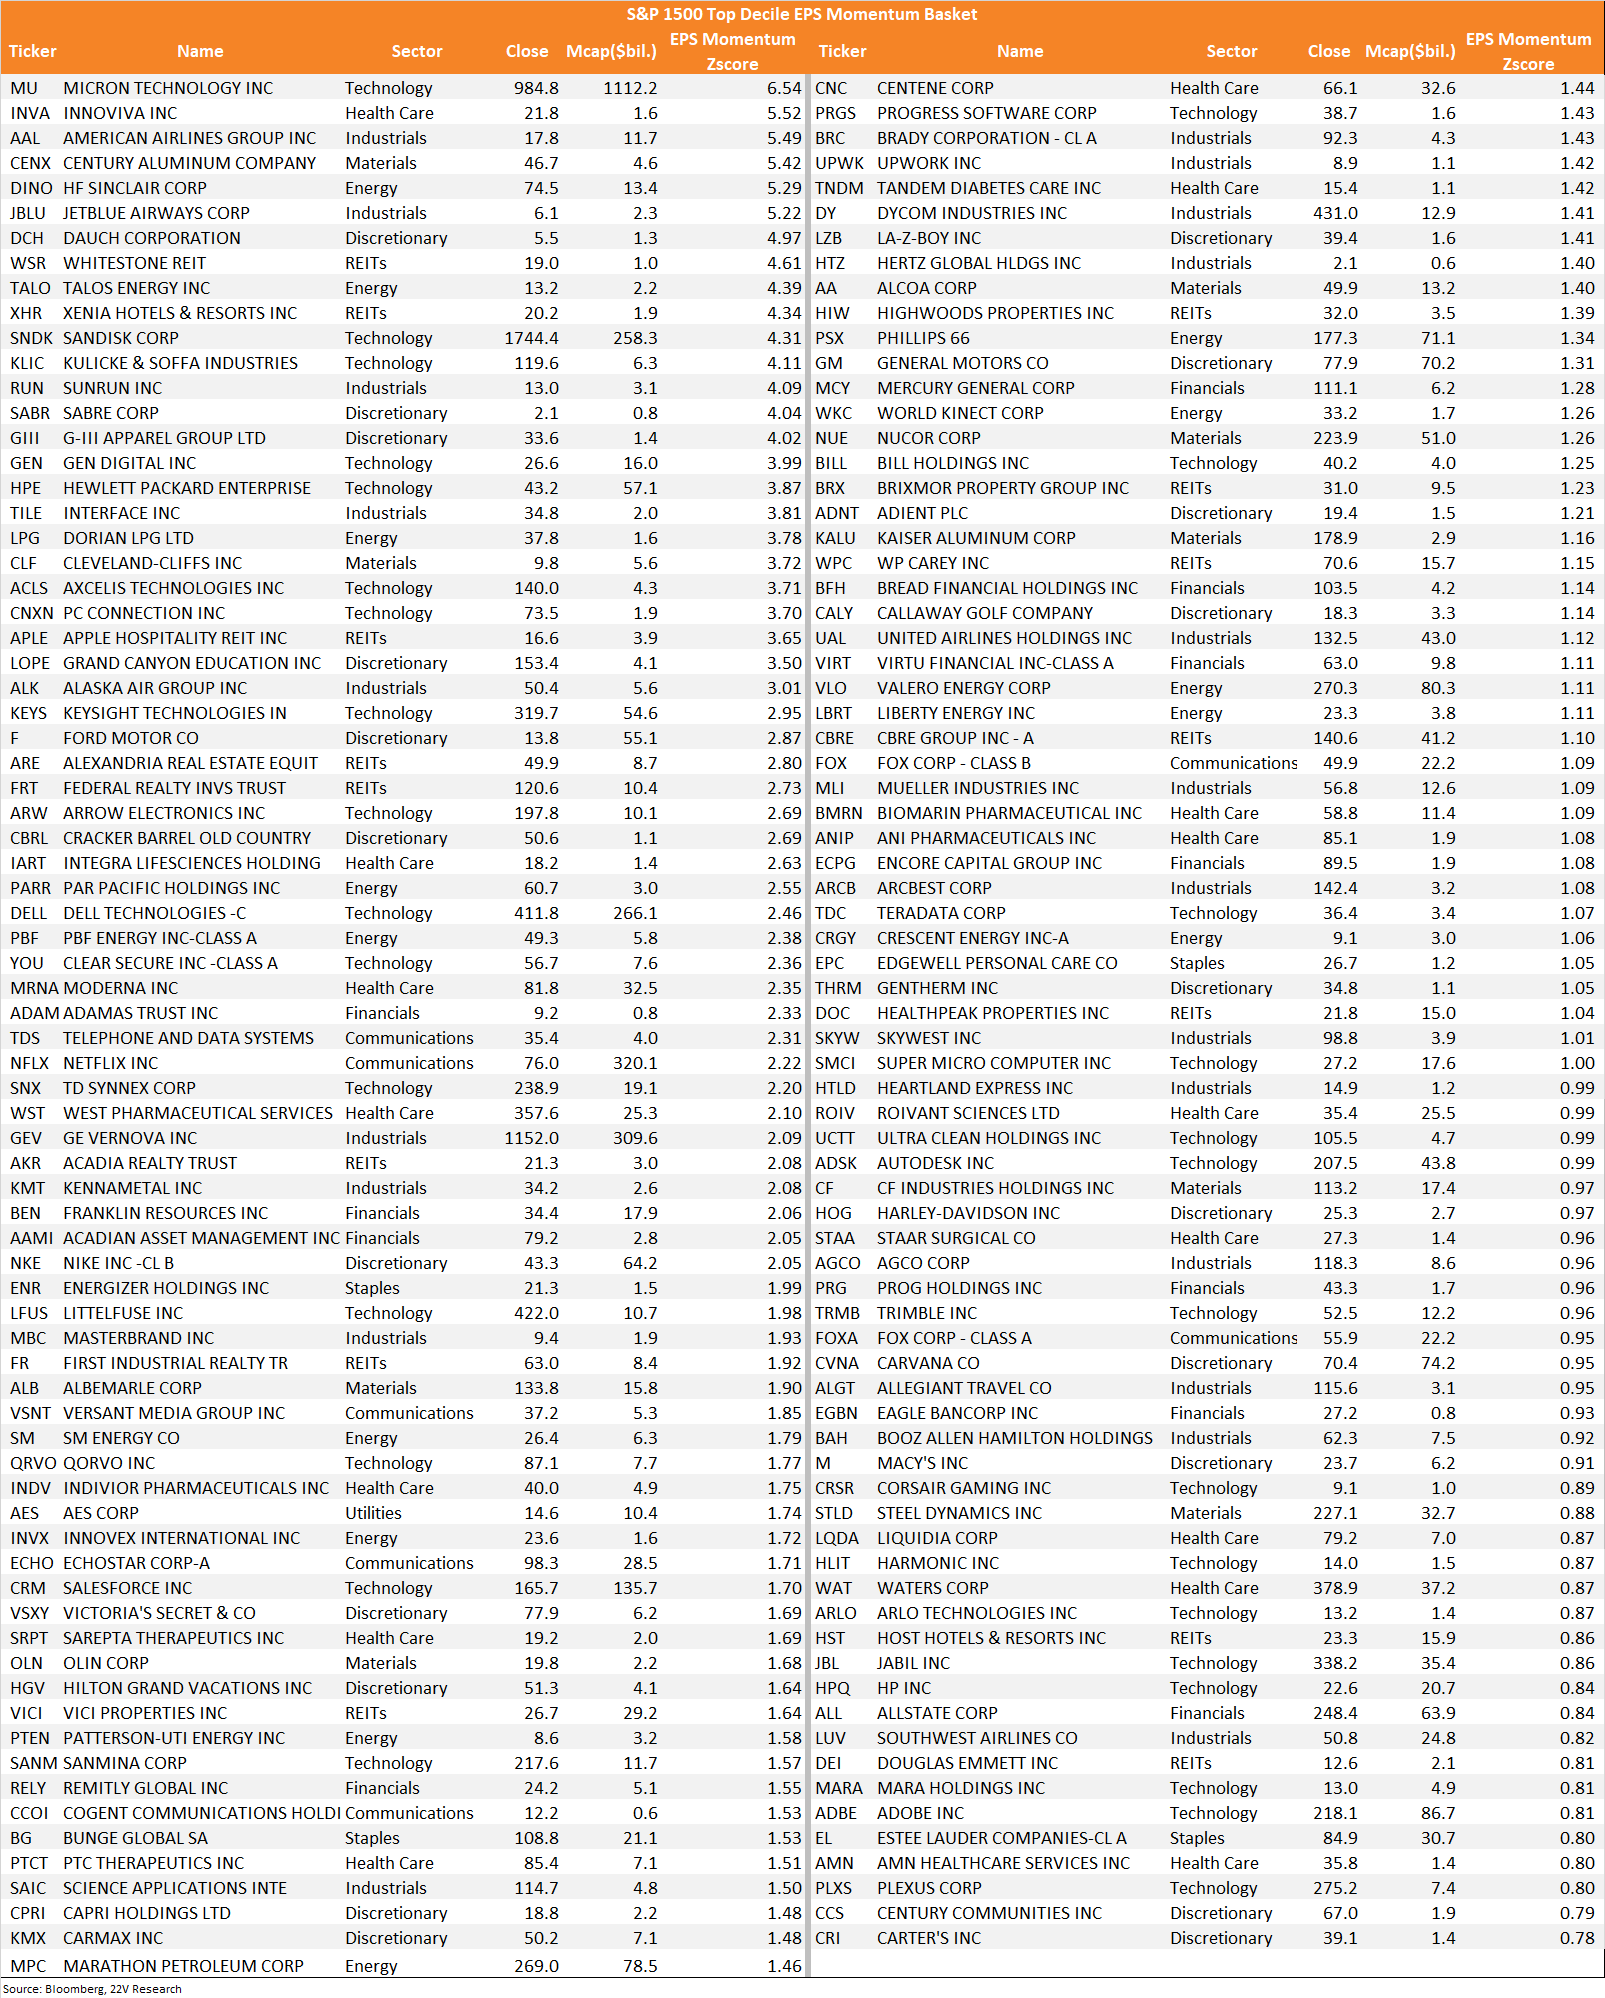
A screen shot of a computer

AI-generated content may be incorrect.

DISCLOSURES AND DISCLAIMERS

Analyst Certification

The analyst, 22V Research Group, primarily responsible for the preparation of this research report attests to the following: (1) that the views and opinions rendered in this research report reflect his or her personal views about the subject companies or issuers; and (2) that no part of the research analyst’s compensation was, is, or will be directly related to the specific recommendations or views in this research report.

Analyst Certifications and Independence of Research.

Each of the 22V Research analysts whose names appear on the front page of this report hereby certify that all the views expressed in this Report accurately reflect our personal views about any and all of the subject securities or issuers and that no part of our compensation was, is, or will be, directly or indirectly, related to the specific recommendations or views of in this Report.

22V Research (the “Company”) is an independent research provider. The Company is not a member of the FINRA or the SIPC and is not a registered broker dealer or investment adviser. 22V Research has no other regulated or unregulated business activities which conflict with its provision of independent research.

22V Research, LLC is a professional services and independent publication organization. 22V Research, LLC is not a securities broker-dealer, not a member of the Financial Industry Regulatory Authority (FINRA), not a registered investment advisor (RIA) and not a member of SIPC.

Securities transactions, when offered, are offered by 22V Securities, LLC through LPS Capital, LLC. Certain employees of 22V Securities, LLC are dually registered as securities representatives of LPS Capital, LLC or Analyst Hub Securities, LLC. 22V Securities, LPS Capital and Analyst Hub Securities are members FINRA, SIPC.

https://brokercheck.finra.org/

Current Ratings Definition.

SECTOR OUTPERFORM: An “outperform” rating anticipates the company will outperform the S&P Regional Banking Index (peer group).

SECTOR PERFORM: A “market perform” rating anticipates the company will perform in line with the S&P Regional Banking Index (peer group).

SECTOR UNDERPERFORM: An “underperform” rating anticipates the company will underperform the S&P Regional Banking Index (peer group).

Limitation Of Research And Information.

This Report has been prepared for distribution to only qualified institutional or professional clients of 22V Research Group. The contents of this Report represent the views, opinions, and analyses of its authors. The information contained herein does not constitute financial, legal, tax or any other advice. All third-party data presented herein were obtained from publicly available sources which are believed to be reliable; however, the Company makes no warranty, express or implied, concerning the accuracy or completeness of such information. In no event shall the Company be responsible or liable for the correctness of, or update to, any such material or for any damage or lost opportunities resulting from use of this data. Nothing contained in this Report or any distribution by the Company should be construed as any offer to sell, or any solicitation of an offer to buy, any security or investment. Any research or other material received should not be construed as individualized investment advice. Investment decisions should be made as part of an overall portfolio strategy and you should consult with a professional financial advisor, legal and tax advisor prior to making any investment decision. 22V Research Group shall not be liable for any direct or indirect, incidental or consequential loss or damage (including loss of profits, revenue or goodwill) arising from any investment decisions based on information or research obtained from 22V Research Group.

Reproduction And Distribution Strictly Prohibited.

No user of this Report may reproduce, modify, copy, distribute, sell, resell, transmit, transfer, license, assign or publish the Report itself or any information contained therein. Notwithstanding the foregoing, clients with access to working models are permitted to alter or modify the information contained therein, provided that it is solely for such client’s own use. This Report is not intended to be available or distributed for any purpose that would be deemed unlawful or otherwise prohibited by any local, state, national or international laws or regulations or would otherwise subject the Company to registration or regulation of any kind within such jurisdiction.

Copyrights, Trademarks, Intellectual Property.

22V Research Group, and any logos or marks included in this Report are proprietary materials. The use of such terms and logos and marks without the express written consent of 22V Research Group is strictly prohibited. The copyright in the pages or in the screens of the Report, and in the information and material therein, is proprietary material owned by 22V Research Group unless otherwise indicated. The unauthorized use of any material on this Report may violate numerous statutes, regulations and laws, including, but not limited to, copyright, trademark, trade secret or patent laws.
