SUMMARY –Important Report, Please Take a Look: Recent Fed speak has been consistent with no cut in May. GS shifting their call to 4 from 5 cuts is getting a lot of attention (HERE). The market is already there though, so Fed futures have not moved much. The question now is if June will be taken off the table or not. There is plenty of data between now and then, with payrolls on 3/8 the next big rate moving release.
Peter’s Williams view is “that the inflation data continuing to be ‘good enough’ is what will allow the Fed to begin cutting” but the depth of the cuts will be driven by activity data. We have been harping on this point all year. 6+ cuts was not going to happen in our 2-2.5% GDP growth forecast (see 2024 Outlook here). Our call has consistently been 3-4 cuts with 2-2.5% Real GDP growth and that is fine for risk assets. The greater risk being 0 cuts, because economic growth and inflation is too strong vs 6+ because economic growth was too weak. Recall, consensus thought growth being too weak was the biggest risk to markets to start the year (HERE).
Our call for 3-4 cuts is basically priced in now, which is great for risk IF THAT PLAY OUT. But what happens if markets start pricing FEWER than 3 cuts? No cuts? The focus should be on “why” the Fed is cutting NOT the number of cuts. There are no cut scenarios that are okay for risk assets and ones that are not. Two scenarios under that framework stand out.
The Ok 0-2 Cuts Scenario: If economic growth is firm, and inflation is not going to be as close to 2.3% by year end. This is not a problem if Core PCE is around 2.7% and higher rates are REQUIRED to keep inflation in check. That backdrop doesn’t mean higher recession risks or lower asset prices. This is the scenario playing out NOW and why financial conditions haven’t tightened. Investors adjusting to inflation and growth moving lower more slowly than previously thought. If a 5.3% funds rate is not as restrictive as we thought markets do OK, but volatility will be higher and the potential overhang from higher rates are a headwind for leveraged/small cap/Earnings Turbulence names (see our Small Cap Survey HERE). FYI – that overhang should fade if 4.5% 10yr yields do not crush to the economy.
The Bad 0 Cut Scenario: Forecasters become more confident core PCE will move back above 3% (wages stay too firm and goods inflation subsides. See Peter Williams talk about this risk HERE). If that happens, the Fed will need to tighten FCI again to slow growth more quickly. That is bad for risk assets and means higher medium term recession risks. Bottom line, the major problem for markets is >3% core PCE and the Fed making it explicit they want slower economic growth.

Bottom Line: Knowing the number of cuts doesn’t help with market calls (headline or internal) unless we also know the WHY. Fed officials are pushing back on cuts now because growth is firm. That is not bad for risk assets, and it explains why financial conditions have not tightened. If Core PCE forecasts move above 3%, that is a major problem for risk assets. FCI would likely tighten.
We close the report out by highlighting John Roque’s work on global indices, since the rapid pace of the S&P rally to start the year is hard to sustain and we think some consolidation (doesn’t mean a correction) should be expected. We also dig more deeply into the small cap survey from yesterday. Interesting results.
Full report below…
MARKET VIEWS: Fed Governor Waller said policy makers need “at least another couple more months” of data to warrant interest rate cuts, and said he sees “predominately upside risks” to inflation. Waller, Jefferson, and other Fed speakers have been impressed by economic strength. Above trend GDP growth (above 2-2.5%) means less cuts, which Peter Williams and Gerard have been all over.
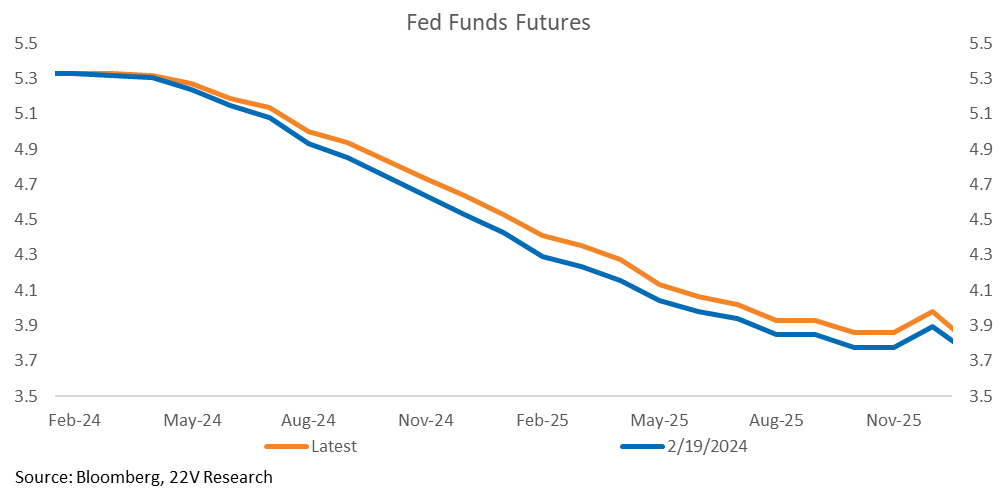
The focus should be on “why” vs the mechanics of how many rate cuts. There are two scenarios. 1) The Fed does not cut because economic growth is firm, and inflation is not going to be as close to 2.3% by the end of the year as the Fed forecasted. This is not a problem if core PCE is around 2.7%. 10yr yields at higher levels and a stable fed funds rate is REQUIRED to keep inflation in check under this scenario. That does not drive recession risks much higher or imply much lower asset prices.
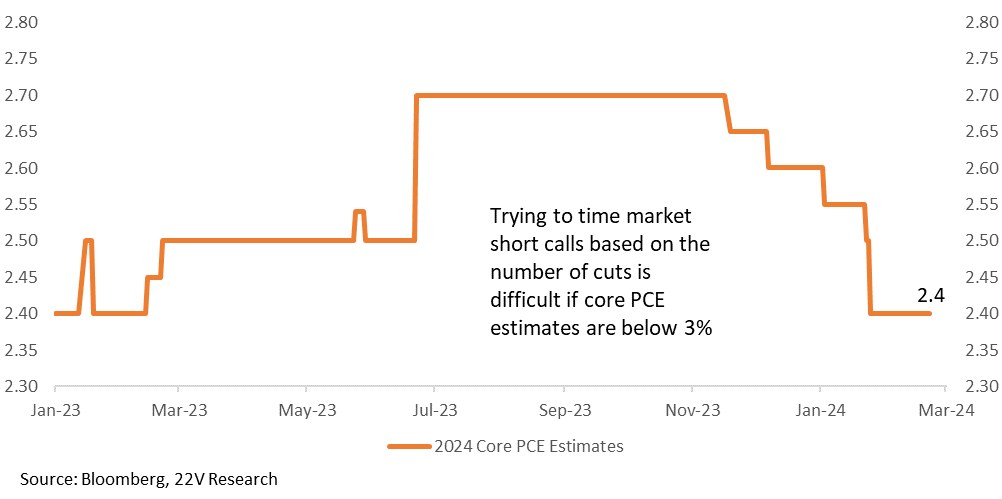
2) Core inflation is estimated to remain above 3% (wages stay too firm and goods inflation subsides). In this case, the Fed likely needs to tighten FCI again, which is bad for risk assets. Trying to time market short calls based on the number of cuts is REALLY hard if core PCE estimates are going to be below 3%. The major problems for asset prices come with >3% core PCE and the Fed making it explicit they want economic growth to slow.
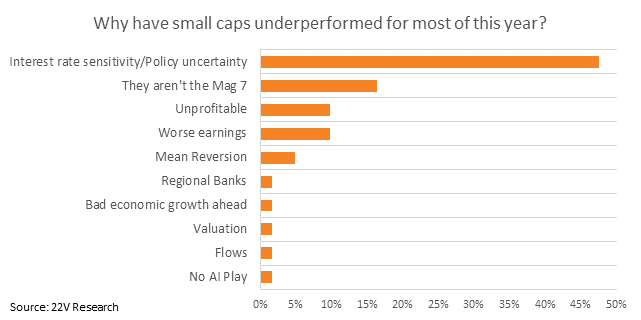
SMALL CAPS: This week we ran a survey on small caps (full results HERE). A majority (62%) of our survey respondents expect small caps to outperform the S&P through the rest of the year. That is a ‘surprisingly popular’ response; 44% of our survey respondents thought other respondents would expect small caps to underperform. Only 25% actually do. We also surveyed clients about why small caps have underperformed to start the year. The general consensus is that since small caps are less profitable (or unprofitable) and need debt to grow, they are more sensitive to higher borrowing costs. Vol is introduced through policy uncertainty.
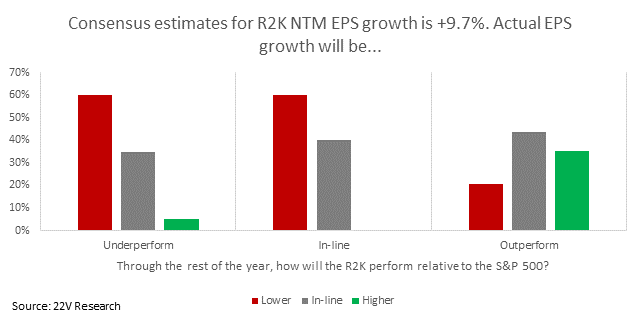
The cohort that expects small caps to outperform the rest of the year has a more optimistic outlook on fundamentals than the cohorts that expect in-line or underperformance. That’s not surprising, but there is still a group that thinks small cap earnings will disappoint but small caps will outperform. That speaks to the intense valuation gap between small and large caps that we have been writing about (latest HERE).
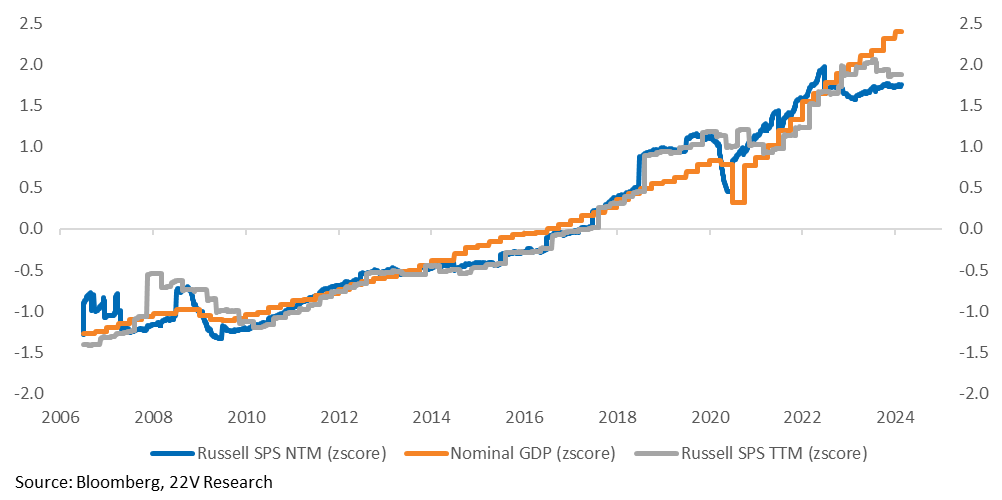
The forward sales outlook for small caps has lagged nominal GDP growth. Trailing sales too. The gap is atypical, and we expect some closing of the gap if the normal expansionary economic backdrop continues, which is still our base case. Higher rates may very well be a headwind, but the sales outlook should improve as macro uncertainty fades. Also, the market has already priced out ~3 cuts this year. Futures indicate 3-4 cuts, not 6.
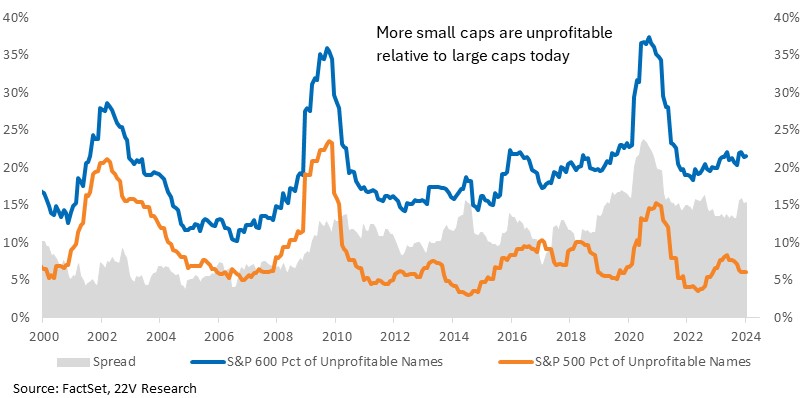
The share of unprofitable names within small caps has risen relative to the share of unprofitable within large. The quant team detailed how applying a simple profitability filter on small caps improves risk adjusted returns. Focusing on profitable small caps also helps mitigate macro risks. The betas of the profitable basket relative to macro indicators are all lower on an absolute basis compared to the unprofitable group. More details are in the quant report HERE and a full list of the names is available by emailing us.
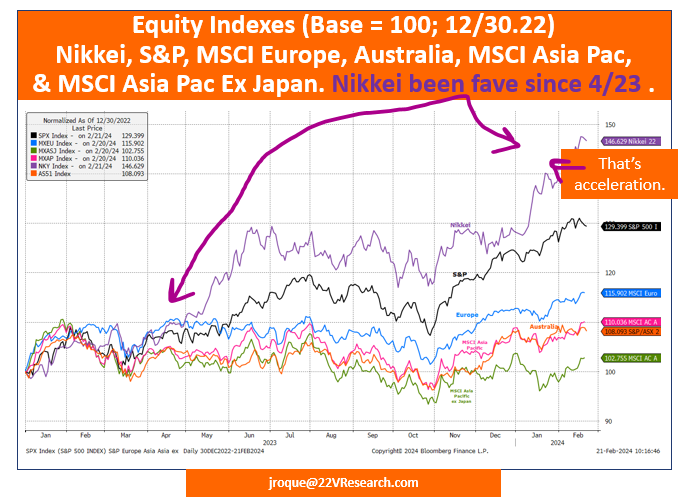
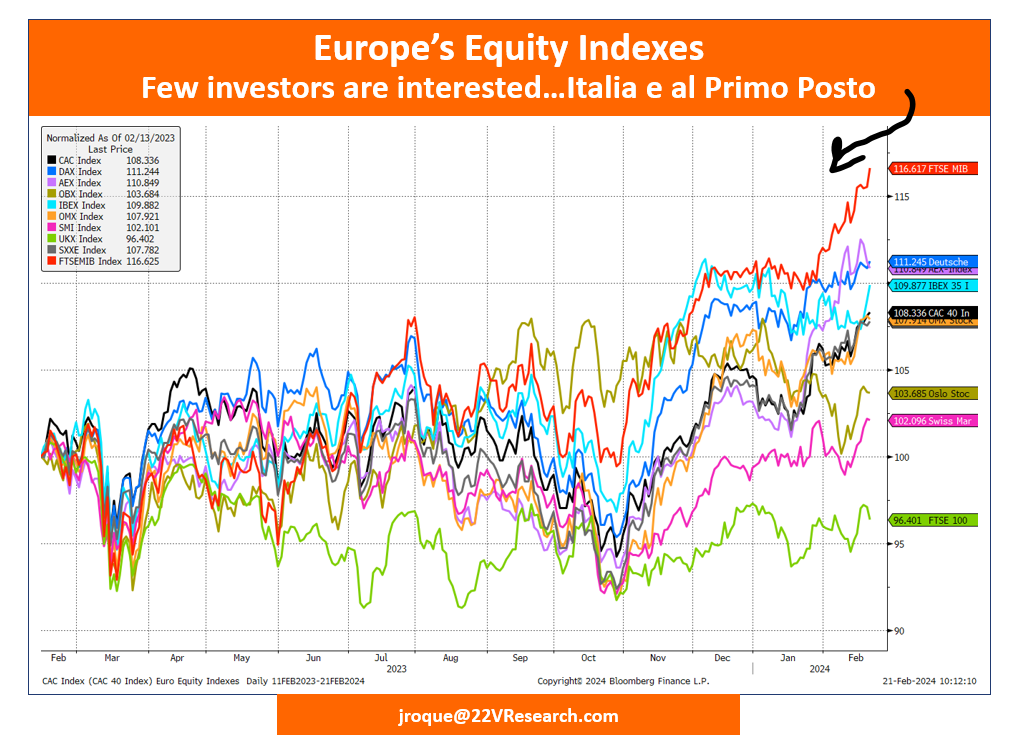
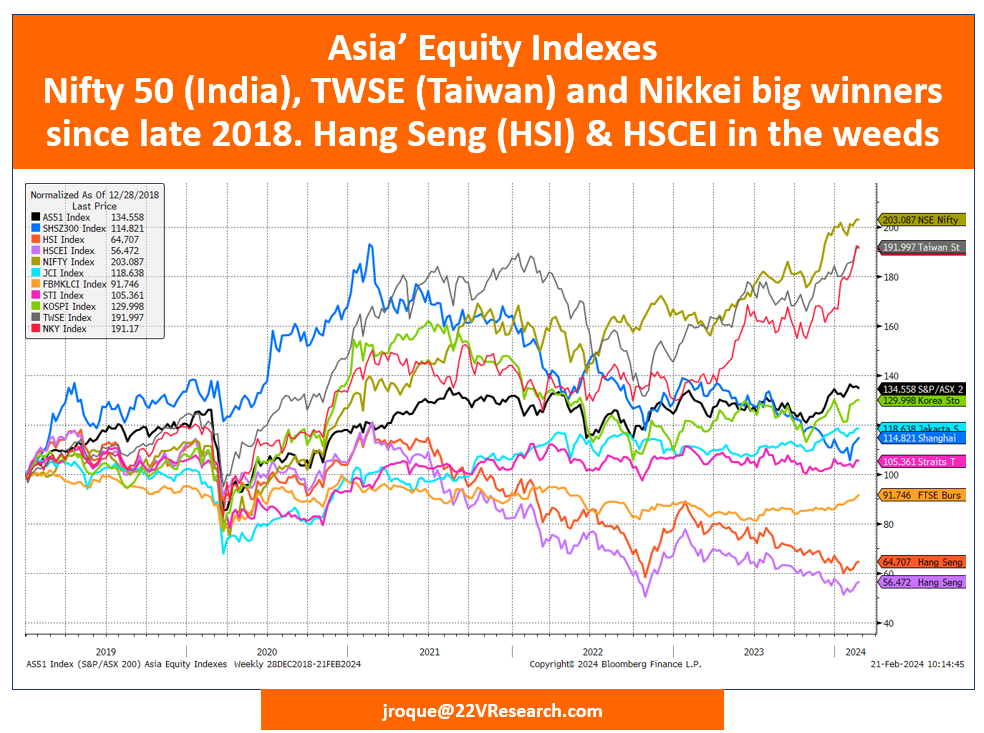
GLOBAL MARKETS: As we noted (HERE), the rapid pace of the S&P rally to start the year is hard to sustain and some consolidation should be expected. 22V Technician John Roque has some global markets that he likes and has been watching. John believes that there are – and have been for some time (a la Japan and India) – other markets that offer investors alternatives to the US. These markets include Japan, France, Germany, Italy, Spain, India, Australia, and Taiwan (charts below).