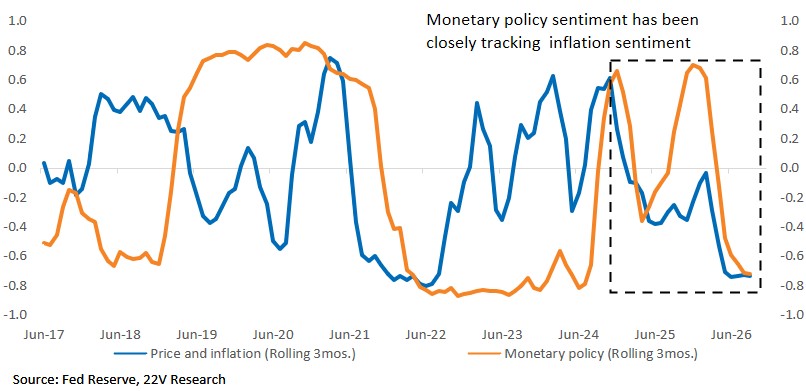
DAILY STRATEGY: Main Point – As we have noted over the weekend (HERE), reasonably hawkish outcomes (4.5% peak fed funds rate) are priced. We don’t expect much increase in the 10yr yield FROM HERE. If UST yields remain around the current range (4.8-5%), that will likely apply some restraint to economic growth over time. Accomplishing the goal of lowering inflation.
The Fed hiking and 10yr yields could lead to some relief in risk assets. Especially the non-AI related cyclicals that have lagged aggressively over the last month. We would be hesitant to chase a short-term rally in Consumer, Transports and Homebuilders beyond a few days. Given increasing Fed rhetoric around the need to bring inflation much closer to target over an acceptable medium-term (12-24 months) and as Peter Williams pointed out (HERE) the actual risks to the policy rate remain right tailed versus the Fed’s and markets baseline.
As we have shown quantitatively (HERE), there is increasingly close relationship between Inflation sentiment and Monetary Policy sentiment (based on what FOMC members are saying). Both are now near the low end of their historical ranges (low = hawkish), suggesting persistent above-target inflation is exerting greater influence on the Fed’s policy reaction function.
Bottom line – We think 10yr yields around current levels will be enough or slow GDP growth and inflation. That will ultimately be positive for risk assets as investors discount a longer economic cycle. But we can’t be sure the current level of interest rates will do the job.
Consumer & Gasoline Prices – As Gerard pointed out over the weekend, there was a reasonable hit to income during the second quarter. But the hit to real income fades, rather than intensifies, from here. Even with the current level of oil/ gasoline prices. The simple reason is as nominal personal income continues to grow and energy costs stop accelerating (or accelerate less), the sequential drag on real income growth fades. Do not expect a sharp slowing in consumer spending all things equal. This reinforces the idea that Fed will respond to inflation and worry less about hiking into a supply shock. As Warsh himself has said, he doesn’t want repeated shocks treated as permanent excuse for above target inflation.
Consumer Trends and Productivity – Small cap Consumer Services is +3.9% YTD relative to the S&P 1500 while large and midcaps are both down more than 20% relatively, a 24% spread driven almost entirely by stock-specific residuals than industry or factor exposures. BoA’s credit card data shows growth concentrated in independent and regional operators rather than national chains, and our attribution confirms it.
Related to the above, as Dietrech Volrath, productivity expert we interviewed a few months ago (HERE), noted. Wealth from productivity gains creates demand for lower productivity industries. Dietrich illustrates what he calls the ‘artisanal economy’ where people are creating bespoke goods and services. For example, a locally made dining room table rather than a mass-produced (but highly productive) table. This leads to more spending at niche businesses vs. mass produced items or services. When the consumer names rebound, small cap niche operators are a long.
Fed Meeting Assumptions – 22V Economist Peter Williams expects a 25bp hike this week and another 25bp hike later this year. The FOMC meeting will release a new Summary of Economic projections (SEP). We expect the SEP will show 2 hikes for 2026. Consistent with the logic to hike 2X before year-end, the 2026 real GDP growth projection will be increased from 2.2% to 2.3%, and the unemployment rate lowered from 4.3% to 4.1%. Peter expects the 2026 Core PCE forecast to remain at 3.3%, but the risk is that it increases.
Charts and text…
Weak inflation sentiment is consistent with too high core PCE. In contrast, unemployment remains near the low end of its normalized historical range, with the latest labor data continuing to point to a resilient labor market.
As Gerard noted, there was a reasonable income hit during the second quarter, which is clearly visible in official data, with no simulations required. Some of that hit may be cutting in real PCE right now. But on these calculations, the hit fades rather than intensifies, from here.
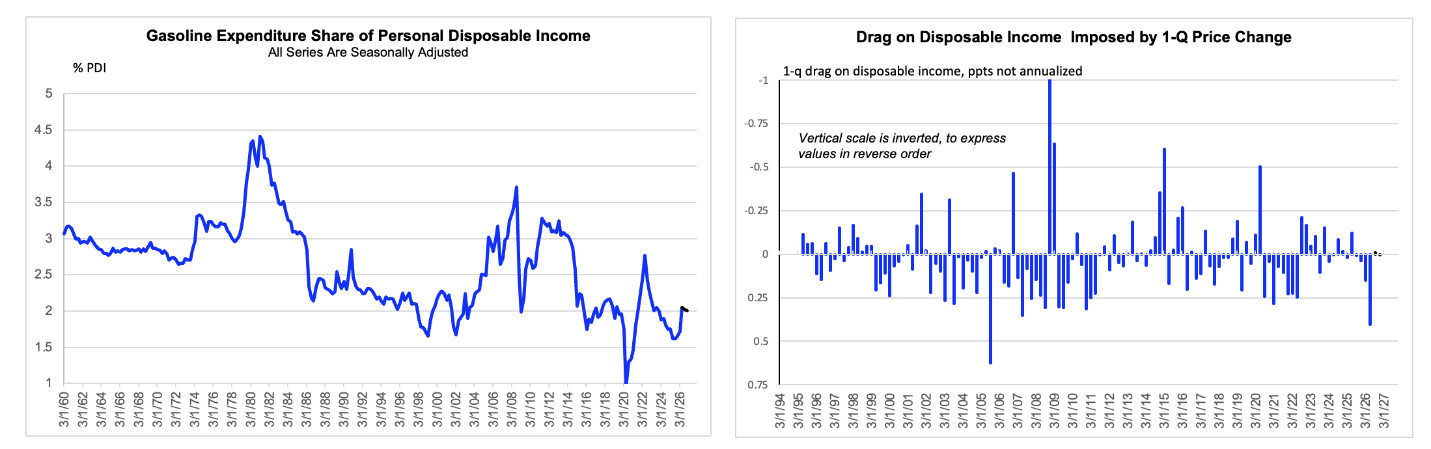
Source: BEA, FH calculations and simulations
Data are actual to Q2 and simulated to Q4. The effect in H2 is so small that it is not really visible on the chart, although it is there.
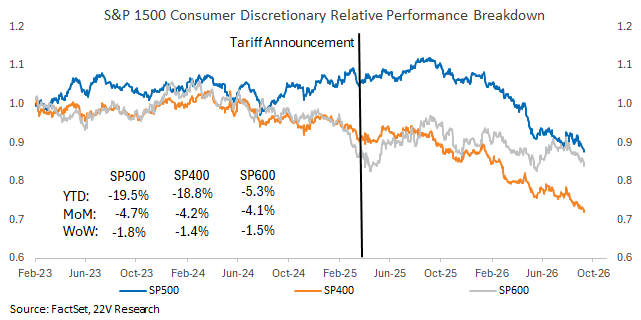
BoA’s card data shows growth concentrated in independent and regional operators rather than national chains, and our attribution confirms it — small cap Consumer Services is +3.9% YTD relative to the S&P 1500 while large and midcaps are both down more than 20% relatively, a 24% spread driven almost entirely by stock-specific residual than industry or factor exposure.
Extending BofA’s restaurant findings to the whole Discretionary sector produces the same conclusion. Large-cap Discretionary is the worst-performing cohort on every horizon for YTD, MoM and WoW, while the S&P 600 shows a far milder drawdown. The S&P 500’s advantage over the S&P 600 peaked immediately after the tariff announcement and has compressed materially through 2Q26.
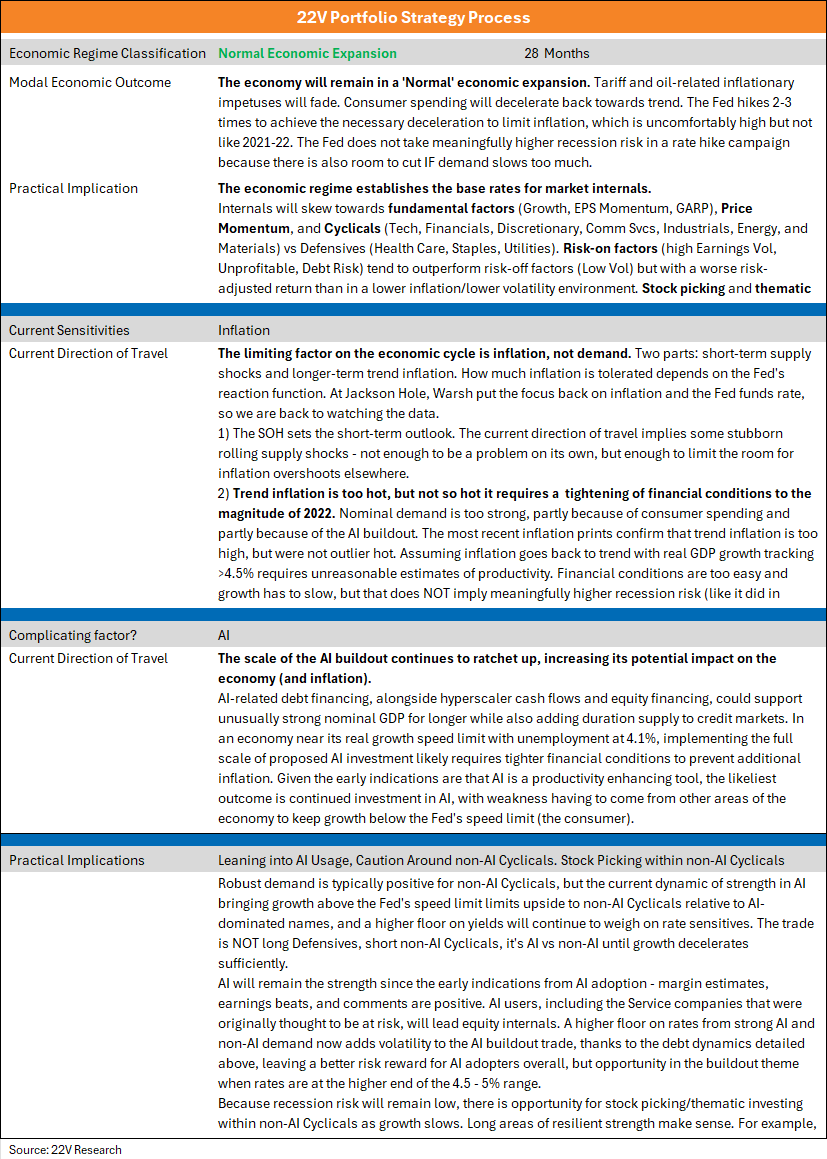
OUR PROCESS: The first note of the week focuses on our overall process. The below graphic details the medium to longer-term views (6+ months) for equity internals based on the current economic backdrop, the modal outcome for that backdrop, and the sensitivities of the backdrop. When we mark to market our views based on new market and macro data, and talk about short-term risk management, it is always relative to what our background process implies.