Weekly – Need to Respect the Economic Speed Limit – Real GDP growth remains well above the economy’s estimated ~2% “speed limit,” and much stronger than we expected. Strong growth has been a problem for some of our calls. As a reminder, the economic speed limit is the maximum rate real GDP can expand without driving core inflation above the Federal Reserve’s 2% target. A combination of strong consumer spending and accelerating AI-related capital expenditures are keeping economic growth well above 2%. At a time when the labor market is tightening and core inflation is WELL ABOVE the Fed’s 2% target.
The implication is that economic and labor market strength show up through a more restrictive Fed path OR higher 10year yields. It does not show up in higher equity prices. The correlation between bond yields and stocks is deeply negative as a result. Slower GDP growth would be helpful for multiples.
We are still constructive on equities over the cycle as EPS growth is unusually strong. Inflation is not so far away from target that the Fed needs to ratchet back demand growth. Inflation starting to realize closer to the Fed’s target in a durable and sustainable way, which is what we expect given current level of 10yr yields, will allow the cyclical rebound and current strong earnings trends to continue.
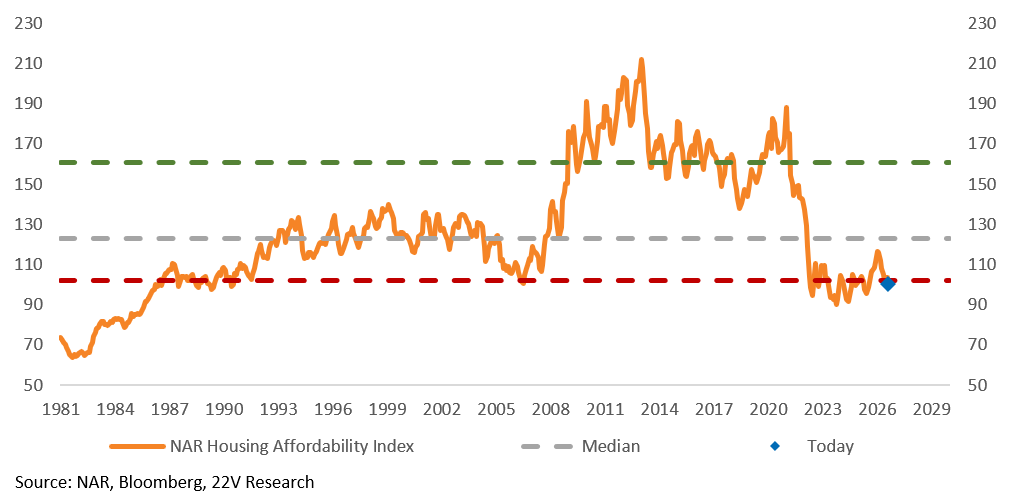
Most of the Near-Term Damage In Bonds (Yields Higher) Has Happened – We would not expect a meaningful move higher in UST yields from here. Reasonable hawkish outcomes (4.5% peak fed funds rate) are priced. If UST yields remain around the current range (4.8-5%), that will likely apply some restraint to economic growth over time. Accomplishing the goal of lowering growth / inflation. 30yr mortgage rates close to 7% and housing affordability at its 15th %tile historically should put further downward pressure on housing demand and overall consumer spending.
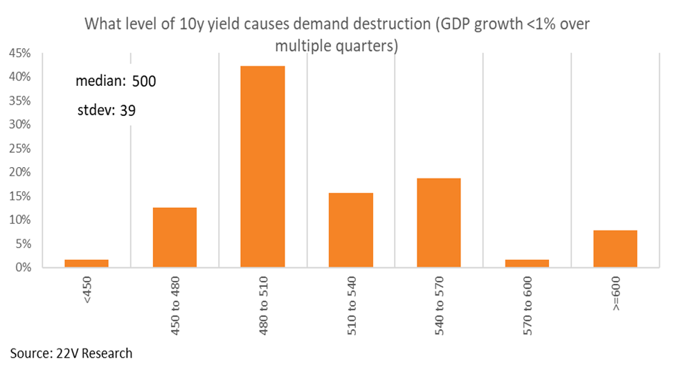
FYI – A ~5% 10yr yield is the level where investors believe demand destruction sets in according to our surveys. If the current level of 10yr yields successfully lowers economic growth, LONGER TERM (1Q or 2Q 2027?) options trades that benefit from lower 10yr yields (Homebuilder stocks as an example) could be interesting.
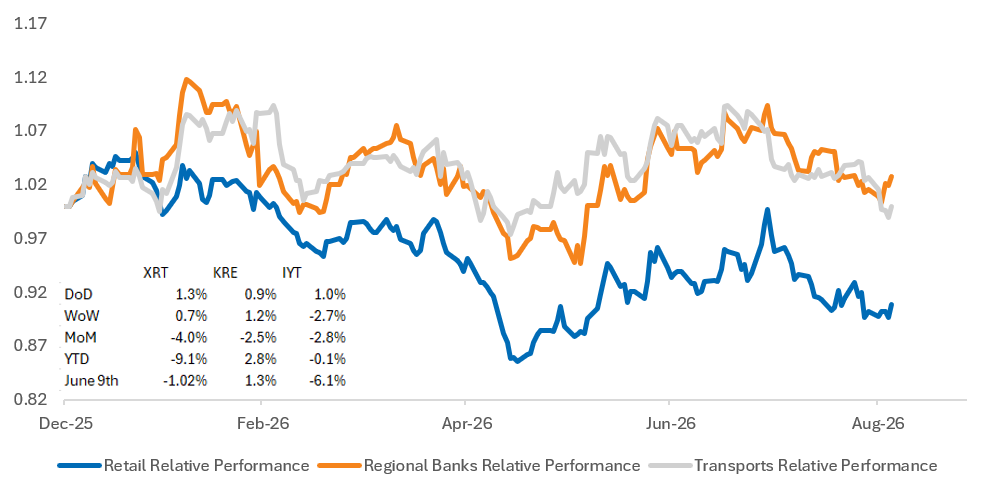
Because AI investment is unlikely to slow over the next two years, the bulk of the economic slowing needed to reduce inflation is likely to come from the consumer, requiring spending growth to downshift from 2.5%+ toward 1–1.5% range. That is a headwind for Non-AI related Cyclicals (Retail, Transports and Housing in particular). That is a group we had been favoring, but that call has been wrong. We will look to reengage with Non-AI related Cyclicals after the economy slows. Or if Oil, Gasoline and Deisel prices move significantly lower.
AI capex holding up as the rest of the economy slows some favors the AI buildout names on a relative basis. Or companies that are less cyclical and using AI to increase margins/profits (software). Price Momentum, AI buildout names, EPS Momentum and the Cash Return factor will continue to outperform.
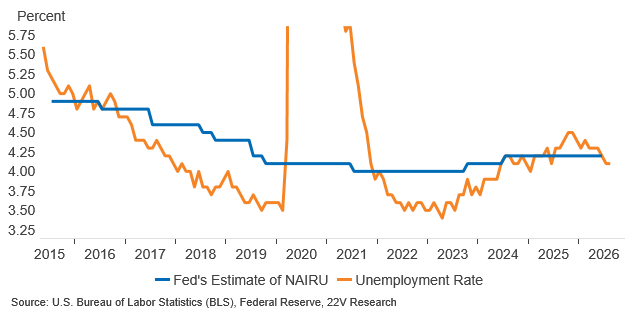
Longer Term – It’s counterintuitive, but a NON-RECESSIONARY increase in the unemployment rate would be CONSTRUCTIVE for equities. The unemployment rate increased in 2025 and S&P 500 multiples expanded. The unemployment rate is moving lower in 2026 and PEs contracting. FYI, if the unemployment rate were to increase, the speed limit for economic growth would increase. Gerard and I cover this more in a video HERE.
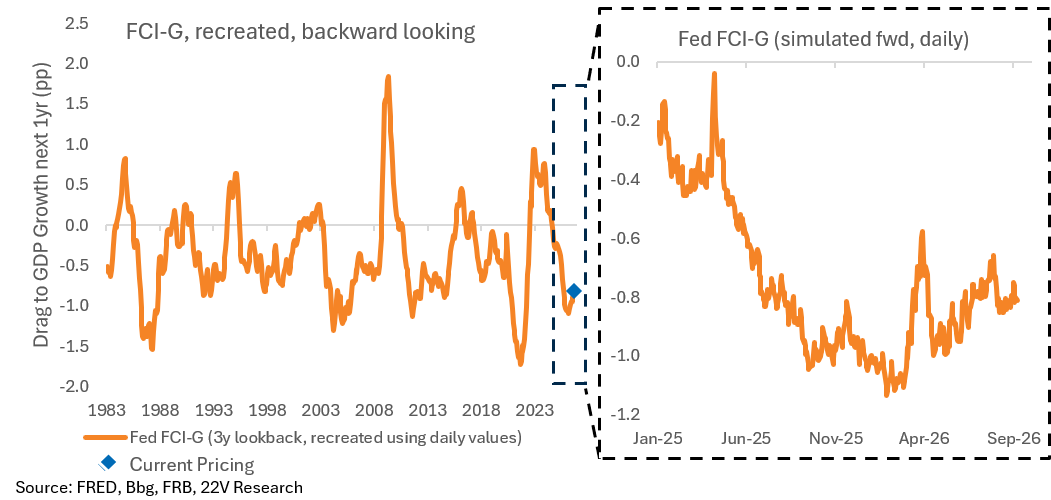
At Jackson Hole Warsh said, “I would be hard pressed to describe broad financial conditions as restrictive.” The recent data has more than reinforced that statement.
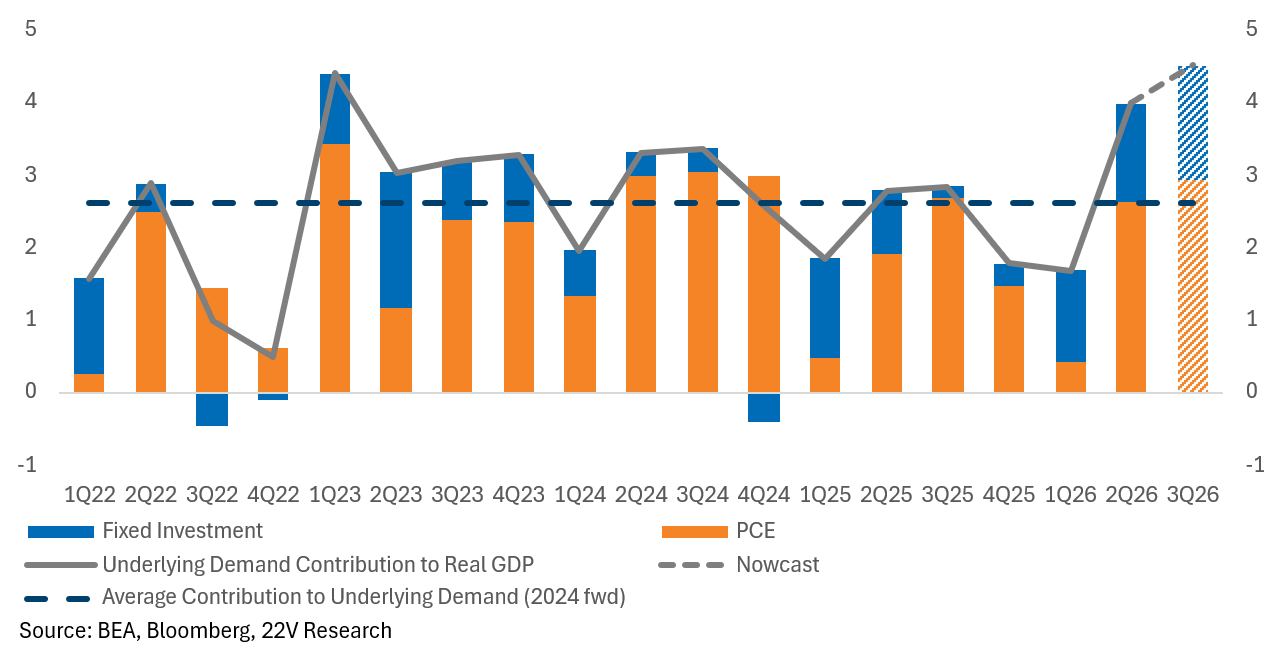
Data Facts – Atlanta FedGDPNow is running at 4.6% for 3Q. Real consumer spending has stayed stronger for longer than anticipated, continuing to run at a +2.5%. The sum of private investment (AI capex) and consumer spending is estimated to be 4.5% ALONE in 3Q. After running at +4% in 2Q. That implies very strong GDP growth if sustained. Estimates for 2027 total capex is $1.26 Trillion (+44.8% YoY) and 2028 total capex is projected at $1.4 Trillion (+19.1% YoY). SemiAnalysis estimates that total Cumulative AI Investment could be ~$12 Trillion in total financing (debt + equity + cash flows) through 2030! AI’s contribution to GDP growth is likely to remain strong.
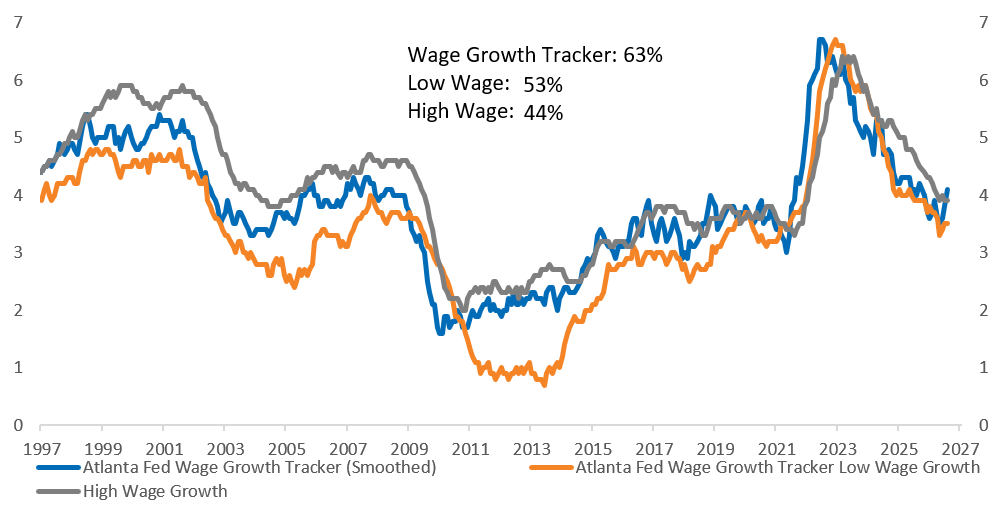
On inflation, it was the second hottest print of the year for CPI core services ex housing and core CPI ex shelter and used autos. The Atlanta Fed’s wage growth measure increased from 3.8% to 4.1% MoM! Wage growth is increasing as the labor market remains at full employment and consumer spending is strong.
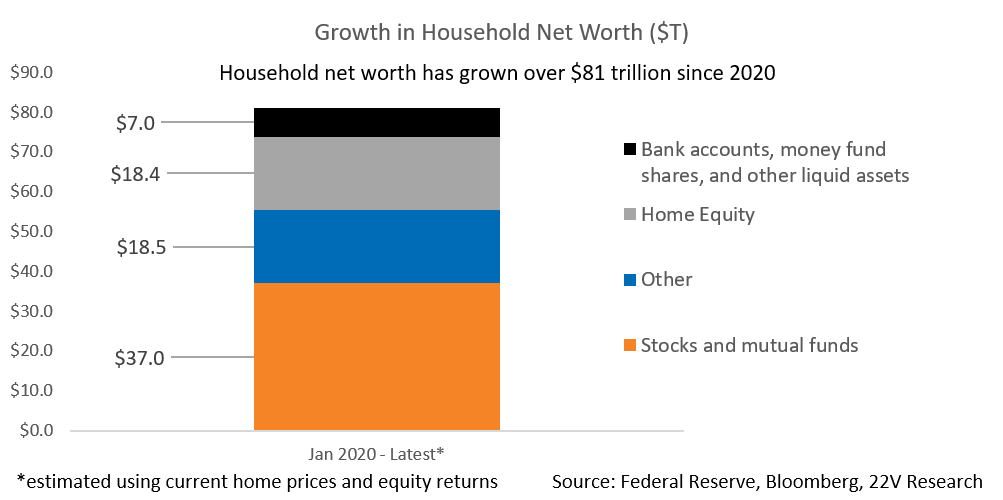
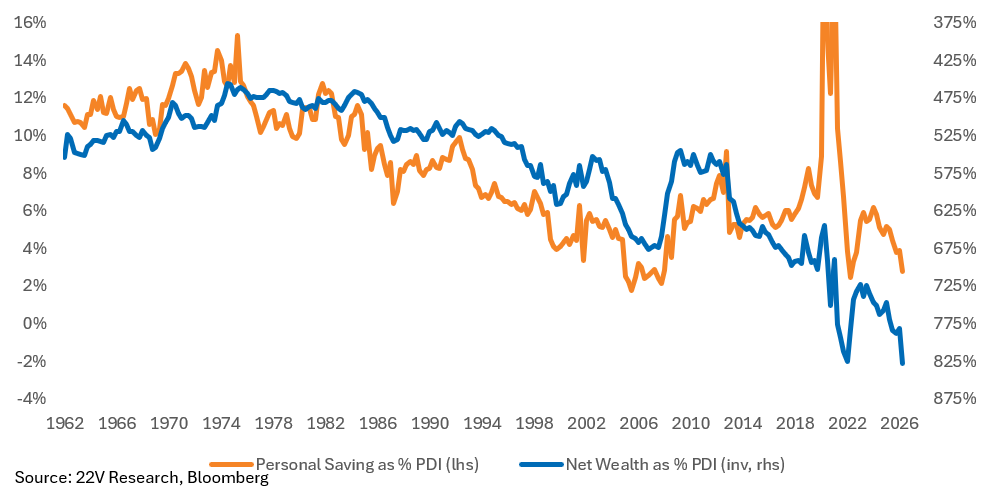
On Friday we learned that consumer net worth increased $12.8 trillion in 2Q alone! The continued surge in consumer net worth supports a lower savings rate. That lower savings rate has supported consumer spending. FYI – the net worth data is leading to some investor fears that rates need to get to a place that crushes equities to lower consumer net worth/spending.
Marking to Market Investable Themes – Risk-on Factors have outperformed Risk-off Factors (MS22RISK on Bloomberg) since we went long on August 4th. Risk-on factors are still outperforming risk-off and will benefit as both Momentum and Value should still outperform. We would have thought that risk-off factors would have outperformed more as 10yr yields increased to 4.9%. 10yr yields remaining around current levels and economic expansion continuing still favors risk-on factors. Cyclicals outperformed Defensives last week. It’s more about the type of Cyclical not working (consumer).
We Are Long The AI Buildout/High AI Usage Goods Basket: The main reason for being long both the AI Buildout (AI Goods: Semis, Power, Cooling) and the AI Services basket (AI Users / Adopters) is the emerging evidence that AI is acting as an economy-wide productivity and profitability enhancer. Rather than a zero-sum trade where buildout beneficiaries win at the expense of disrupted service companies, both baskets reinforce and propel each other through a virtuous feedback loop. Margins and Earnings for both baskets are increasing as other areas of the market (non AI related Cyclicals) struggle.
Charts and indicators below…
The economy is growing at a pace that is too strong. The consumer is likely to lead a slowdown. Growth would likely remain too strong. The strength of the labor market tilts in the direction of financial conditions needing to be a bit more restrictive
Household net worth has SURGED since COVID. Firm household net worth helps support spending through a lower savings rate.
Atlanta Fed Wage growth tracker hooked up… that his hawkish in the context of consumer spending needing to slow.
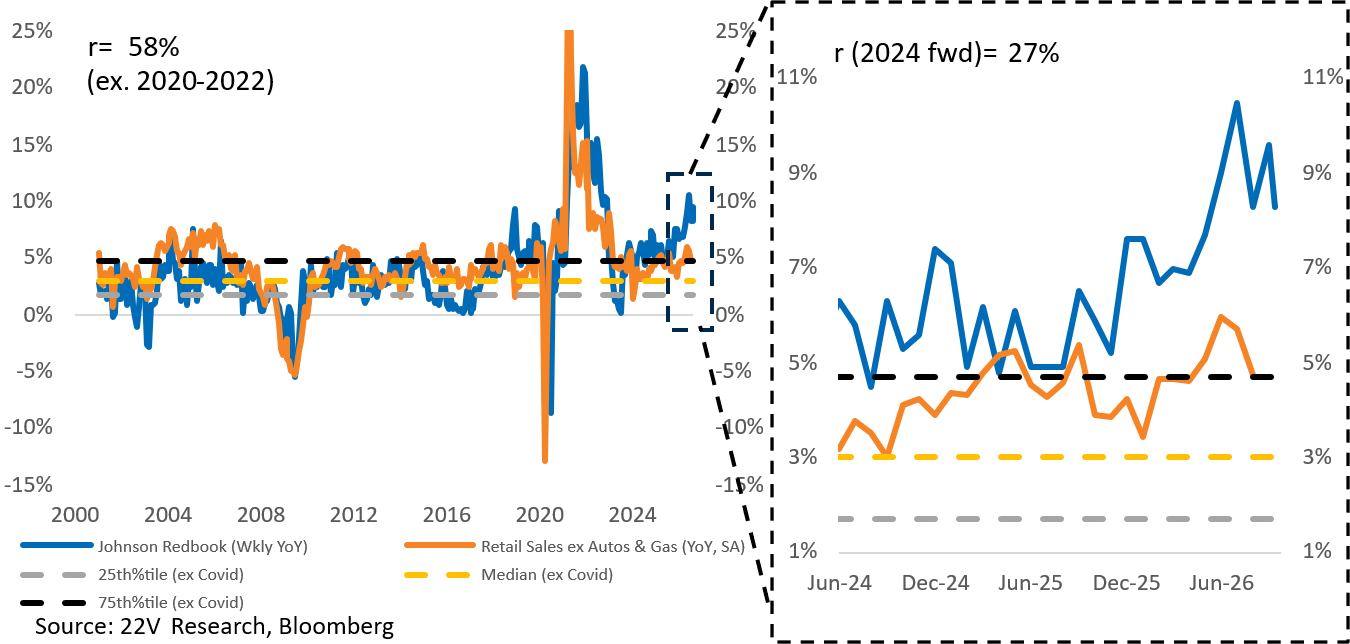
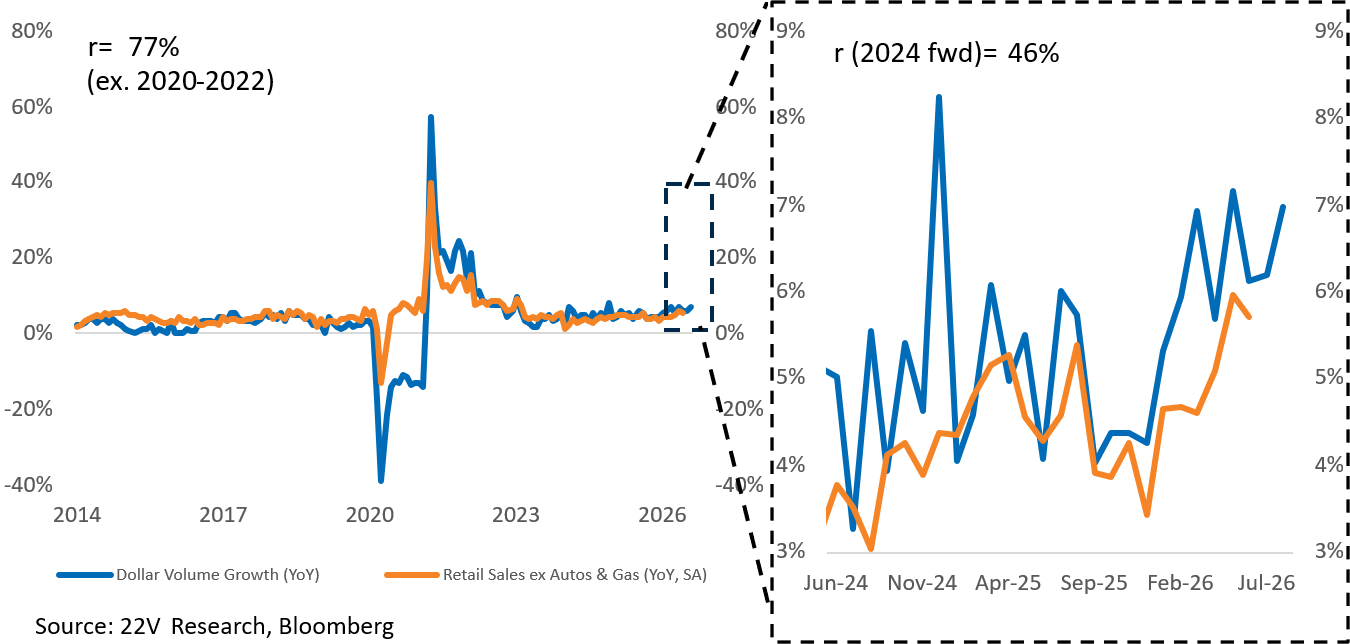
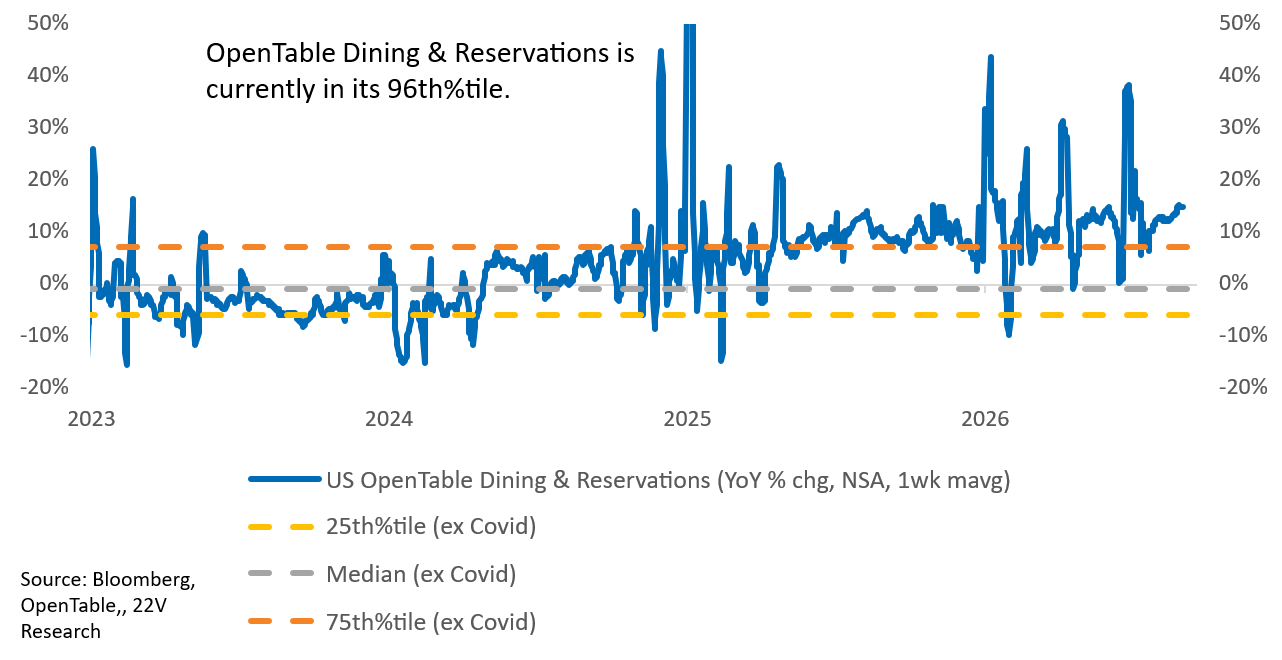
High frequency consumer spending data is strong.
The sum of fixed investment and consumer spending is unusually strong.
It’s counterintuitive, but a NON-RECESSIONARY increase in the unemployment rate would be CONSTRUCTIVE for equities. The unemployment rate increased in 2025 and S&P 500 multiples expanded. The unemployment rate is moving lower in 2026 and PEs contracting.
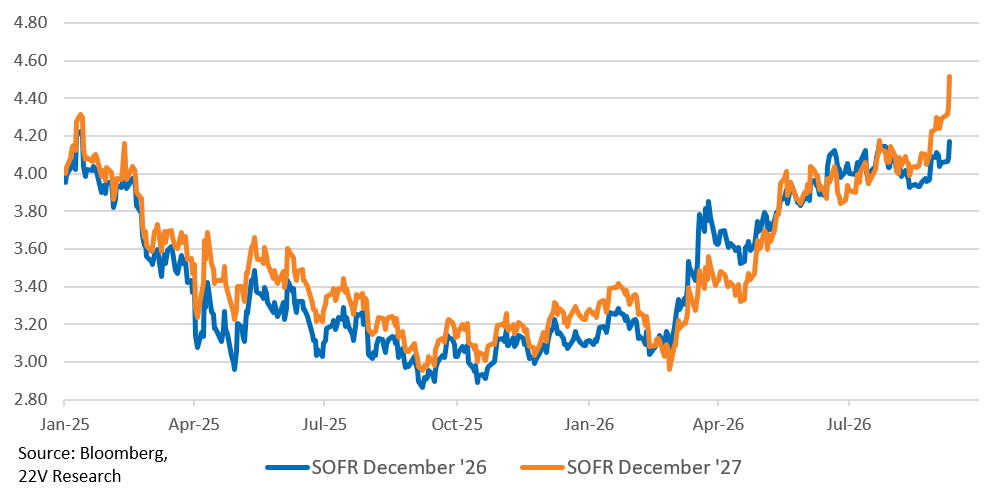
There are now 4 hikes priced in from now until end of 2027.
30yr Mortgage rates close to 7% and housing affordability at the 15th %tile historically should put further downward pressure on housing demand. Housing is already very weak though, which is why consumer spending needs to slow to lower inflation risk.
10yr yields seem to be drifting higher and if that continues, it will achieve the desired slowing of economic growth. 5% on 10yr yields is where investors believe demand destruction sets in.
Retail and Transports have struggled and that is unlikely to change in the near term as the consumer is likely to slow. Either the hard way (much higher rates) or the easier way (consumer spending moves slowly toward 2% from the current 2.5-3% pace).
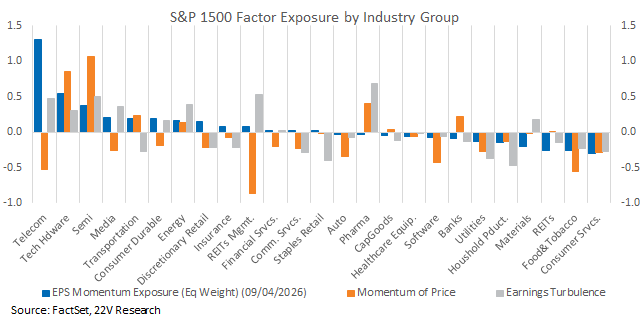
EPS Momentum, Momentum of Price and Earnings risk are more exposed to the AI buildout. They all have negative exposure to Consumer service names. Idio is the main driver of the AI buildout names, but from a macro point of view, the backdrop for that group appears more attractive REALTIVE. AI buildout related earnings should hold up as the non-AI related cyclicals areas if the economy slows.
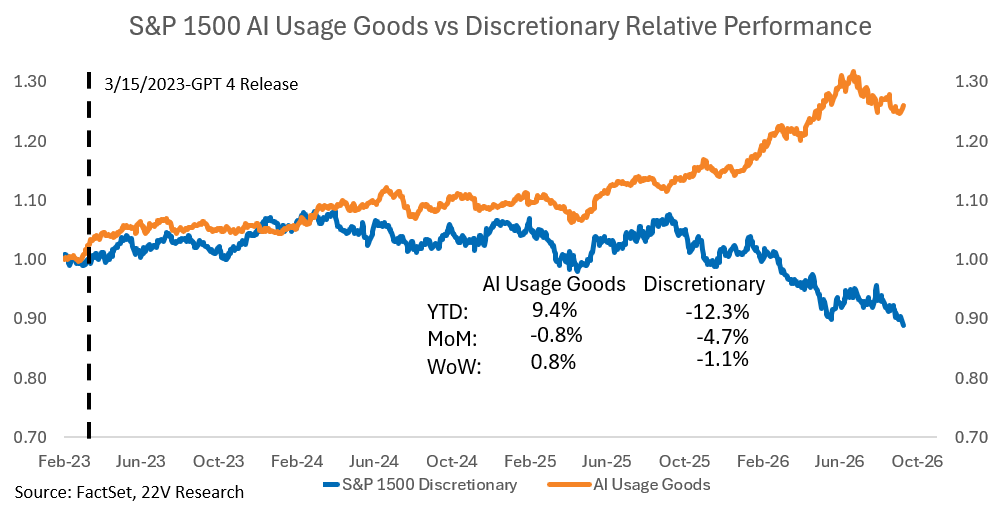
Below is the High AI Usage Goods Basket vs S&P Discretionary. The rolling correlation between AI Buildout names (proxied here with our AI Goods basket) and Discretionary has turned negative. That fits with our view that economic growth is too strong and the consumer, not AI capex, is likely to be the source of a slowdown.
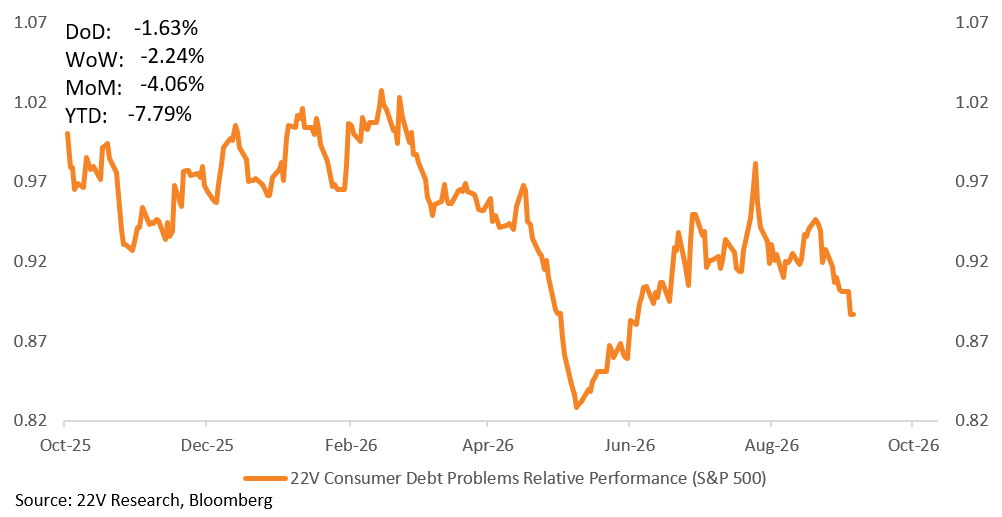
Our consumer debt basket is made up of the most Cyclical consumer stocks with low interest coverage ratios, high and deteriorating short-term debt ratios, and high cash flow volatility. It is down -8% YTD.
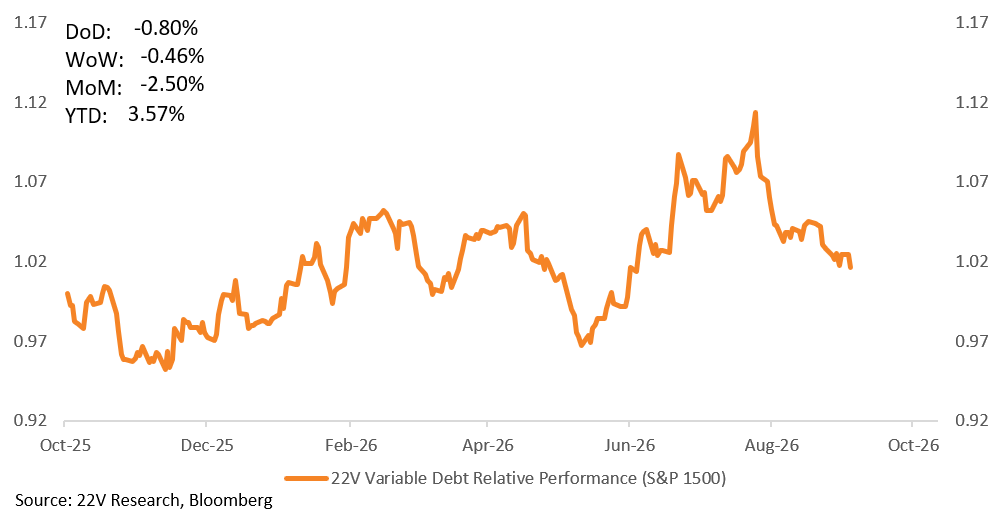
Variable Rate Debt basket (MS22VARD Index on bbg which is S&P 1500 stocks excluding Financials with high variable-rate debt exposure and low interest coverage ratios) performed well into late July/early August. That relationship has now reversed Consistent with our view that some restraint is needed to bring economic growth back toward its roughly 2% speed limit. As a result, companies with greater sensitivity to higher borrowing costs have started to underperform.
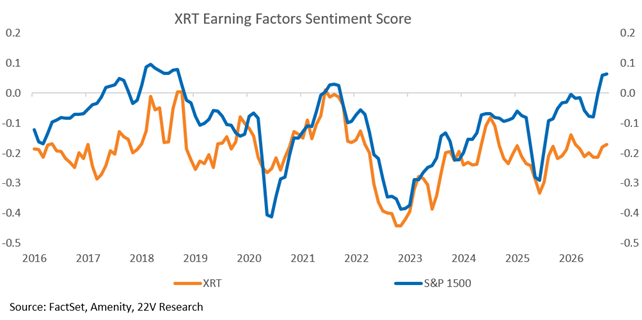
Earnings sentiment for the S&P 1500 has moved sharply higher. Retail earnings sentiment has remained muted.
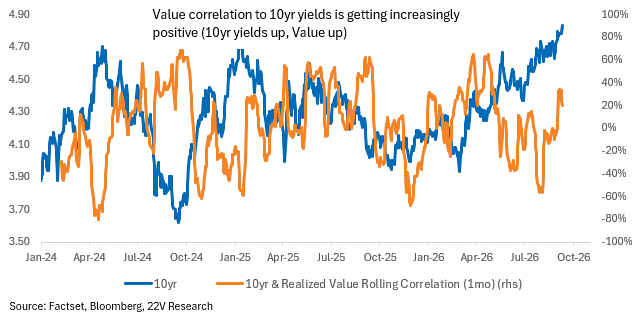
VALUE MOMENTUM BASKET: Yields around 4.5% are less of a headwind to risk-on factors and non-AI Cyclicals while yields above 4.75% are more obviously restrictive (HERE). Yields are now above that threshold. Long pure Value and blending Value with other factors is an effective hedge against volatility without sacrificing upside. Stocks with top quintile Value AND Momentum scores, unconstrained) is now up 9% YTD, notably continuing to rise during Momentum’s drawdown.
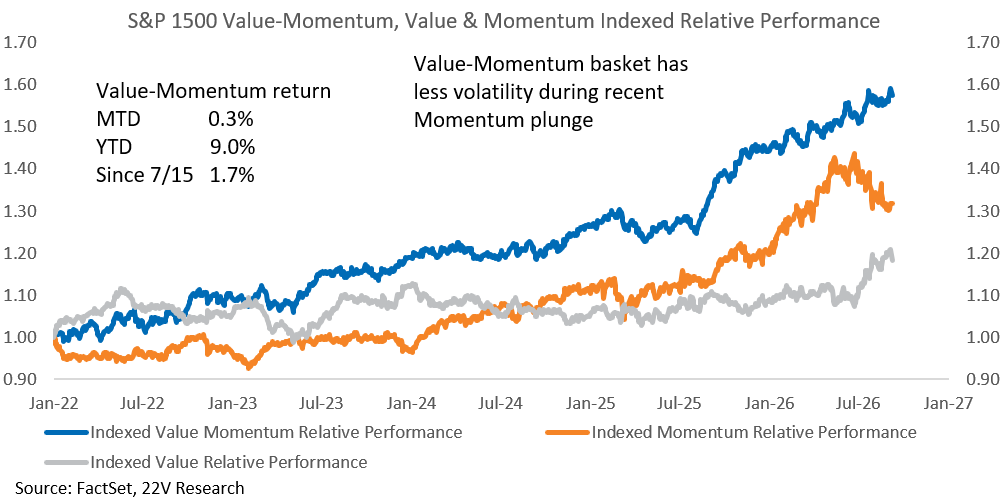
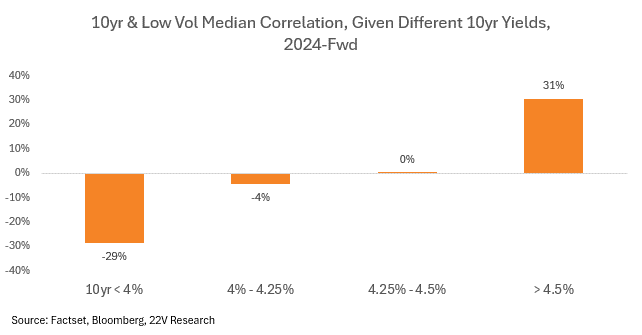
Value is a better, more consistent performer in Normal economic regimes, and is the hedge to focus on. The correlation between Low Vol and yields turns positive as yields increase but profiting longer term from being long Low Vol requires a much worse economic backdrop, or a high hit rate predicting economic data surprises.
The correlation between Value and 10yr yields has been increasing as yields have increased.