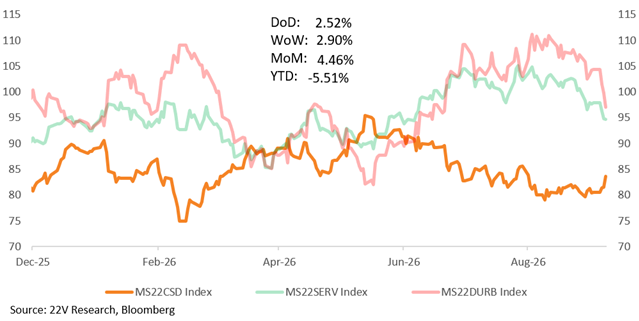
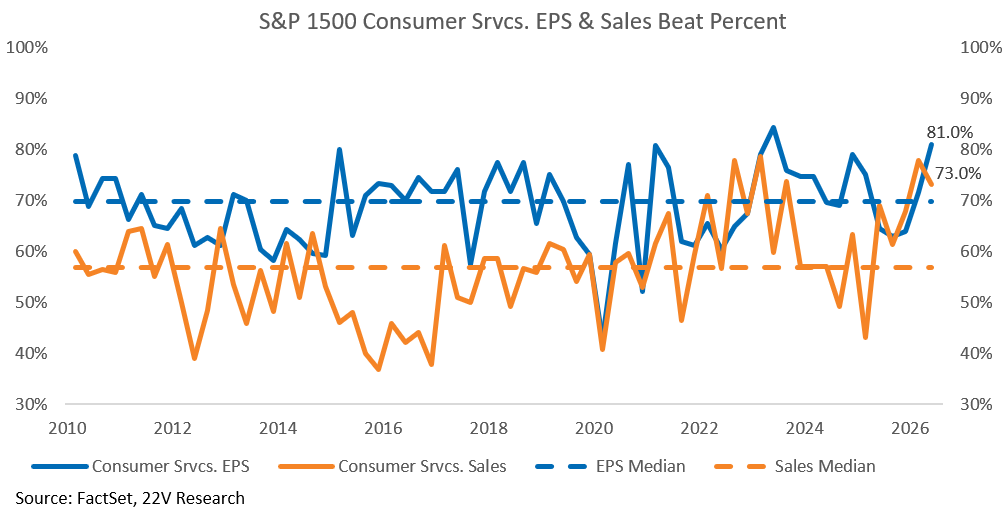
Consumer Services delivered its best earnings quarter since 2Q23 with EPS and sales beats reaching 81% and 73% respectively, both well above their own histories. Those results are consistent with the strong payments data Peter Williams has been tracking. Yet the market ignored these fundamentals and beats earned almost no excess return. Technical scores for Consumer names are weak as well. So, the question comes why Consumer Services absorbed so much price pressure despite strong payments data and a strong earnings quarter?
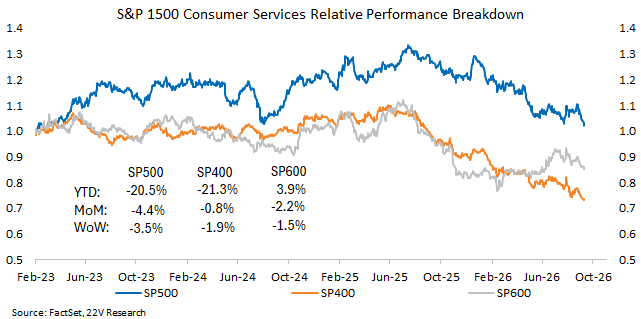
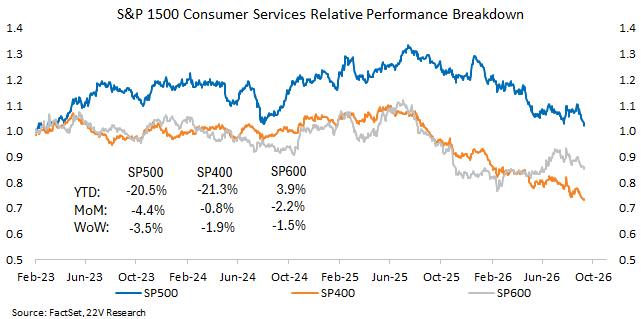
The resolution is that the spending is real, but it is not reaching the large cap listed names. BoA’s card data shows growth concentrated in independent and regional operators rather than national chains, and our attribution confirms it — small cap Consumer Services is +3.9% YTD relative to the S&P 1500 while large and midcaps are both down more than 20% relatively, a 24% spread driven almost entirely by stock-specific residuals than industry or factor exposures. Layered on top, investors are funding the AI capex cycle by selling consumer exposure as well.
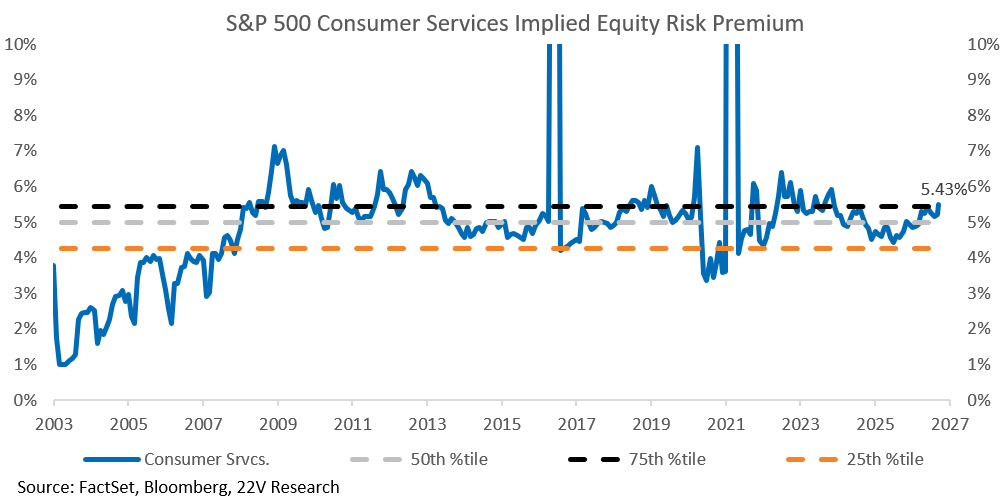
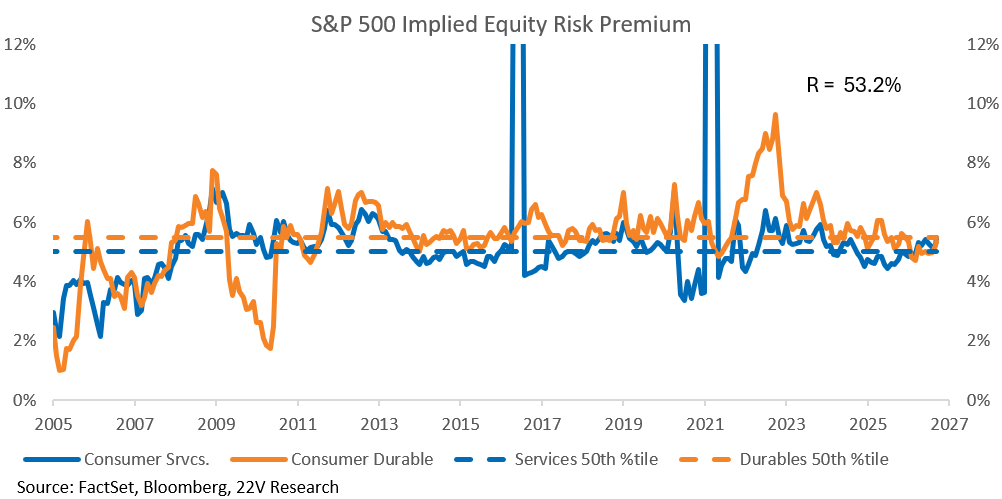
The result is that the Consumer Services group is trading at its cheapest in three years, with an implied equity risk premium above its 75th percentile and inexpensive against Consumer Durables. Our MS tradable Swap MS22CSD which long Consumer Services/short Consumer Durables swap has gained sharply MoM, and is expected to gain in the current backdrop.
Consumer Services span a wide range of industries: Restaurants, Hotels, Resorts & Cruise Lines, Casinos & Gaming, Education Services, Specialized Consumer Services and Leisure Facilities. Restaurants carry the most names and the largest weight in the S&P 1500. As 22V Economist Peter Williams, suggests (HERE), “Payments growth was very strong, with a bit of World Cup flattery,” and “topline consumer spending continues its very strong pace.” That strength is corroborated in the Consumer Services earnings data. Both sales and EPS’ beat percentages were excellent in 2Q26. The 81% EPS beat rate is the second highest since 2010 only behind 2Q23, and the sales 73% beat rate is around the higher range as well, though eased from last quarter’s 78%. Therefore, Consumer Services delivered an excellent quarter, consistent with what the payments data implied.
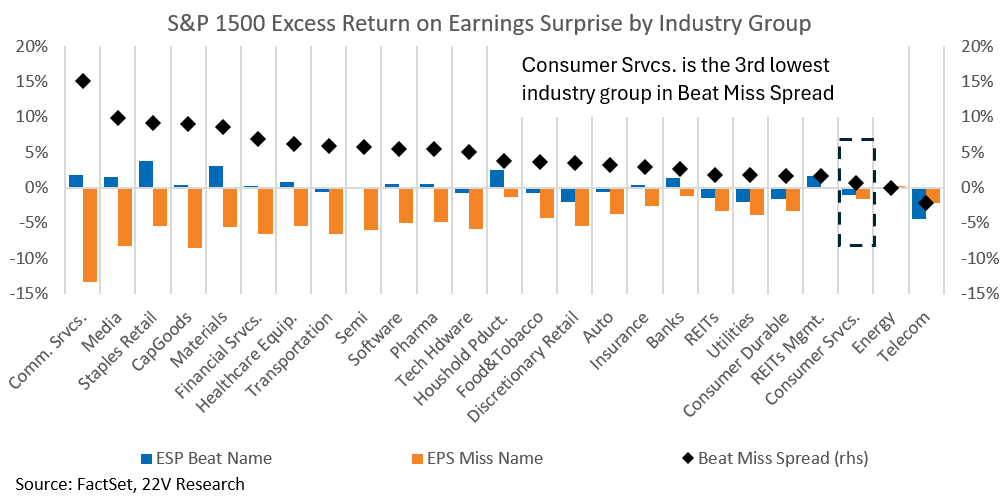
However, as with the Energy sector we covered last week (HERE), the market paid nothing for Consumer Services strong earnings. Its earnings beats were barely rewarded relative to misses. The spread is marginally wider than Energy’s but still ranks third lowest of all 25 industry groups, and both the beats and the misses delivered negative excess returns around their prints. The 81% EPS beat rate did nothing for Consumer Services’ excess return.
John Roque, Head of 22V Technical Analysis, also ranks Discretionary Sector ETF XLY a sell, and has highlighted seven weak stocks within Consumer Services: RCL (target 170), NCLH, CCL, MAR (target 250), WYNN, MCD and DPZ. So, the question becomes why Consumer Services strong payment data and beat quarter diverged from its weak excess returns and deteriorating technical scores. We see there are two explanations helping explain the difference.
First: the spending is unevenly distributed tilting towards small businesses
The Bank of America Institute’s report (HERE) notes that “According to Bank of American Card data, restaurant spending and transaction growth have both improved meaningfully in 2026.” But “despite accelerating restaurant spending, some national chains are not fully participating in the rebound. Spending growth appears strongest at independent restaurants, regional operators and other non-chain establishments”. This is consistent with John’s read that large national chains such as McDonald’s (MCD) and Domino’s Pizza (DPZ) are deteriorating technically. Though consumer spending is strong, incremental spending is not flowing to the listed national chains.
Our attribution work confirms this at the index level. National-chain operators sit predominantly in large caps, while the regional and non-chain establishments are more represented in the S&P 600 universe. The performance split is significant: S&P 600 Consumer Services gained +3.9% YTD relative to the S&P 1500, while S&P 500 and S&P 400 Consumer Services were both down more than 20% relatively.
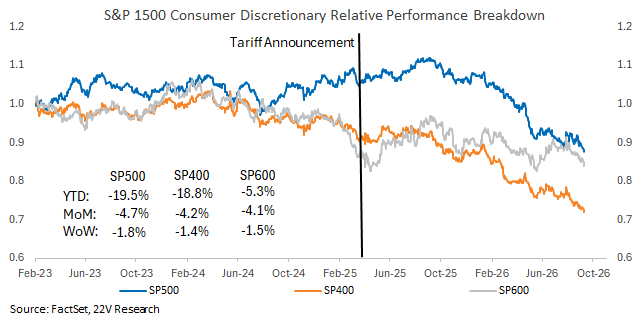
Extending BofA’s restaurant findings to the whole Discretionary sector produces the same conclusion. Large-cap Discretionary is the worst-performing cohort on every horizon (YTD, MoM and WoW), while the S&P 600 shows a milder drawdown. The S&P 500’s advantage over the S&P 600 peaked immediately after the tariff announcement and has compressed materially through 2Q26.
Second: AI capex is crowding out the consumer
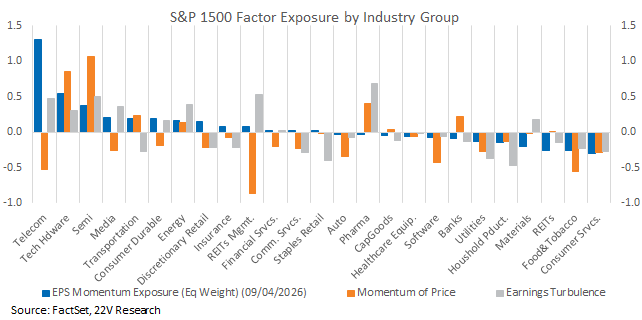
As we highlighted (HERE), investors seem to have internalized that some slowing in economic growth is necessary to restrain inflation. Real GDP growth currently is supported by both consumer spending and rapidly increasing AI-related investment. With AI investment unlikely to be a source of slowing over the next two years, more of the adjustment will likely need to come from the consumer. EPS Momentum, Momentum of Price and Earnings Risk are all levered to the AI buildout and carry negative exposure to Consumer Services. Investors expressing the AI trade are structurally shorting this group, which is why good earnings failed to generate positive excess returns.
The good news is that Consumer Services is at its cheapest level in three years. On implied equity risk premium, the group sits above its 75th percentile on full history, and its ERP has been grinding higher from its mid-2025 lows.
Consumer Services has historically tracked its peer group, Consumer Durables, reasonably closely on implied ERP, and both ticked up in the most recent readings. However, Consumer Durables latest reading remains below its 50th percentile even after the recent move, which suggests the valuation higher than its median. Consumer Services, on the other hand, has already climbed above its 75th. On this measure, Consumer Durables now looks materially more expensive than Consumer Services.
Our Morgan Stanley swap (ticker: MS22CSD) which longs Consumer Services and short Consumer Durables, has gained significantly on this divergence. As Peter has noted, travel and services demand remain robust while the goods and durables side faces input costs, inflation and rate pressure. That pattern should persist as financial conditions tightened, supporting continued gain for the trade.