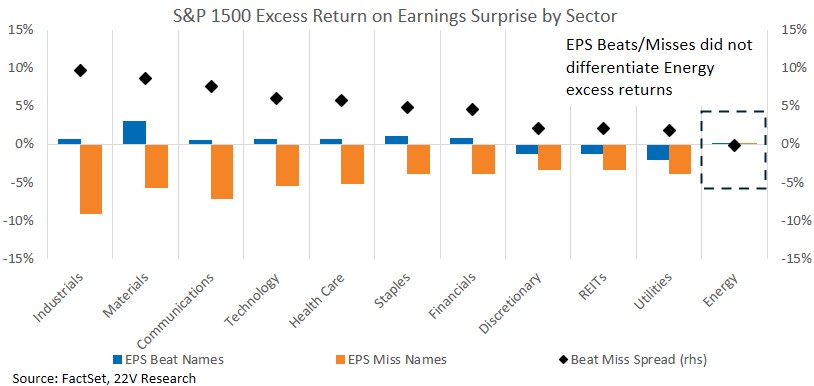
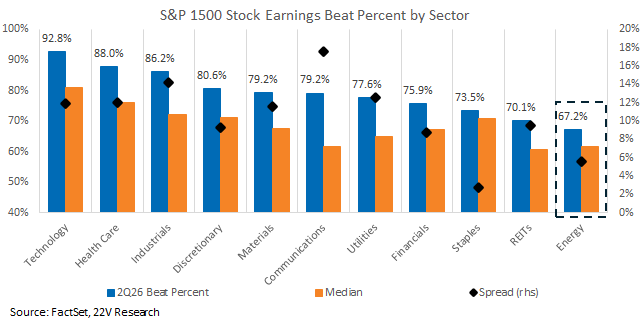
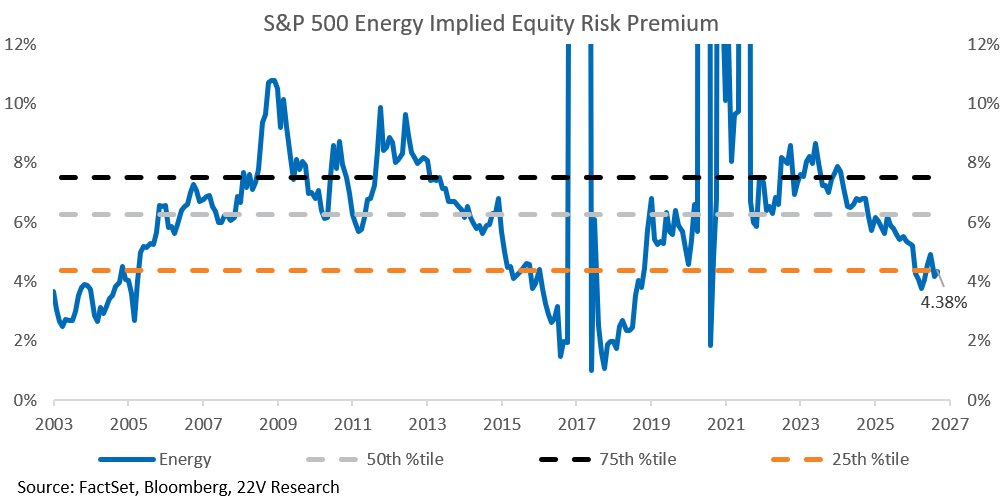
Energy is the best-performing sector YTD, but 2Q26 earnings did not explain its leadership. Energy was the only sector where EPS beats generated essentially no excess-return reward relative to misses, and its EPS beat rate ranked near the bottom of all sectors. Valuation tells the opposite story: Energy’s implied ERP has continued to compress since 2023 and is now near its 25th percentile relative to history. The implication is investors are paying more for Energy despite relatively weak earnings delivery.
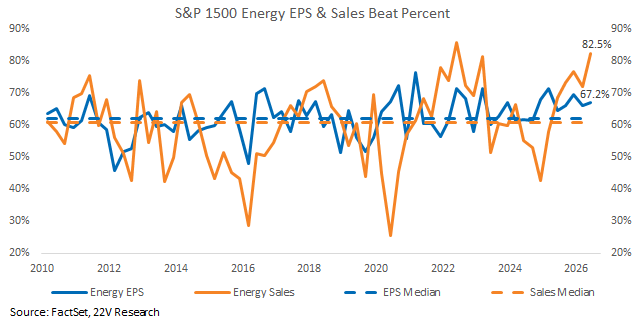
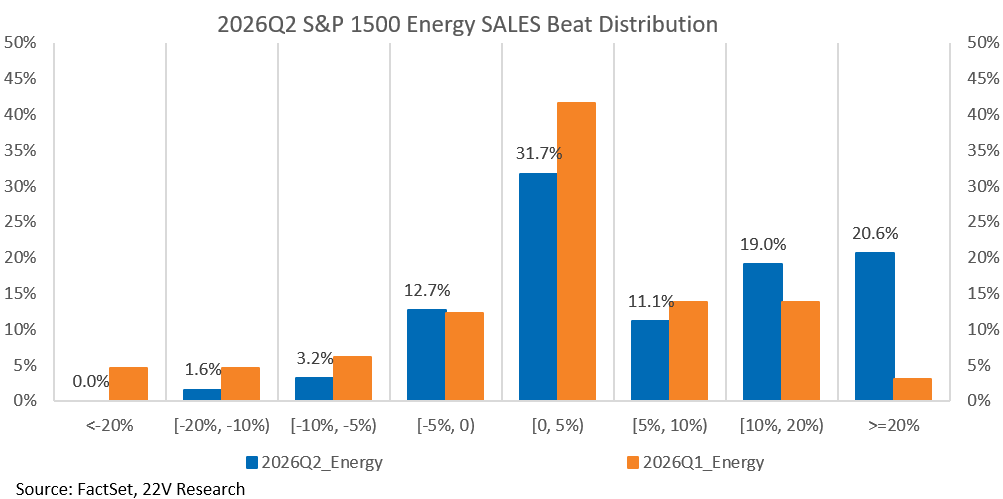
Sales provide part of the bridge. Sales beat rates in Energy jumped to 10.2% in 2Q, with 20.6% of names posting revenue beasts of >20%. However, management commentary suggests higher realized prices and volumes were offset below the revenue line by hedging, cost inflation, backwardation and derivative losses.
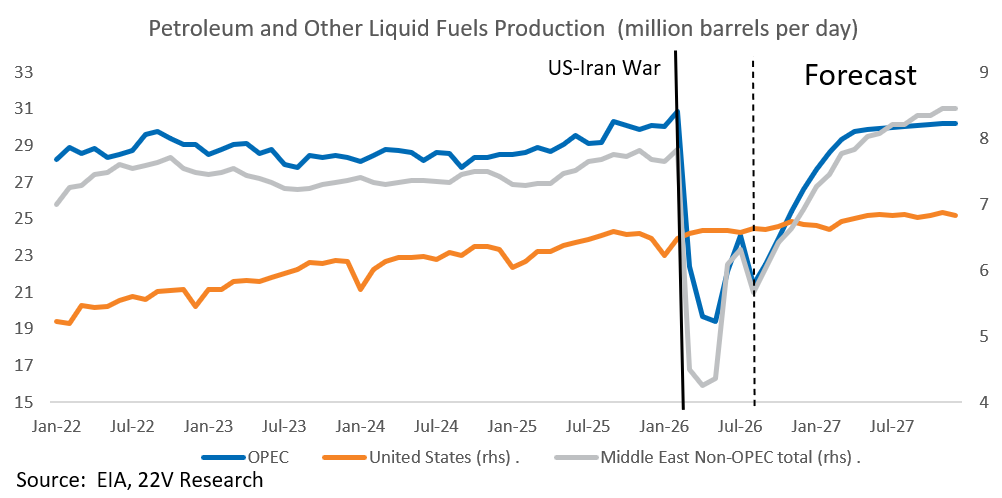
What the market appears to be paying for is the continuity and expected duration of the Middle East disruption. That prices tailwind has mattered more for US Energy companies than the latest earnings print. EIA forecasts suggest global supply disruptions could persist through 2027, while US production has remained comparatively resilient.
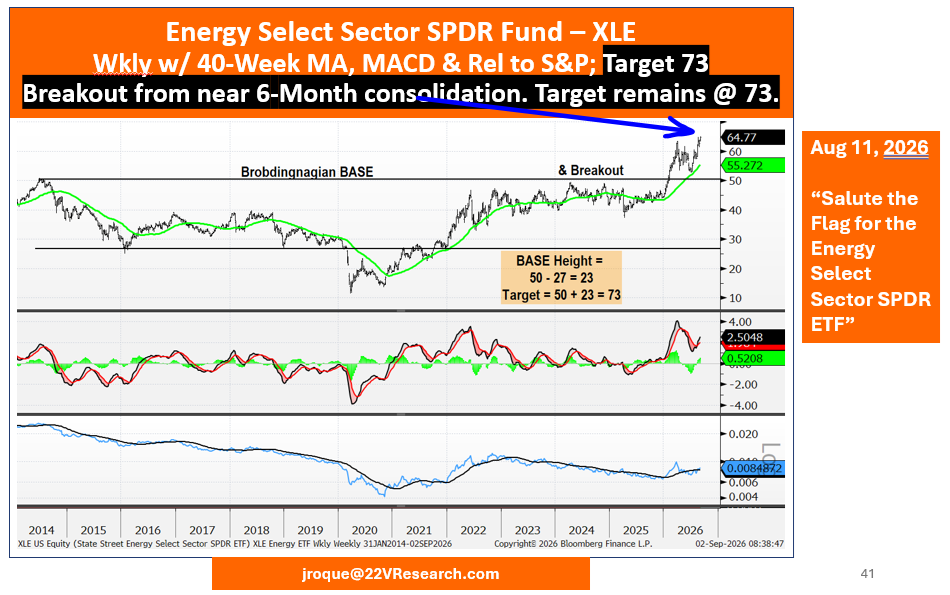
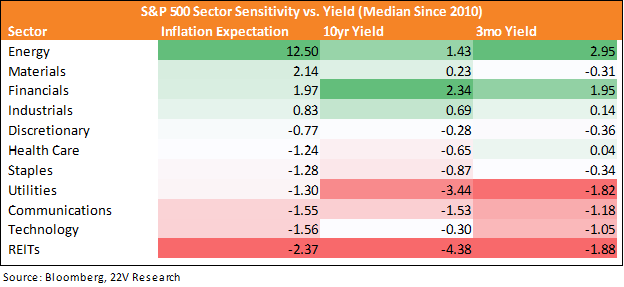
Energy also stands apart in its sensitivity to macro factors, including inflation expectations, and its greater exposure to short- than long-term rates. The sector is levered to the policy-rate and inflation complex rather rate duration. Together, these dynamics make Energy increasingly a supply-disruption and inflation-protection trade, rather than an earnings trade. John Roque, Head of 22V Technical Analysis, sees XLE working higher toward 73.
Energy’s Outperformance More Expectation than Fundamental Driven: As 2Q26 earnings season winds down, geopolitical events have returned to the headlines. US and Iran exchanged strikes on August 31st following President Trump’s announcement of the US-Venezuela oil deal. More exchanges were seen over the past weekend. Against this backdrop, Energy remains the best performing sector YTD. The question we address this week is whether Energy fundamentals explain that leadership, or whether the outperformance is more events driven.
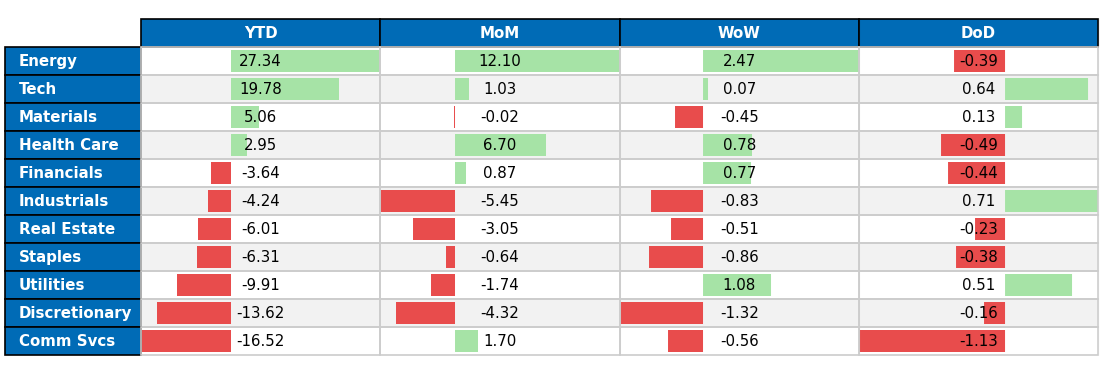
Energy Earnings surprises are not being rewarded. Excess returns within the sector were not differentiated between earnings beats and missed. In 2Q26, Energy was the only sector in which earnings beats delivered essentially no reward relative to earnings misses. The beat-versus-miss excess return spread was effectively zero.
Consistent with this, Energy’s EPS beat percentage and its spread relative to its own historical median rank 1st and 2nd lowest respectively among all eleven sectors. On both an absolute and a relative basis, Energy’s earnings performance sits on the opposite side of its position as the best performing sector YTD.
Sales beat partially explain Energy outperformance. Historically, Energy’s sales beat percentage has exhibited a wider and more volatile range than its EPS beat percentage, and 2Q26 was a typical example of that pattern. The EPS beat percentage rose by 1pp, while the sales beat percentage climbed 10.2pp. The EPS beat percentage alone is not strong enough to explain Energy’s YTD leadership but the stronger sales beats percentage does.
Most significantly, the shares of companies posting sales beats greater than 20% rose from 3.1% to 20.6%, which was more than six times as many Energy companies reported extreme sales beats vs. 1Q.
Management commentary through the 2Q26 calls explains why the top-line sales beat upside did not reach EPS. CVI captured the dynamic in a single sentence: “Elevated Group 3 crack spreads and higher throughput volumes drove the majority of the increase… offset somewhat by higher rent expenses, significant backwardation in WTI and realized derivative losses.” SLB pointed to “the logistics disruption and the cost inflation that we saw early in the conflict” evidence of a supply shock, corroborated by the WTI backwardation CVI flagged. OKE identified the hedging channel directly: “While our hedge position limited our ability to fully capture the benefit of wider spring blending spreads, we have secured additional fall hedges at higher prices and extended new hedges into spring 2027.” Taken together, higher realized prices lifted revenue almost mechanically, while hedging, cost inflation and derivatives losses absorbed the revenue upside.
Valuation has continued to richen for Energy Sector. Energy’s sector implied ERP now sits at the 25th percentile of its history. Although it ticked up on the latest reading, the ERP remains in a downward trend that began in May 2023, when the industry completed its recovery from the COVID shock. On fundamental valuation grounds, Energy stocks have been growing steadily more expensive since 2023, and notably, they have continued to richen through a quarter in which earnings performance was the weakest of any sector.
Expected duration of the supply disruption is a driver for Energy. US Energy Information Administration (EIA) in its August Short-Term Outlook Report (HERE), before the US-Venezuela deal and new rounds of US-Iran conflicts, states that “We expect most crude oil production in the region to return to near pre-conflict averages in early 2027; however, we expect ongoing disruptions of about 0.6 million barrels per day to continue through the end of next year.”
This offers a plausible answer to why Energy’s performance has decoupled from its earnings and fundamentals. What the market is pricing is not the 2Q26 print but the continuity and expected duration of the Middle East disruption, which underpins the expectation that US energy companies continue to benefit from the current environment. The US-Venezuela deal is a potential catalyst that could accelerate those benefits.
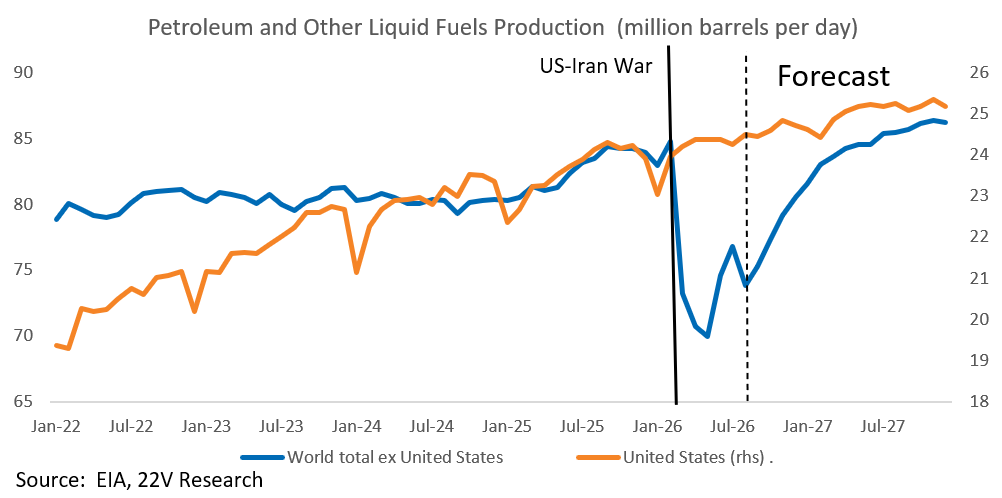
From EIA’s Dataset. while both OPEC and Middle East non-OPEC producers absorbed the bulk of the impact from the US-Iran war, US petroleum and other liquid fuels production has remained stable. Based on EIA’s forecast, OPEC petroleum and other liquid fuels production is expected to recover and surpass US production in February 2027, returning to pre-war levels after May 2027. More importantly an estimate that does not yet incorporate the US-Venezuela deal or this week’s escalation.
Similarly, US petroleum and other liquid fuels production has been only marginally affected by the US-Iran war, whereas production from the rest of the world shows a sharp drawdown that is not expected to recover to pre-war levels until at least 2027.
The macro backdrop reinforces the same conclusion. The rate and inflation backdrop favors Energy to a degree unmatched by other sector matches, providing a second non-earnings tailwind alongside the supply story. Compared to Financials, whose sensitivity to 10yr is the highest of the GICS sectors, Energy’s rate exposure tilted toward the short end (higher sensitivity to short term yields, lower sensitivity to the long-term yields). Energy is levered to the policy-rate and inflation complex rather than duration, making inflation expectations the operative channel.
Inflation expectations are where Energy separates from the market entirely. Its sensitivity is a multiple of the next-ranked sector’s, with most sectors negatively exposed to inflation expectation. One qualification deserves emphasis: inflation expectations embed energy prices, so part of the measured sensitivity reflects reverse causality. That is important to keep in mind but also doesn’t account for the magnitude of the gap.
The bottom line is that investors are not paying Energy for its 2Q26 earnings; it is paying for the expected duration of the disrupted supply and for inflation protection. John Roque, Head of 22V Technical Analysis, believes the Energy Sector ETF will work higher and holds a target of 73 on XLE.