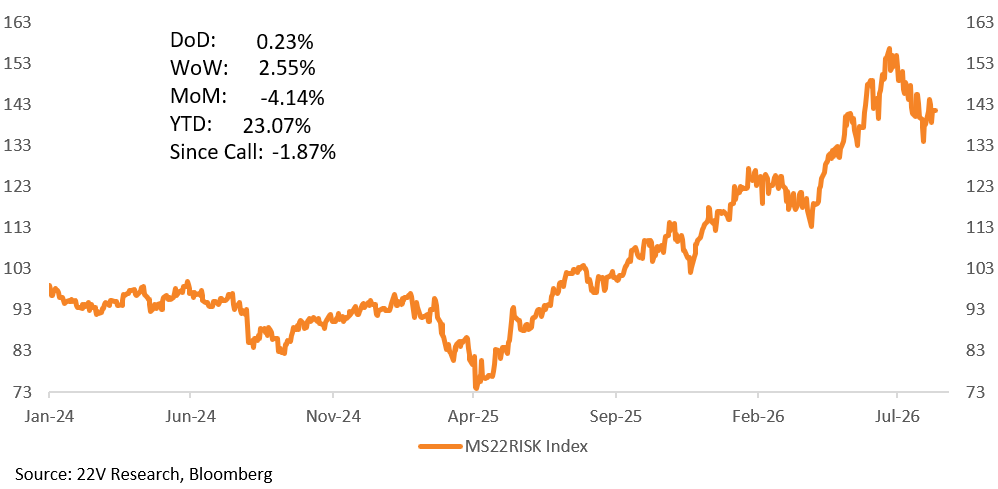
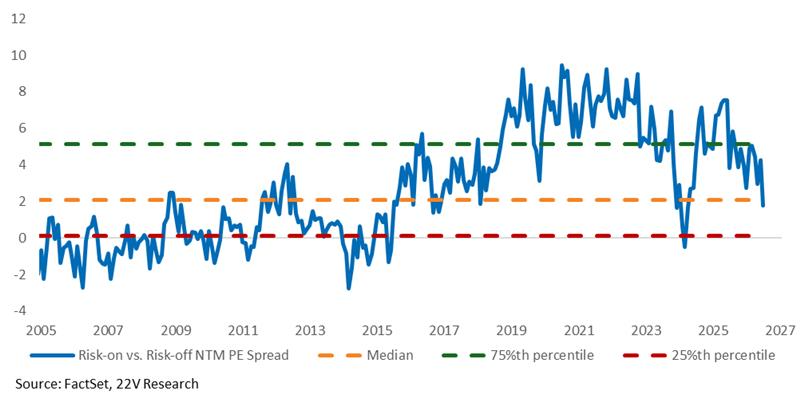
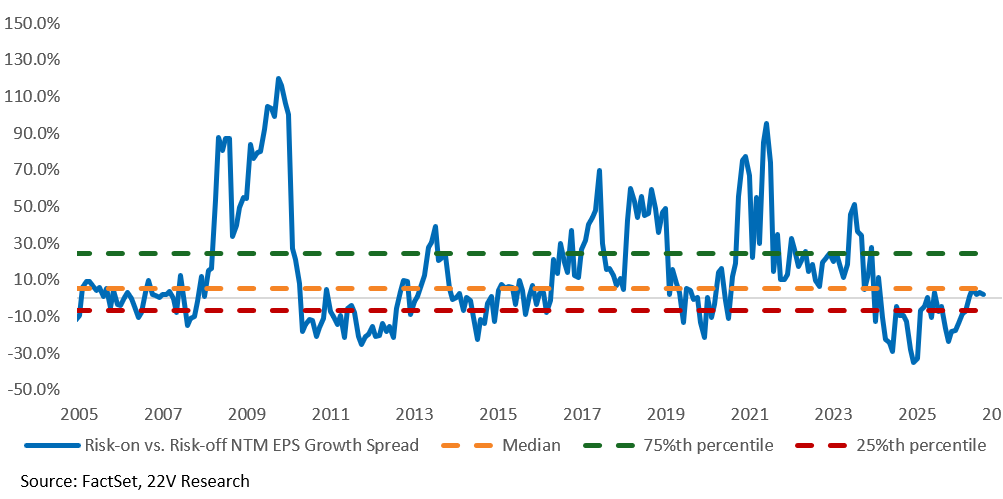
DAILY STRATEGY: Last Monday we highlighted the positive skew for “Risk-On” factors relative to “Risk-off” factors. Marking the “Risk-On” vs. “Risk-Off” factor trade (MS22RISK* on Bloomberg and is tradeable through Morgan Stanley. Ask us) to market after one week. The Risk-On factor baskets outperformed Risk-off by +2.55%. The NTM PE spread between Risk-on and Risk-off is below its long term median and NTM EPS growth is +10% for the Risk-on basket relative to Risk-off. Also, fundamental factors continue to perform unusually poorly RELATIVE to what is typical in economic expansion.
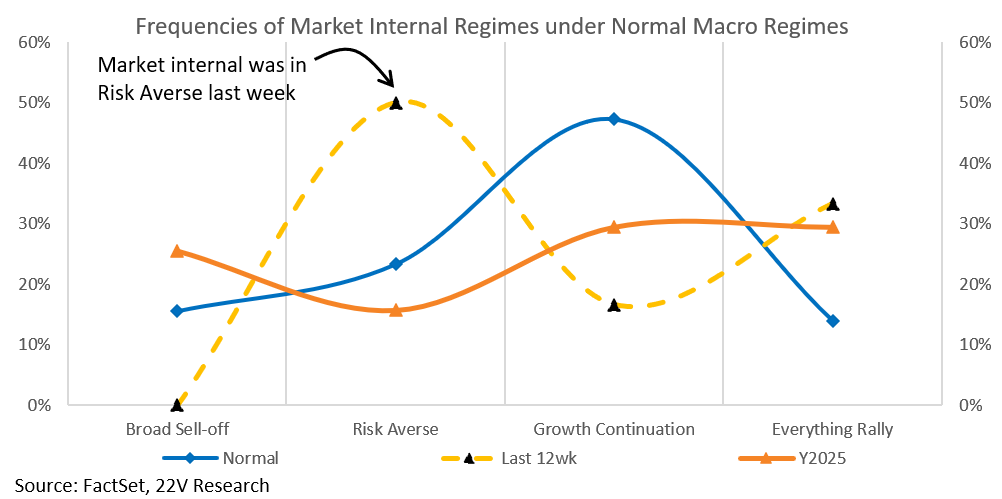
50% of the weeks over the past quarter have been categorized as Risk Averse. I.e. Risk-off factors have outperformed most weeks. That is more than double what is typical historically. Likely driven by the Momentum sell-off, 10yr yield surge and Strait of Hormuz uncertainty. The three drivers of Risk-Aversion had been reflected in market pricing as of last Monday in our view (HERE). Setting up the positive skew.
More Support for Risk-On Following the Payroll Report. What we learned last Friday is that the “speed limit” for economic growth increased. The easing labor market dynamic, counterintuitively, RAISES the implied speed limit for GDP growth. See more on the Speed limit in the Weekly HERE, but the short version is that it looks like real economic growth can be above +2% without inflation being a problem longer term. What that means is the Fed doesn’t need to tighten financial conditions meaningfully AND the Fed can and will offset demand shocks with rate cuts (it would be MUCH harder to offset a demand shock if labor markets were tighter).
Bottom line Expansion More Durable – As long as labor slack is increasing and inflation pressures from wages are easing. That keeps the expansion durable. The more durable the expansion, the higher the odds the equity risk premium declines, increasing equity market upside and favoring Risk-On factors. Cyclicals over Defensives as well.
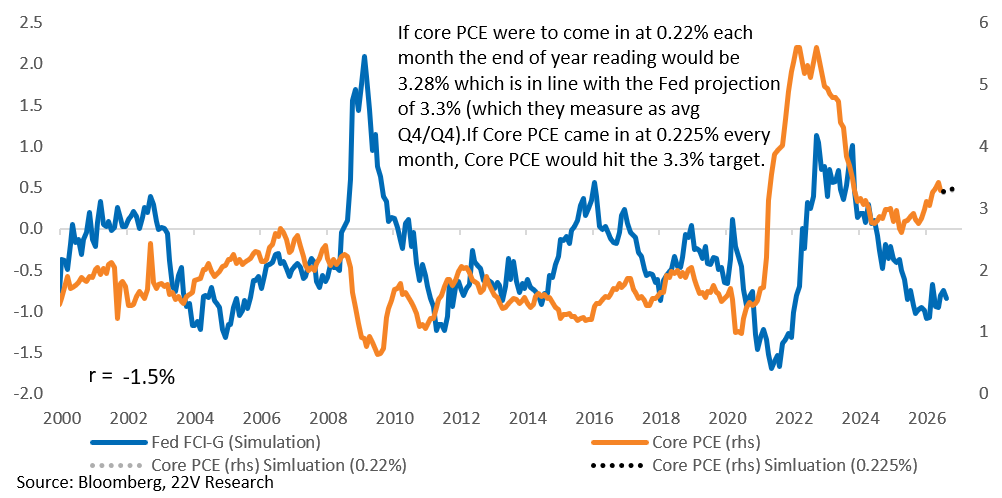
Risks To Our View – Same One Inflation: If the sum of CPI/PPI data this week leads to forecasts of 0.3% MoM for Core PCE, that will keep hikes on the table for September. Recall, last month Core PCE inflation data was more dovish than expected. Core PCE can now come in at 0.22bp a month to hit the Fed 3.3% target for 2026 Core PCE (vs 0.21 previous). 0.25bp for core PCE is likely not a problem given the dovish last month and labor data. Close to 0.3%, or more, MoM could be more of a problem for risk assets. Higher inflation is a risk to our bullish framework, which is why lower costs hedging against a hawkish inflation outcome makes sense now (see Hedging ideas Jeff Jacobson HERE).
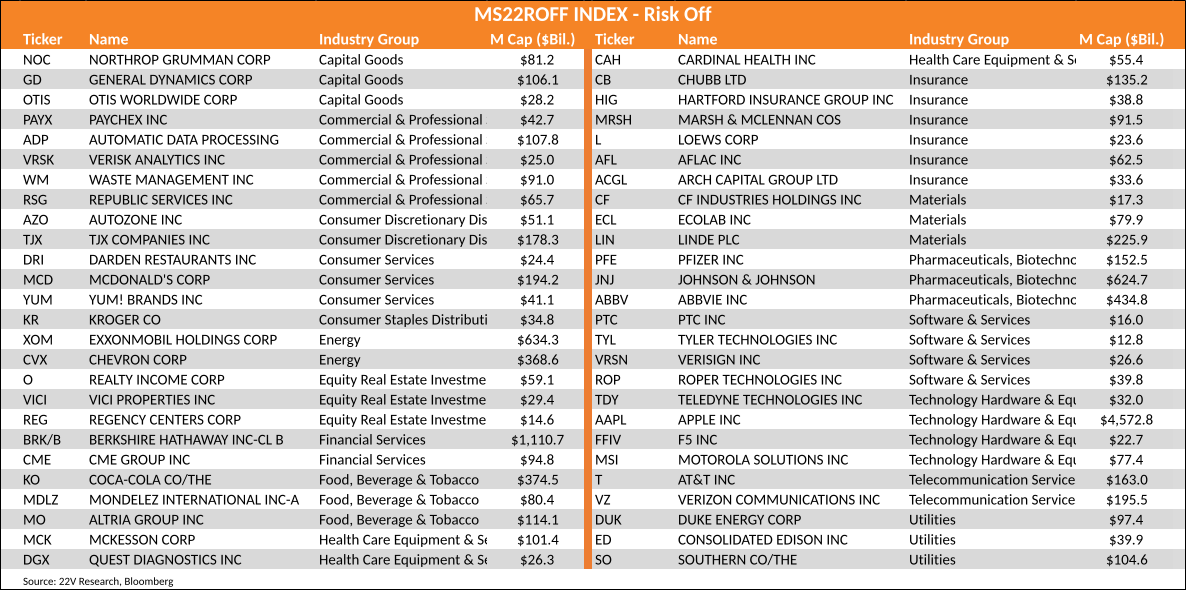
*22V Research’s risk-on vs risk-off swap goes long S&P 500 companies, sector neutral, with the highest variability of eps and sales and short S&P 500 companies, sector neutral, with the lowest betas and volatility.
Charts…
If the sum of CPI/PPI leads to forecasts of 0.3% MoM for Core PCE, that will keep hikes on the table for September. Recall, last month’s Core PCE inflation data was more dovish than expected.
Options Hedge Idea from Jeff Jacobson. “I believe investors should use this very attractive skew when either adding new long portfolio exposure at the highs, or if looking to potentially hedge some existing long exposure. An example of this trade would be something like this:
Sell SPY Sept 18th 800 calls
Buy SPY Sept 18th 750 puts
Costs ~ $2.35 (SPY 773.26 Fri close ref)
Trade Details:
• Selling the 3.5% (25d) upside calls to buy the 3% (25d) downside puts
• Selling the upside call covers more than 62% of the cost of owning those downside protective puts (speaks to the attractive put/call skew)
• SPY now at all-time highs, but was trading < 730 as recently as 7/29
• With VIX at these levels, I would expect to see both downside put vol AND skew to move up meaningfully should we actually see a decline (another reason why I like the low-cost collar trade here)
• Trade looks especially attractive if adding more upside exposure in futures or cash at these levels
• Please reach out to me or the 22V sales team for updated pricing and execution capabilities.”
50% of the weeks, over the last 12 weeks, have been categorized as Risk Averse. I.e. Risk-off factor have outperformed most weeks. That is more than double what is typical historically. With the economic expansion looking more durable, Growth continuation regimes (favors fundamental factors and doesn’t favor risk off factors) is more likely.
Risk on factor stocks are outperformed risk off factor stocks WoW…
The NTM PE spread between Risk-on and Risk-off is below the long term median and NTM EPS growth is +10% for the Risk-on basket relative to Risk-off.
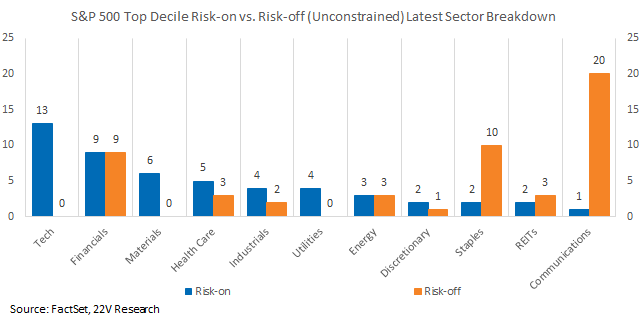
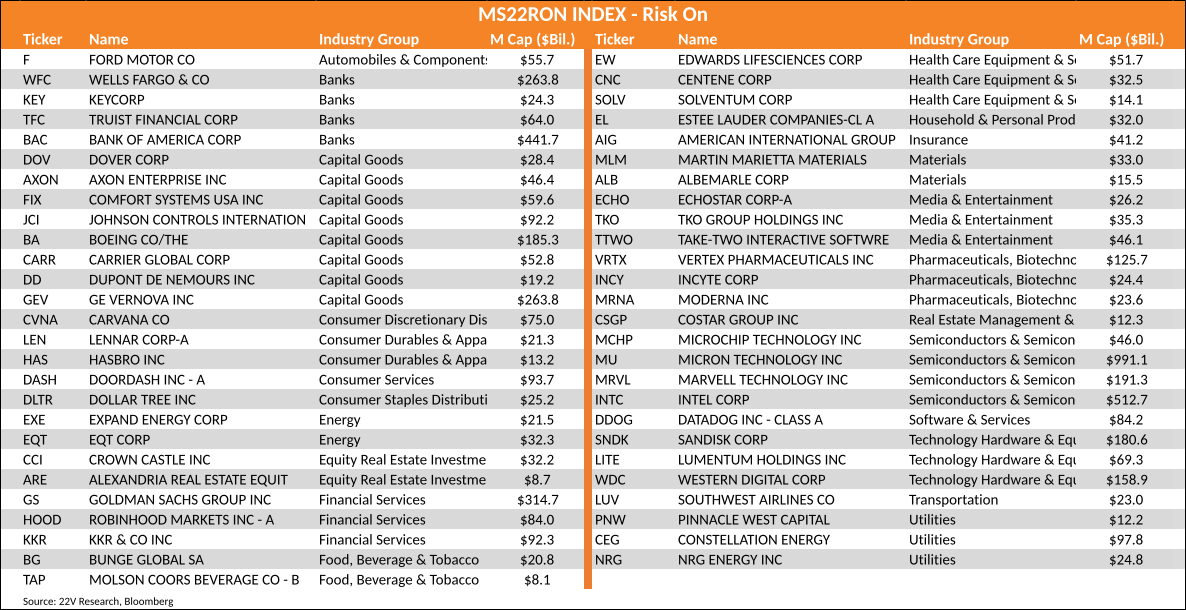
Stocks in the Risk on and Risk Off buckets. S&P 500.
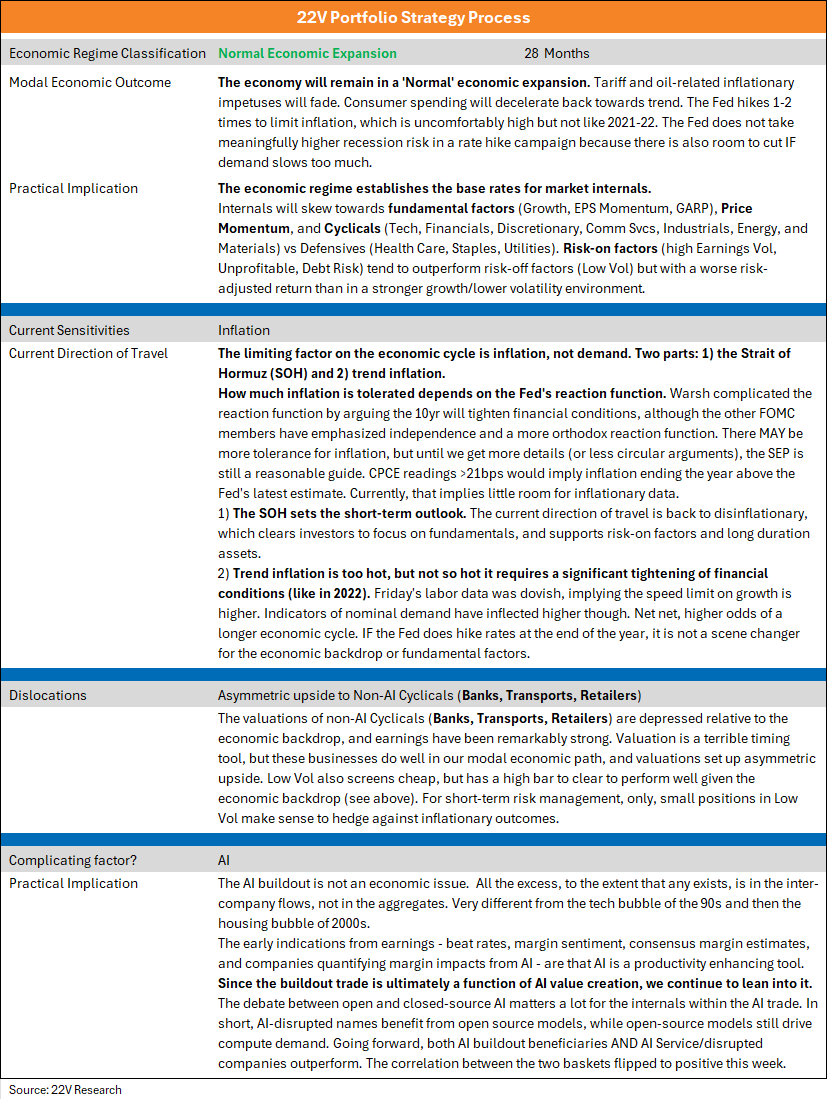
OUR PROCESS: Going forward, Monday’s notes will focus on the overall process we anchor to. The below graphic details the medium to longer-term outlook (6+ months) for equity internals based on the current economic backdrop, the modal outcome for the economic backdrop, and the sensitivities of the backdrop. When we mark to market our views based on new market and macro data, and talk about short-term risk management, it is always relative to what our background process implies. Below is an effort to lay out the background process in detail.