Weekly – We home in on two themes today to mark to market. We will mark to market the full list again next week. The two themes are very important and becoming clearer. Trend GDP outlook (increased) and Market Regime Supports (higher margins/higher markets).
Our call is for a benign slowing of economic growth to the ~2% or below range. That would be consistent with 10yr yields in the 4.2-4.5% range and support duration sensitive equities (Tech, Discretionary, Banks, Consumer) and fundamental factors. Marking to Market – This slower moving theme is at the top today as it is more obviously going in our direction, for the first time in several months of this theme looking wrong, for a bullish reason. Economic data last week suggested +2-2.5% (or slightly above) real GDP AND LESS longer term inflation risk is POSSIBLE. Put differently, it appears the “speed limit” of the US economy might be higher. The speed limit is the max rate real GDP can grow at WITHOUT inflation moving away from the Fed’s 2% target.
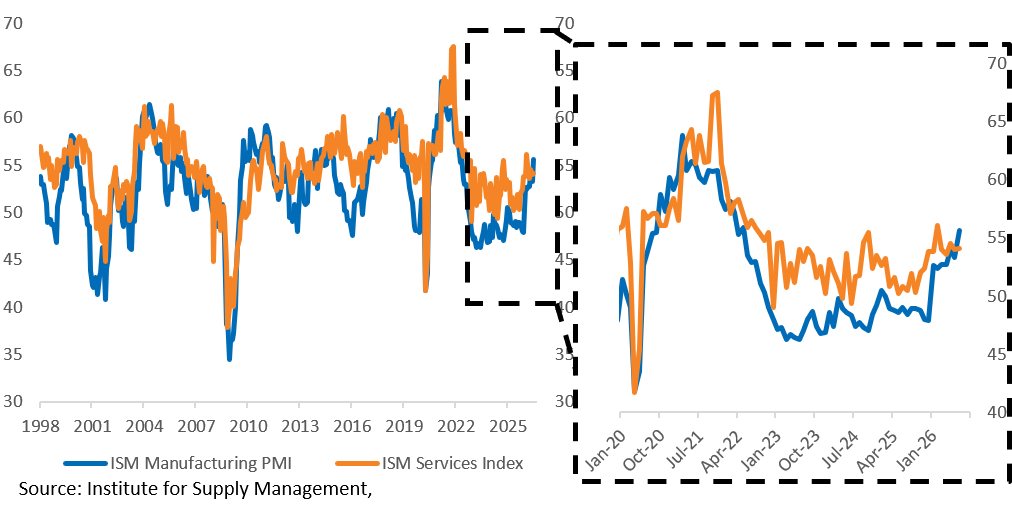
Recall that our view has been the speed limit for economic growth, or more precisely, Private Final Domestic Demand (PFDD, which is the investment and consumption components of GDP. It is a better measure of underlying economic strength), is roughly ~2%. In 2Q26 Private Final Domestic Demand grew 3.9%! The implication was that PFDD would need to slow in the back half of 2026 for core PCE inflation to remain at or below the Fed 3.3% 2026 forecast. The data so far in 3Q remain firm. See Johnson Redbook Weekly Retail sales are running +9%, and the July manufacturing PMIs pointed to an increasingly strong demand backdrop and broadening out the recovery (HERE). The Service PMI Remains at 54, flat MoM – I.e. not showing much slowing in Economic Growth. Early 3Q strength in economic data combined with still high actual inflation (core PCE 3.4% YoY) is why Fed hikes were a base case in September despite Warsh’s dovish press conference.
Why the Speed Limit Has Potentially Increased & What It Means for Market Internals and 10yr yields: The payroll report showed that the labor market continues to ease despite firm economic growth. The employment to population ratio declined and nominal wage growth is decelerating. As Gerard noted on the Weekly call (HERE), this easing labor market dynamic, counterintuitively, RAISES the implied speed limit for GDP growth (above 2% now potentially) rather than signaling demand stress. What we are left with is a medium horizon growth outlook that IMPROVED and a Fed that can and will offset demand shocks with rate cuts. As long as slack is increasing and inflation pressures from wages are easing. That keeps the expansion durable.
The more durable the expansion, the higher the odds the equity risk premiums decline, increasing equity market upside. 8500 on the S&P is possible (more below). 10yr yields remain in the 4.5% range because the outlook for longer term economic growth is firmer. I.e. a higher speed limit increases R*. Cyclicals are attractive relative Defensive sectors and Fundamental factors outperform. We are long Risk on Vs Risk off factors now (HERE).
Service companies that use AI (including Software and other services companies. Like insurance, payment names, etc) AND AI buildout baskets (Liquid Cooling, AI Power, Semis) should both outperform if AI is improving profitability for all companies. The current trends of increasing margins across market caps, strong beat rates and positive EPS revisions across both AI Goods and Services, and strong compute demand, alongside open-source models gaining popularity, support that view (HERE).
Near Term Macro RISK Related to the above – Peter maintains his baseline view that the Fed’s next move will be a hike, likely around the turn of the year, despite the “summertime softness” in the payroll data. He argues that because the labor market is “muddling through” and slack is stable, inflation data remains the key marginal input for hiking decisions. It is possible that the CPI/PPI data is unusually hot this coming week. The consensus number (+2.5% YoY for core CPI) would not be a hawkish problem for risk assets.
Data That Support Our Normal Economic & Market Regime Base Case: Marking to Market – more and more positive is the bottom line. So far this quarter, 25 companies have quantified the impact on margins from using AI. In aggregate, those 25 companies guide to ~180bps of margin improvement. That is already more quantifiers than last quarter, with a larger impetus to margins (80bps last quarter). Several of the companies lumped AI together with other cost saving initiatives, so 180bps is likely too high. Ex those messier names, the margin improvement was ~100bps. We don’t want to ignore a subset of the Quantifiers, so haircutting the messier the names and blending them with the cleaner reads, unscientifically, implies something like ~150bps of margin improvement. Direction matters more than precision in these early estimates, and the direction is towards more AI users reporting better margin improvement than last quarter.
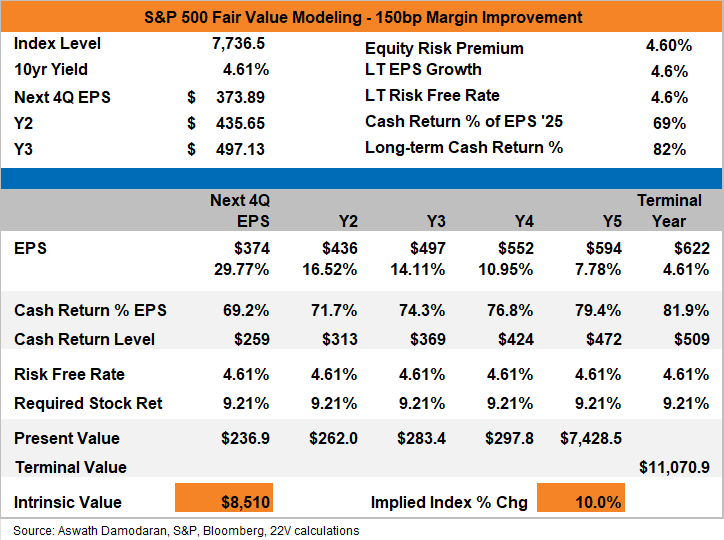
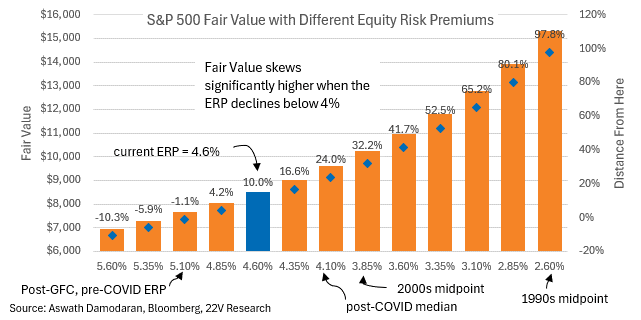
Extrapolating 150bps of margin improvement to the index* would imply a minimum of ~+10% upside to S&P 500 Fair Value. There are two direct ways that cost savings increase fair value – a higher path of earnings and a higher long-term cash return ratio (because cash return is a function of ROE). Together, that’s worth +740 points (+10%), with upside if cash return is higher. The equity risk premium would also move lower (fair value higher), an indirect result but one we have high conviction in. The equity risk premium is more difficult to model, so we provide a range of estimates; the magnitude of the impact would be another +~10% to as high as another +~50%.
*Extrapolating 150bps of margin improvement assumes that AI is helpful across different business models. Examining Property, Plant & Equipment expenses, R&D, and Sales, General & Administrative expenses across the lists of Quantifiers, AI Users with no quantification, and no AI usage shows AI usage is concentrated in asset light businesses (low PP&E revenue). This is a risk that we will monitor. Again, it is early.
Charts related to the comments above are below…
The ISM data was firm again last week…
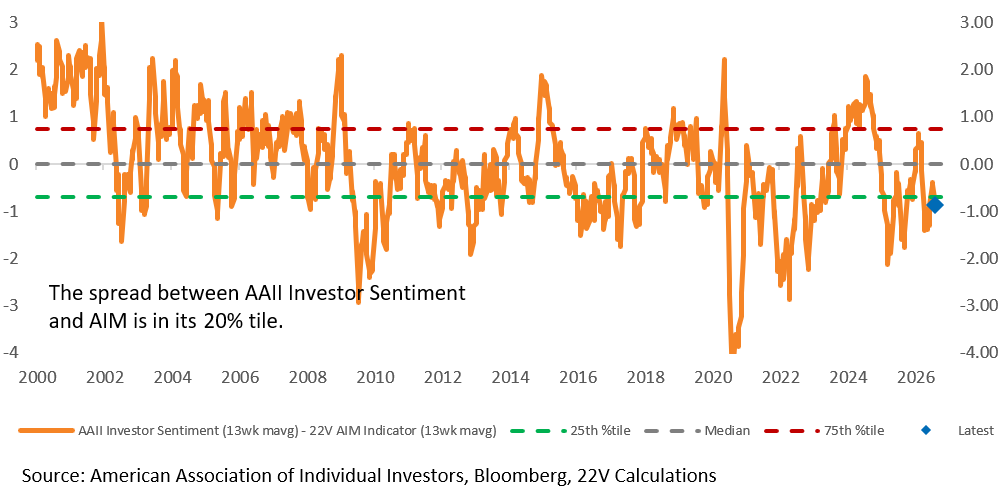
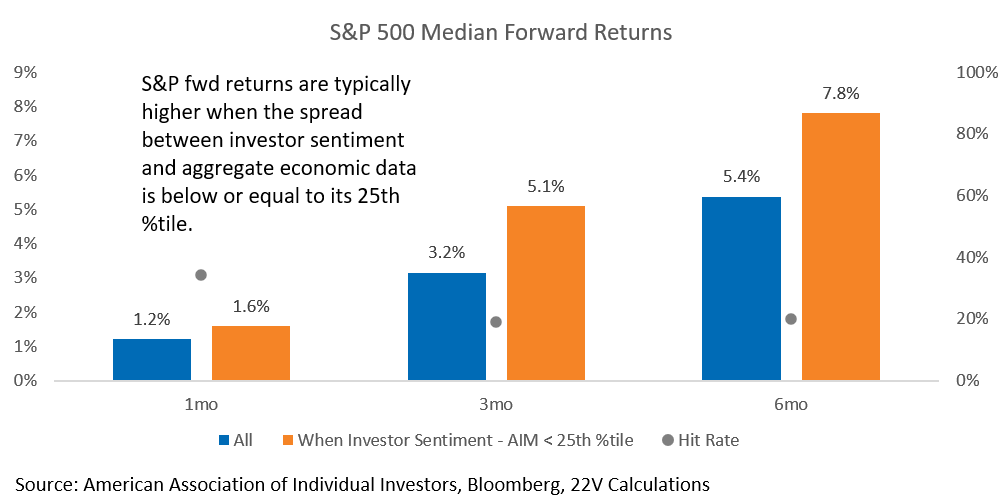
SENTIMENT: Investor sentiment is still low RELATIVE to the breadth of economic data. We look at investor sentiment, as measured by the AAII bull bear ration, relative to a diffusion index of US economic data. Not investors sentiment in isolation. The current reading of investor sentiment relative to the economic data suggests higher than normal returns.
AI QUANTIFIERS: So far this quarter, 25 companies have quantified the impact of AI, collectively pointing to ~180bps of margin improvement. Because several bundle AI with broader cost savings, we think ~150bps is a more reasonable directional estimate. Importantly, more AI users are reporting greater margin benefits than last quarter. Applying 150bps across the next three years lifts consensus EPS from $349 to $374 in 2026, $408 to $436 in 2027, and $467 to $497 in 2028. We are not forecasting 150bps of index-wide improvement this year; it is an anchor for the potential earnings impact if current trends persist. The implication is that equity valuations are less stretched than they appear, with upside skew to index-level returns.
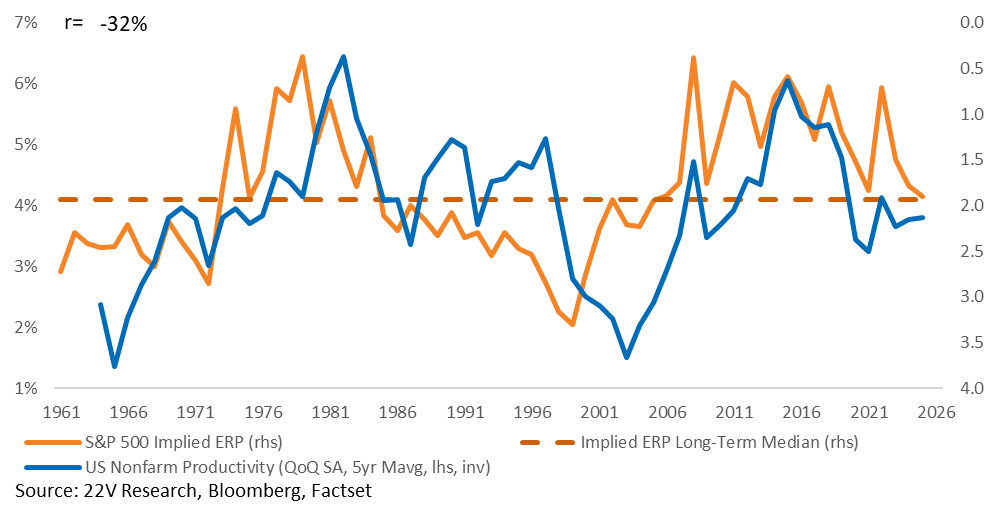
The ERP has moved in ranges based on productivity in the past. Better productivity = higher valuations. It is possible that the ERP would fall to a range more consistent with the 1990s or 2000s, a period of high productivity growth. That opens additional upside in a range of +~10% to as high as +50%. Estimating an ERP based on productivity would be false precision – the practical implication is higher fair value, with a tail to much higher fair value.
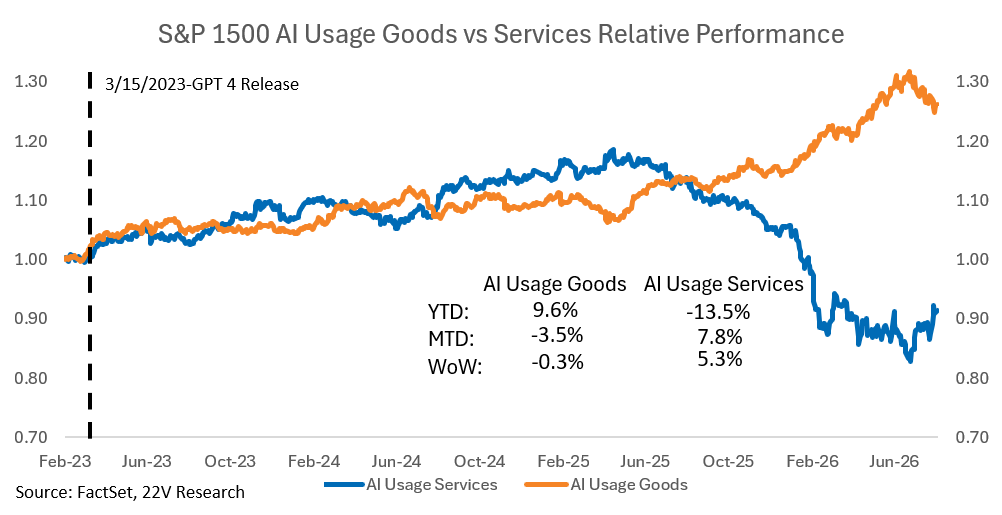
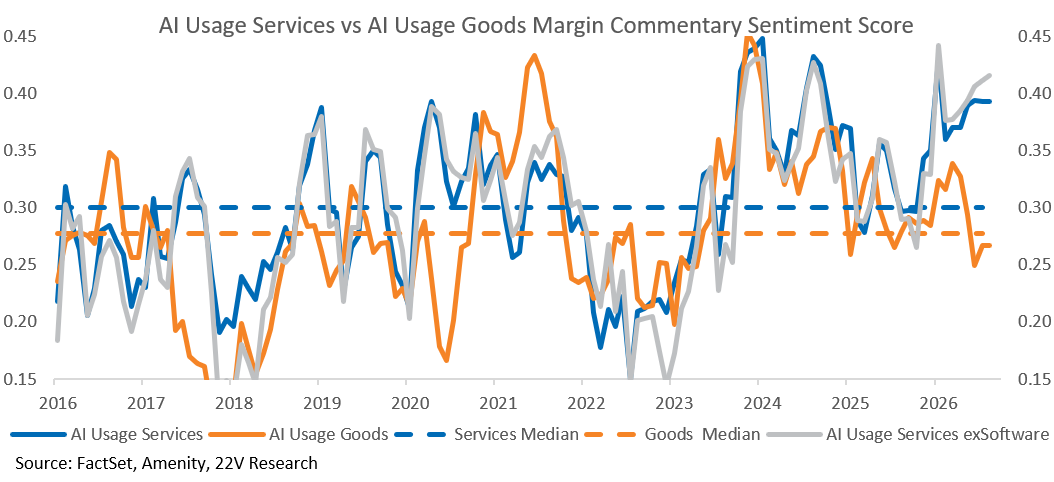
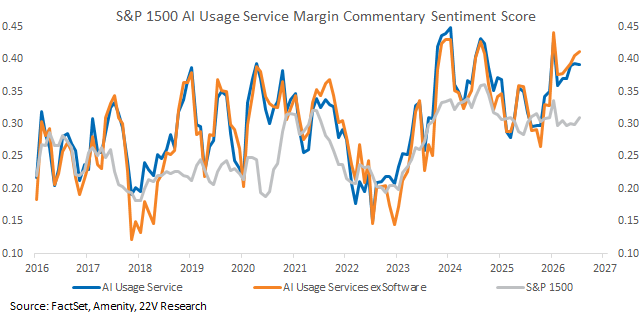
SERVICE COMPANIES: AI goods and AI services can both outperform if AI is improving profitability for all companies, and if there is less of a threat to the application layer from frontier labs training on their data then using that data to put service companies out of business (see HERE).
AI Service and AI Goods revisions are BOTH stronger than normal.
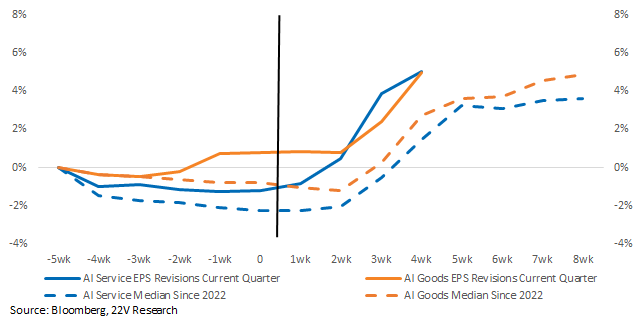
The margin story seems to favor AI Services for now too. Implementing AI is an advantage, and investors are getting more concerned about the buildout. FYI, ultimately, both baskets can work together if AI proves to be a profitability enhancer.
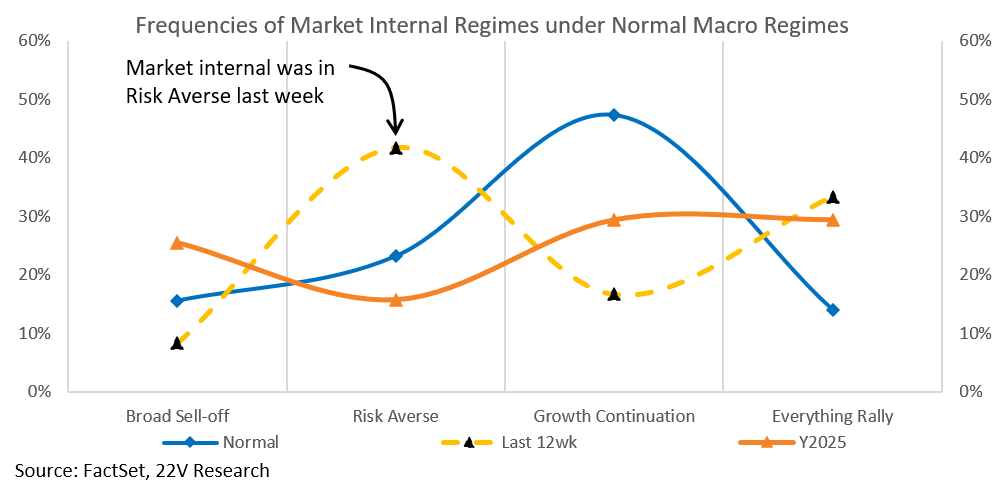
RISK AVERSE FACTOR OUTPERFORMANCE: Now seems like a good time to fade the Low Earnings Vol or Risk Averse factor outperformance. Earnings Season has lowered near term AI buildout risk and the 10yr increased 4.73%. Any relief in yields is likely to be associated with upside for fundamental factors. We have been trading in a risk averse regime. We would fade that now.
Implied equity risk premium, the expected cash return yield relative to 10yr yields, is above the post COVID median and close to the 75th%tile longer term. A more durable economic expansion being priced is more likely to lower equity risk premiums.
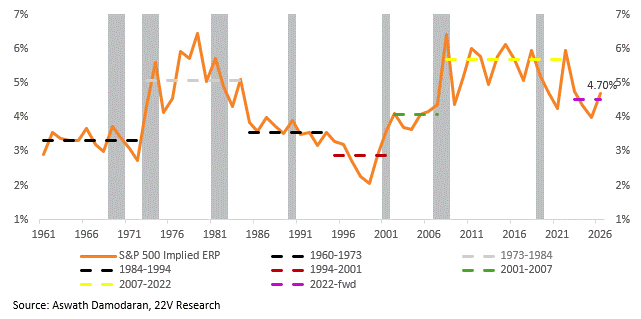
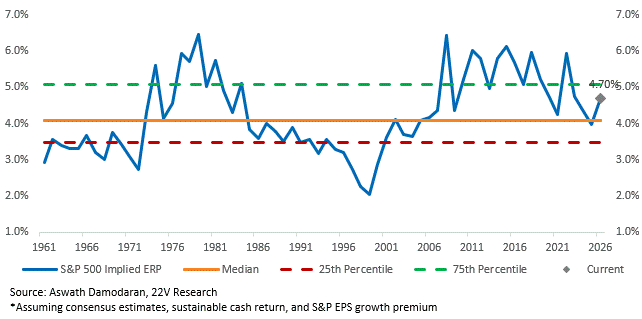
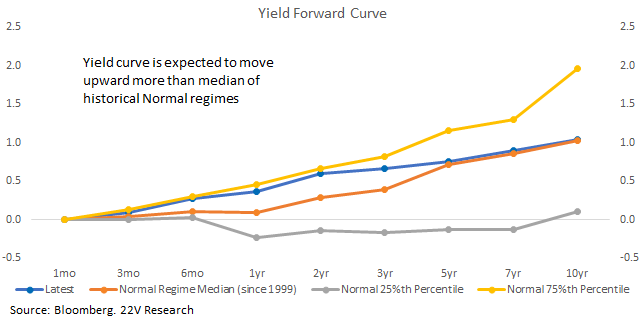
Forward rates point to further increases in the 10-year yield and a curve materially steeper than is typically observed during historical Normal regimes, particularly over the next three years. Good for banks assuming core inflation is “non-problematic”. That should be a significant support for Banks, ASSUMING, inflation is not problematic over that same period. Our view of non-problematic is inflation, for the rest of 2026, is below 3.3% on Core PCE. A decrease in supply shocks (Oil prices lower) risk is necessary as well.
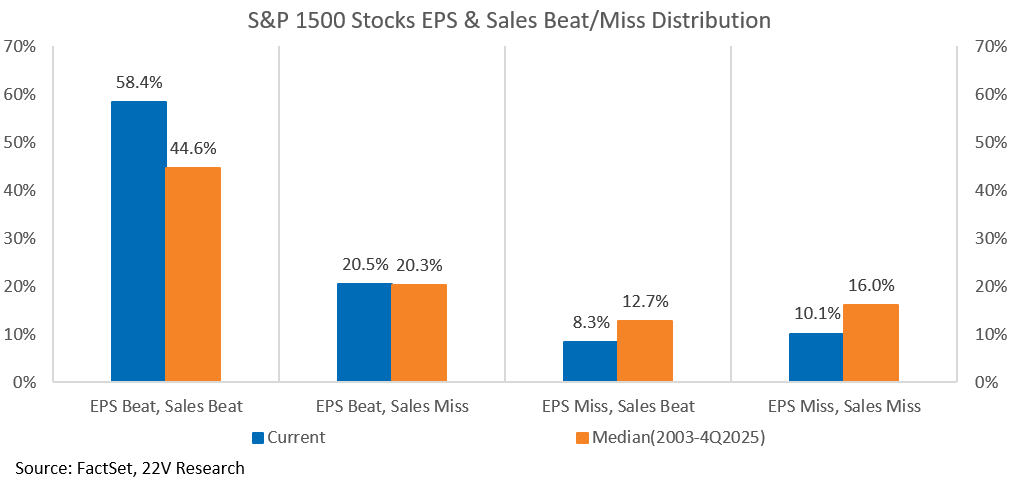
EARNINGS: Earnings have been unusually strong in 2Q.
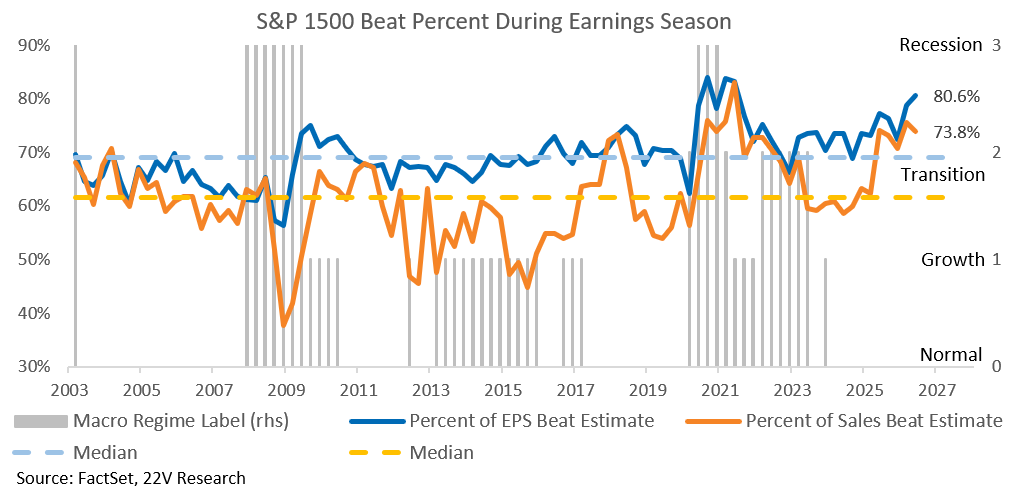
58.4% of stocks are beating on EPS and Sales in 2Q. Vs 44.6% historically.
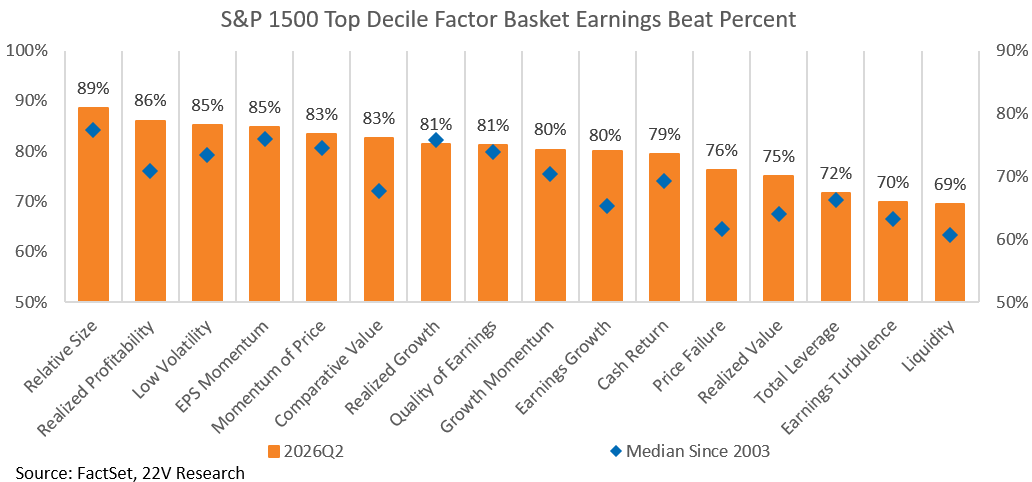
Fundamental factors have unusually high beat rates relative to history. We favor fundamental factors now.
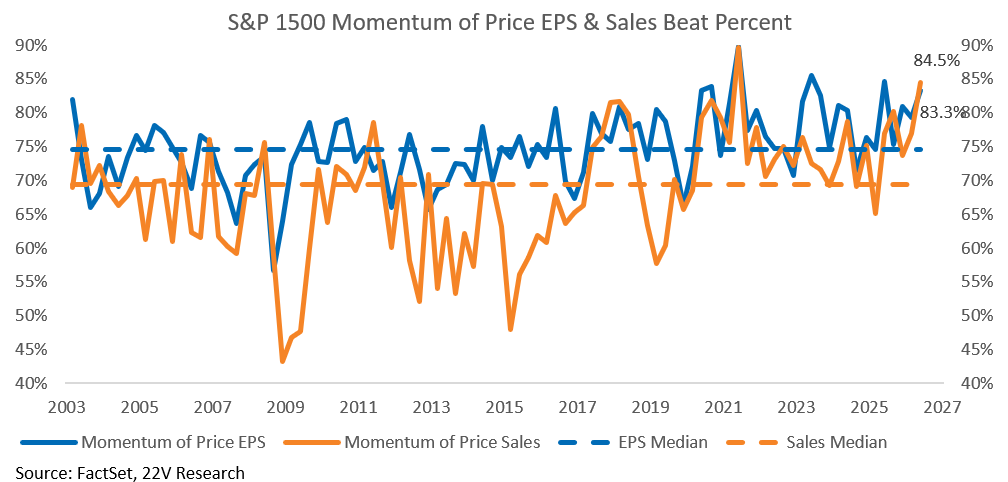
EPS and Sales beats for the Price Momentum factor, which is essentially the same basket as the AI buildout beneficiary baskets, are unusually high. Fundamental factors have unusually strong EPS beat rates as well. A move away from a Risk Averse factor regime would benefit Price Momentum along with Earnings Momentum, Earnings Risk, Growth Momentum and GARP. It is not just a Price Momentum call.
Healthcare, Industrials and Tech have the highest beat rates by sector.
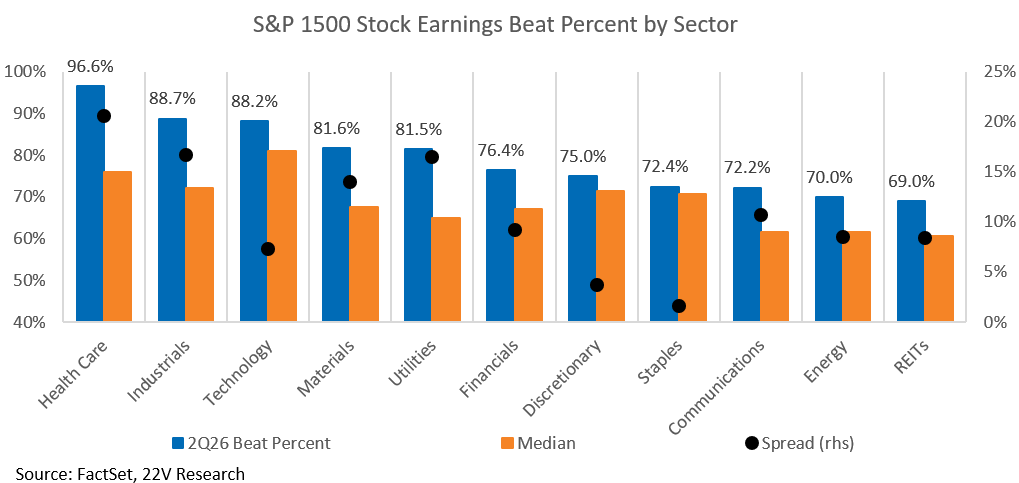
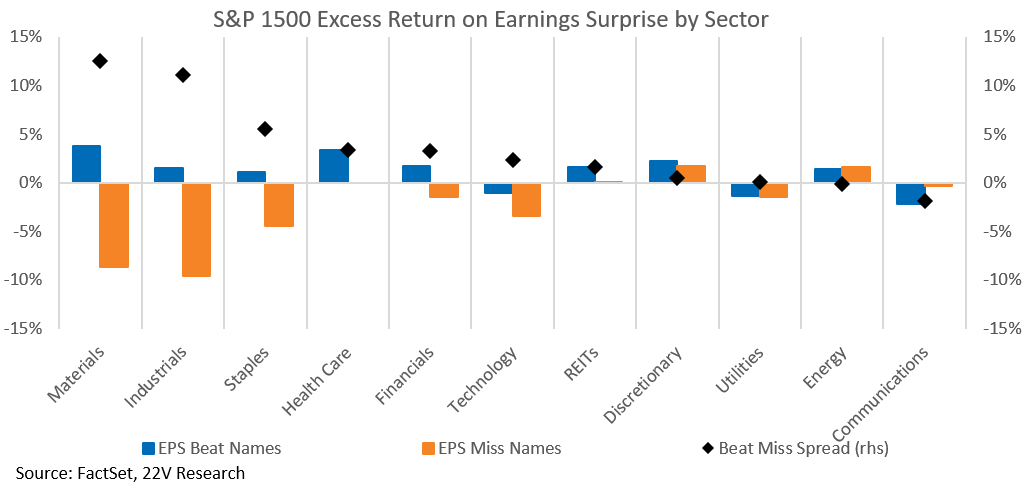
Dispersion is most interesting in Materials, Industrials and Staples.