Back Portfolio Strategy

Fade Risk Averse Positioning

Published on August 3, 2026

∙ Download the PDF Report

By

Dennis DeBusschere

Kevin Brocks

Sophia Wang

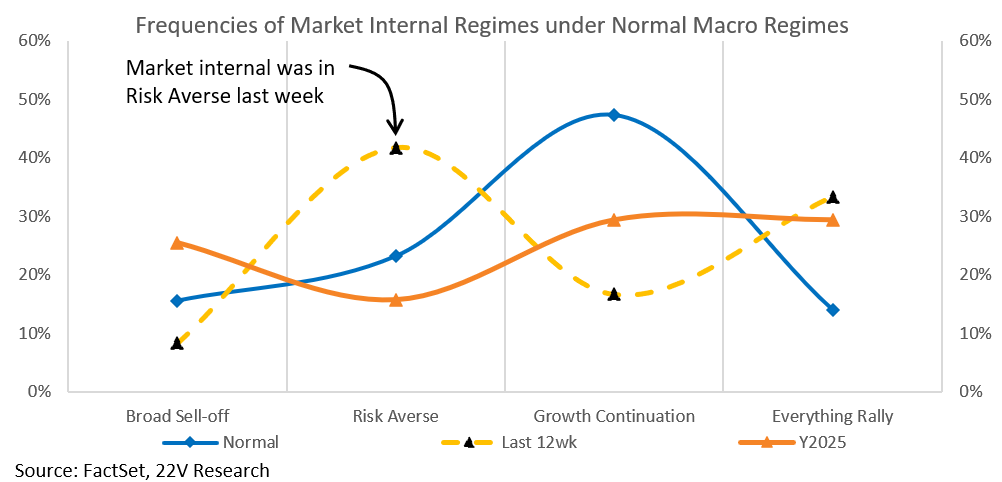
DAILY STRATEGY: Main Point 1) Fading Low Earnings Vol and other Risk Averse Factors are more interesting NOW. – Last week the market regime, which is based on how factors trade together, was classified as Risk Reverse. Risk Averse regimes are the most frequent internal regime over the past 12 wks. Over that period, uncertainty over the sustainability of the AI build out increased, oil prices increased and most recently, 10yr volatility increased. The Low Earnings Volatility factor delivered the strongest active returns.

Now seems like a good time to fade the Low Earnings Vol or Risk Averse factor outperformance. Earnings Season has lowered near term AI buildout risk and the 10yr increased 4.73%. The highest level in almost two years. We have highlighted the asymmetric risk related to 10yr yields (HERE), and that risk cuts both ways now. Any relief in yields is likely to be associated with upside for fundamental factor (an inline payroll report would be a relief for yields. Consensus estimates are not hawkish). On the fundamentals, Hyperscalers reinforced AI capex estimates and Spot pricing for compute sits near the highs (HERE). From Dauvin Peterson “Demand is growing quickly, and open-source models are increasing the compute needed to host and provide multi-model platforms. Combined with continued downward pressure on token prices, we view this as a net positive for neo-clouds and data-center builders.”

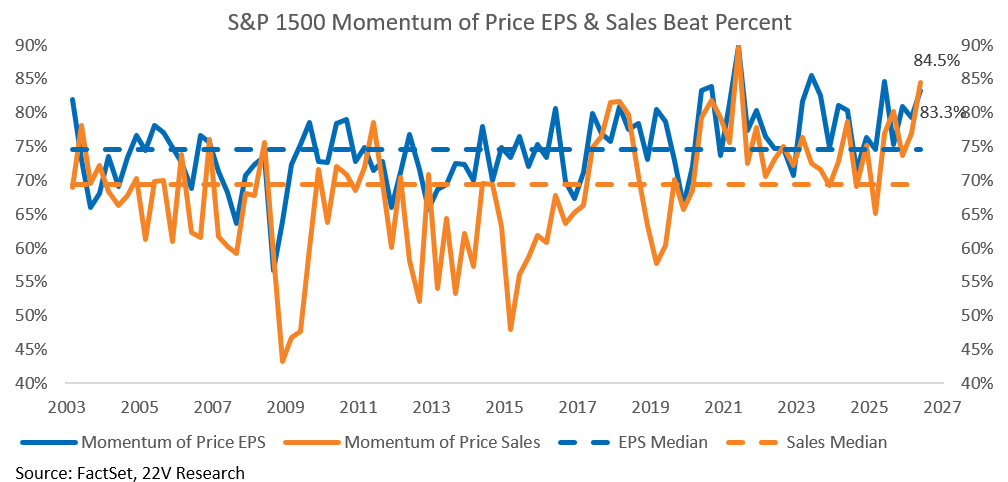
EPS and Sales beats for the Price Momentum factor, which is essentially the same basket as the AI buildout beneficiary baskets, are unusually high. Fundamental factors have unusually strong EPS beat rates as well. A move away from a Risk Averse factor regime would benefit Price Momentum along with Earnings Momentum, Earnings Risk, Growth Momentum and GARP. Its not just a Price Momentum call.

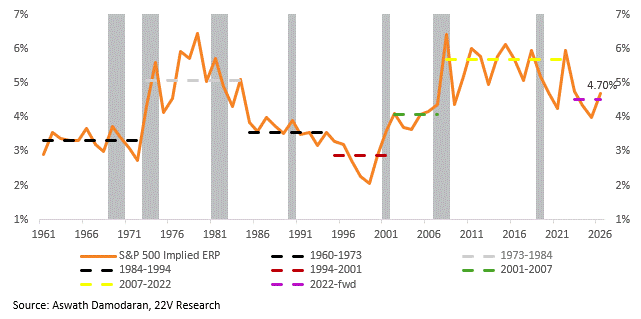
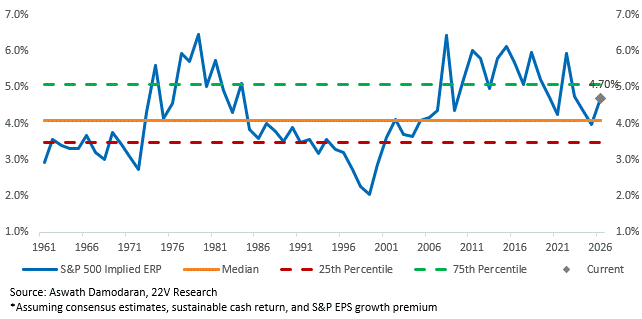
Main Point 2 – As Gerard JUST pointed out in a note (HERE) and we highlight in many charts below, Index level data more than fully confirm the signal from the National Accounts data, that profitability is holding up quite well outside the AI-related leadership. At the same time, the implied equity risk premium has increased (PEs have compressed some). Implied equity risk premium, the expected cash return yield relative to 10yr yields, is above the post COVID median and close to the 75th%tile longer term. The risk is not that the market is overvalued; the risk is a sudden deterioration in EPS growth. Most investors we talk to assume this will come from the circular financing related to AI coming undone (HERE) or a shock move higher in UST yields.

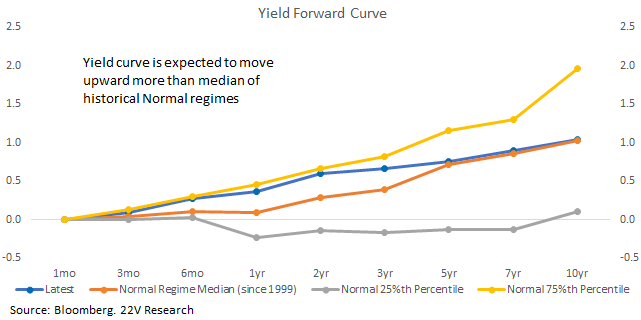
Main Point 3 – Forward rates point to further increases in the 10-year yield and a curve materially steeper than is typically observed during historical Normal regimes, particularly over the next three years. That should be a significant support for Banks, ASSUMING, inflation is not problematic over that same period. Our view of non-problematic is inflation, for the rest of 2026, is below 3.3% on Core PCE. A decrease in supply shocks (Oil prices lower) risk is necessary as well.

Charts…

We have been trading in a risk averse regime. We would fade that now.
The Implied equity risk premium is slightly elevated relative to the post COVID regime…
…but unusually elevated relative to the long term history.
Forward rates point to further increases in the 10-year yield and a curve materially steeper than is typically observed during historical Normal regimes, particularly over the next three years. Good for banks assuming core inflation is “non-problematic”.
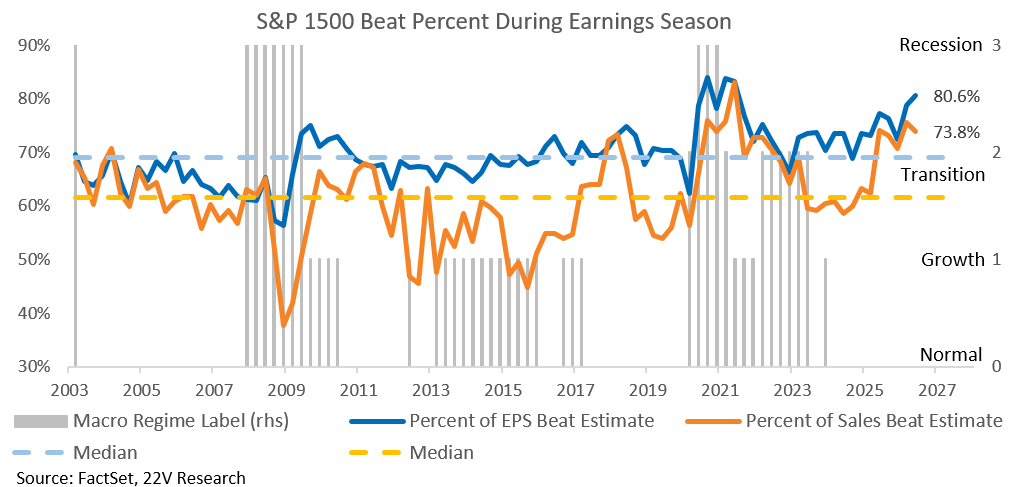
Earnings have been unusually strong in 2Q.
A graph of a graph showing the amount of earnings

AI-generated content may be incorrect.

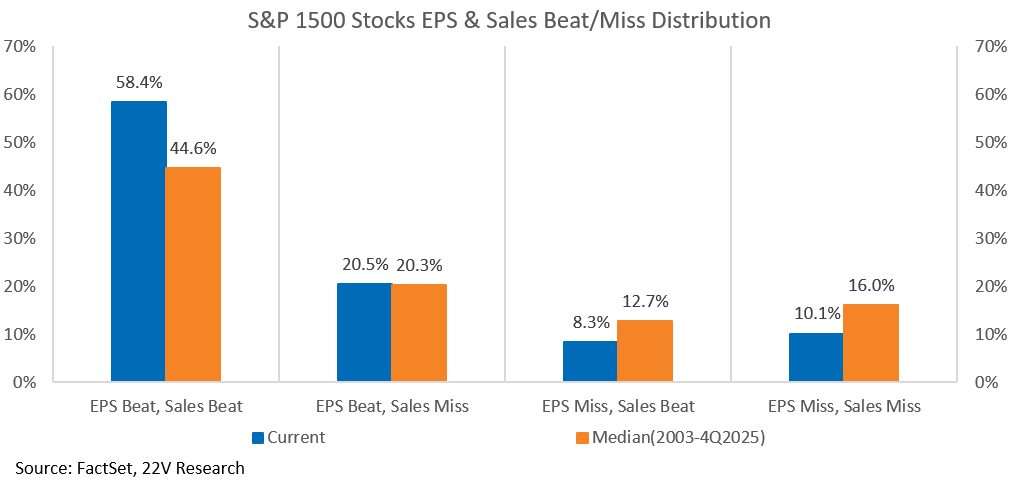
58.4% of stocks are beating on EPS and Sales in 2Q. Vs 44.6% historically.
A graph of sales and sales distribution

AI-generated content may be incorrect.

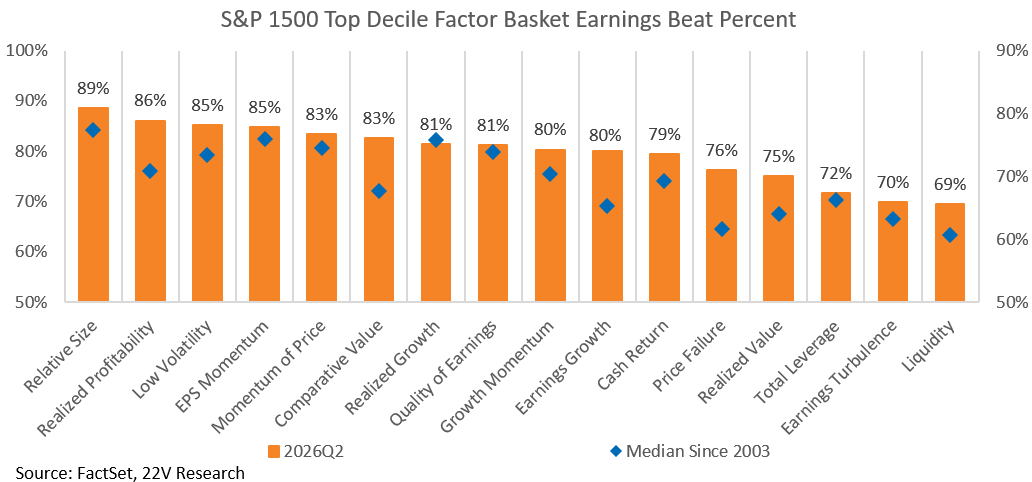
Fundamental factors have unusually high beat rates relative to history. We favor fundamental factors now.
A graph of numbers and numbers

AI-generated content may be incorrect.

Price Momentum fundamentals are strong.
A graph of sales and sales

AI-generated content may be incorrect.

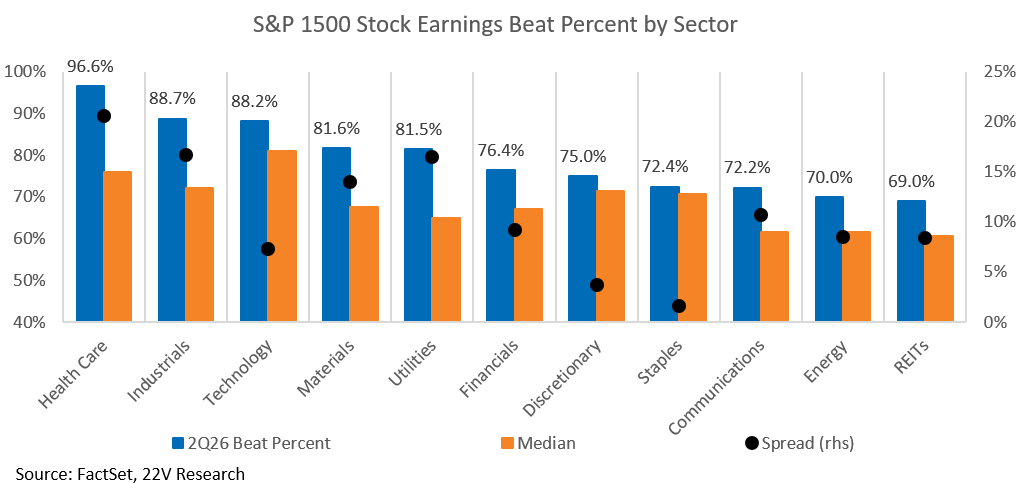
Healthcare, Industrials and Tech have the highest beat rates by sector.
A graph of blue and orange bars with black dots

AI-generated content may be incorrect.

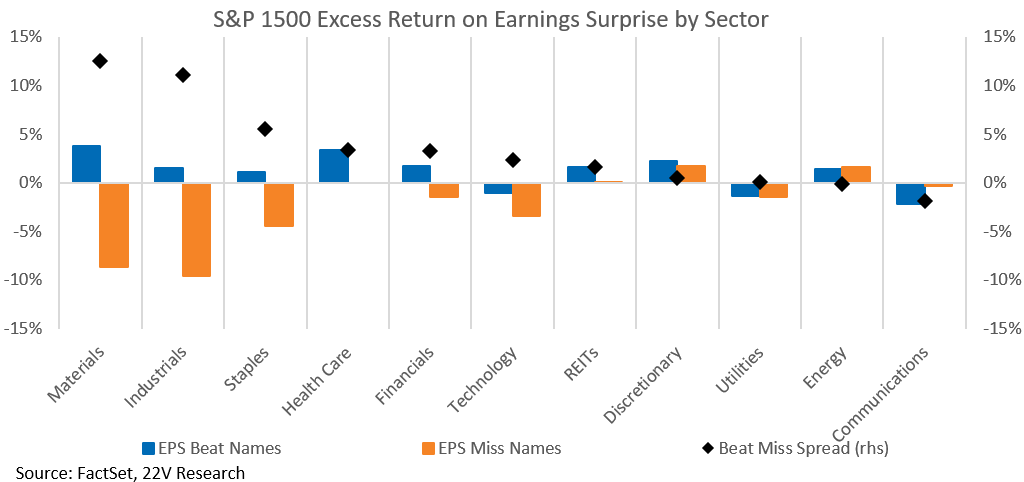
Dispersion is most interesting in Materials, Industrials and Staples.
A graph of numbers and graphs

AI-generated content may be incorrect.

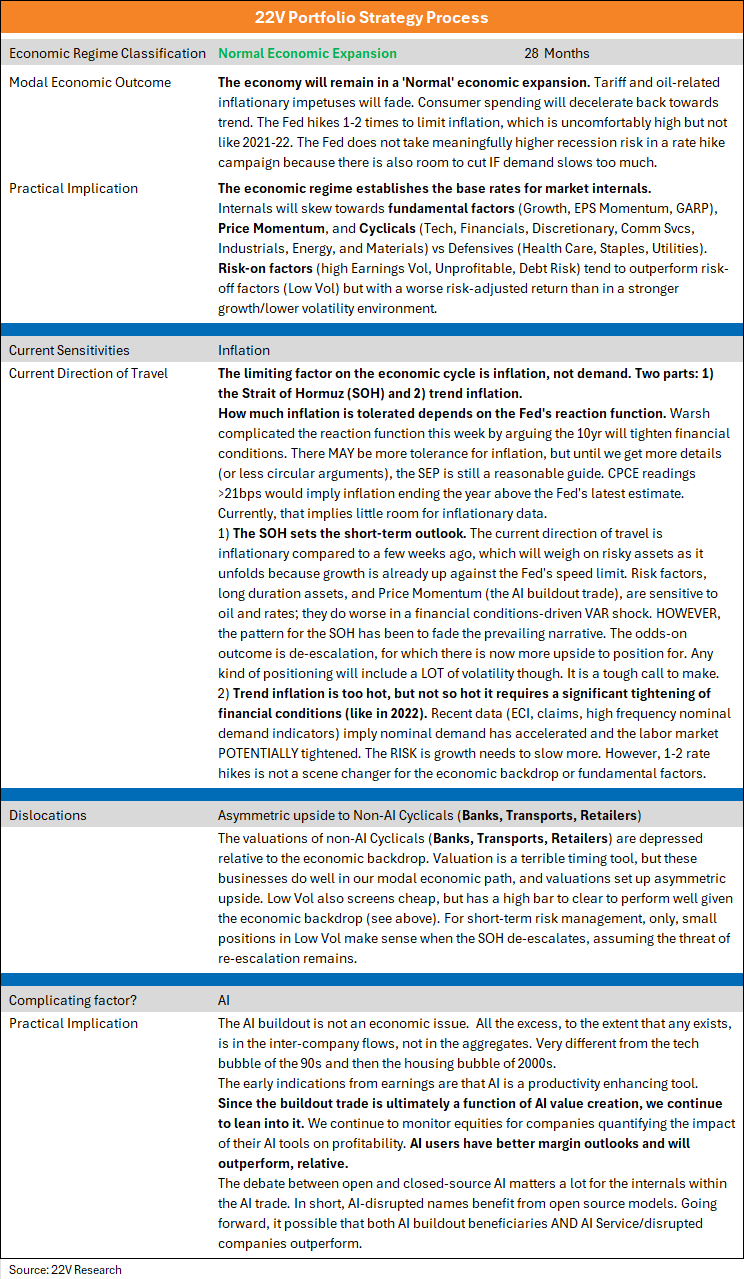
OUR PROCESS: Going forward, Monday’s notes will focus on the overall process we anchor to. The below graphic details the medium to longer-term outlook (6+ months) for equity internals based on the current economic backdrop, the modal outcome for the economic backdrop, and the sensitivities of the backdrop. When we mark to market our views based on new market and macro data, and talk about short-term risk management, it is always relative to what our background process implies. Below is an effort to lay out the background process in detail.
DISCLOSURES AND DISCLAIMERS

Analyst Certification

The analyst, 22V Research Group, primarily responsible for the preparation of this research report attests to the following: (1) that the views and opinions rendered in this research report reflect his or her personal views about the subject companies or issuers; and (2) that no part of the research analyst’s compensation was, is, or will be directly related to the specific recommendations or views in this research report.

Analyst Certifications and Independence of Research.

Each of the 22V Research analysts whose names appear on the front page of this report hereby certify that all the views expressed in this Report accurately reflect our personal views about any and all of the subject securities or issuers and that no part of our compensation was, is, or will be, directly or indirectly, related to the specific recommendations or views of in this Report.

22V Research (the “Company”) is an independent research provider. The Company is not a member of the FINRA or the SIPC and is not a registered broker dealer or investment adviser. 22V Research has no other regulated or unregulated business activities which conflict with its provision of independent research.

22V Research, LLC is a professional services and independent publication organization. 22V Research, LLC is not a securities broker-dealer, not a member of the Financial Industry Regulatory Authority (FINRA), not a registered investment advisor (RIA) and not a member of SIPC.

Securities transactions, when offered, are offered by 22V Securities, LLC through LPS Capital, LLC. Certain employees of 22V Securities, LLC are dually registered as securities representatives of LPS Capital, LLC or Analyst Hub Securities, LLC. 22V Securities, LPS Capital and Analyst Hub Securities are members FINRA, SIPC.

https://brokercheck.finra.org/

Current Ratings Definition.

SECTOR OUTPERFORM: An “outperform” rating anticipates the company will outperform the S&P Regional Banking Index (peer group).

SECTOR PERFORM: A “market perform” rating anticipates the company will perform in line with the S&P Regional Banking Index (peer group).

SECTOR UNDERPERFORM: An “underperform” rating anticipates the company will underperform the S&P Regional Banking Index (peer group).

Limitation Of Research And Information.

This Report has been prepared for distribution to only qualified institutional or professional clients of 22V Research Group. The contents of this Report represent the views, opinions, and analyses of its authors. The information contained herein does not constitute financial, legal, tax or any other advice. All third-party data presented herein were obtained from publicly available sources which are believed to be reliable; however, the Company makes no warranty, express or implied, concerning the accuracy or completeness of such information. In no event shall the Company be responsible or liable for the correctness of, or update to, any such material or for any damage or lost opportunities resulting from use of this data. Nothing contained in this Report or any distribution by the Company should be construed as any offer to sell, or any solicitation of an offer to buy, any security or investment. Any research or other material received should not be construed as individualized investment advice. Investment decisions should be made as part of an overall portfolio strategy and you should consult with a professional financial advisor, legal and tax advisor prior to making any investment decision. 22V Research Group shall not be liable for any direct or indirect, incidental or consequential loss or damage (including loss of profits, revenue or goodwill) arising from any investment decisions based on information or research obtained from 22V Research Group.

Reproduction And Distribution Strictly Prohibited.

No user of this Report may reproduce, modify, copy, distribute, sell, resell, transmit, transfer, license, assign or publish the Report itself or any information contained therein. Notwithstanding the foregoing, clients with access to working models are permitted to alter or modify the information contained therein, provided that it is solely for such client’s own use. This Report is not intended to be available or distributed for any purpose that would be deemed unlawful or otherwise prohibited by any local, state, national or international laws or regulations or would otherwise subject the Company to registration or regulation of any kind within such jurisdiction.

Copyrights, Trademarks, Intellectual Property.

22V Research Group, and any logos or marks included in this Report are proprietary materials. The use of such terms and logos and marks without the express written consent of 22V Research Group is strictly prohibited. The copyright in the pages or in the screens of the Report, and in the information and material therein, is proprietary material owned by 22V Research Group unless otherwise indicated. The unauthorized use of any material on this Report may violate numerous statutes, regulations and laws, including, but not limited to, copyright, trademark, trade secret or patent laws.
