June PCE and Q2 GDP Point to Strong Underlying Economy
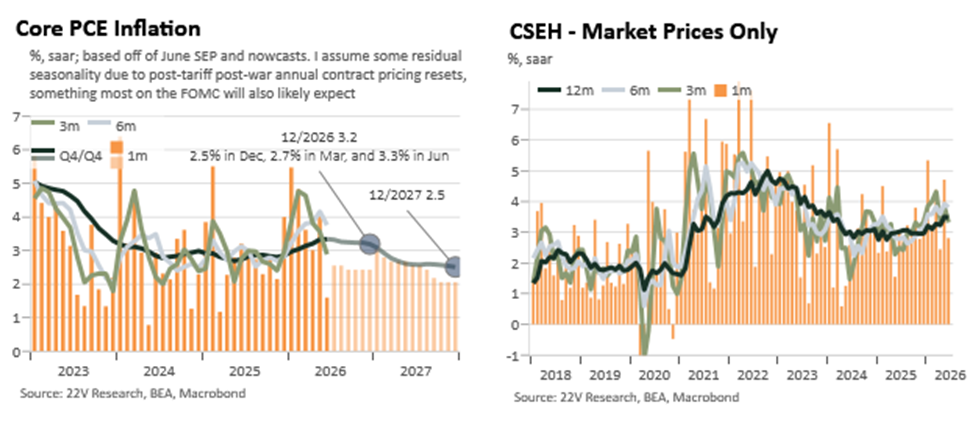
- June’s core PCE numbers came in a few bps below informed consensus, largely due to softness in the non-market components of core services ex housing. The print was solid enough anyways but as a source of a beat this is the least cyclically informative.
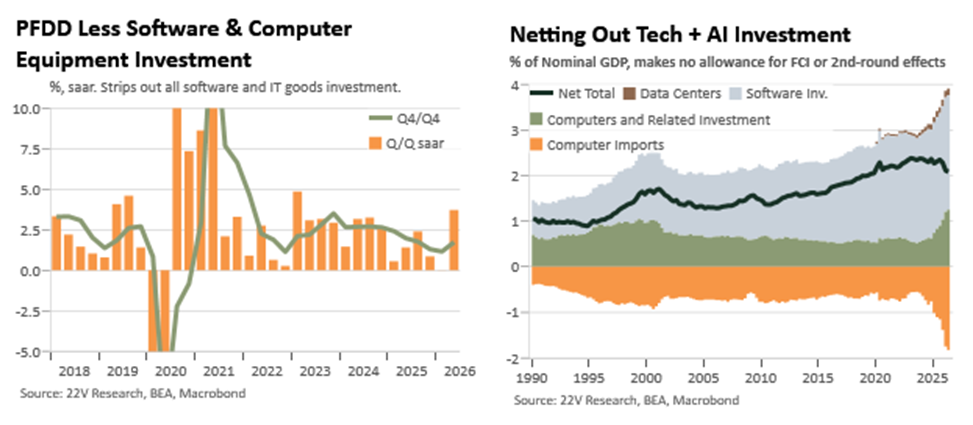
- Q2 GDP came in slightly softer than expected but the underlying domestic demand signal was appreciably stronger with private final domestic demand growing 3.9%, its strongest pace since ‘23Q1 (also true for PFDD ex-software and IT goods investment).
- Discretionary spending growth has notably strengthened in recent months, a signal clear enough in earnings season too, taking it back towards peak post-reopening pace as tariff-related drag seems to wearing off.
- As we have noted at other times recently, nominal domestic demand growth simply seems too strong to be consistent with an imminent return of inflation to target.
- For the Fed this data will do little to shift views on net. Assessments of underlying economic strength probably firmed a bit, building on recent trends, and one month of pretty good inflation news, amid war and tariff-related whipsaws, is hard to extract too much signal from on its own.
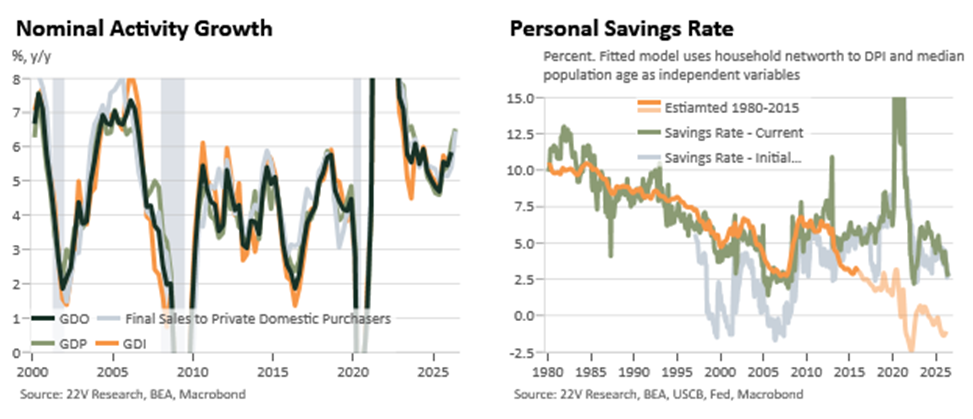
Across the data released this morning, the acceleration in nominal private final domestic demand makes the point most clearly and concisely. Since cyclically troughing in early 2025, nominal domestic activity has been moving higher and is now running at its fastest y/y pace since before the global financial crisis. With very modest labor supply gains feasible due to demographics, 6.5% nominal growth is inconsistent with inflation returning to target unless we see the strongest productivity growth in US economic history (crudely, NGDP = inflation + productivity + hours worked). The strength of the economy seems to be fundamentally inconsistent with inflation returning to target on any acceptable timeline unless productivity growth during surges to 1990s levels or faster. The Fed could accommodate such strong activity growth then because the productivity growth was being seen in real-time, now it is more hoped for / expected than realized as far as the aggregate economy goes.
Gas price relief and some retail sales related noise (World Cup, Prime Day moving from July into June) suggest that NGDP growth will slow a little bit from here into Q3 but it is unlikely to be a truly meaningful deceleration (although we should not lean too much on an “ex the shocks” approach to any macro data given those methods failures this whole cycle). Data from V and MA suggest that spend trends have decelerated a bit into July but transactions counts remain very strong.
At the household level, spending is growing somewhat faster than income growth. I wouldn’t expect that this will necessarily lead to an imminent retrenchment in spending though. Strong corporate profits are supporting net worth and keeping the wedge between GDI and GDO somewhat smaller. Reasoning from a declining household savings rate has historically been fraught as household income trends to be revised higher. At the current moment, that is accentuated by the aging population and extremely high level of household net worth which taken on their own would suggest a slightly negative savings rate at present had historical relationships held. I don’t take these observations as ‘fact’ but rather that we should be cautious about reasoning from savings rate-based in real-time given starkly different fundamentals than in prior cycles; the recent improvements in household credit conditions (delinquencies are falling and survey measures of BS health improving) suggest that the strength in spending is not coming with increasing household financial stress. That households keep seeing net acquisitions of financial assets similarly suggests that their funding position remains fine.
June’s core PCE data came in slightly softer than the informed consensus expected but this came in the not-particularly-meaningful non-market core services categories. Zooming out a bit there are too basic inflationary issues. First, the overall indices are running too hot with many potentially one-off shocks playing large roles in the most recent acceleration in the overshoot. Second, the Fed’s historic emphasis on core services ex housing inflation, if continued into less helpful times, should now be flashing a yellow light, at least. Noisy non-market prices were responsible for the meaningful downside on the month. Stripping them out shows a less good June (still above a target consistent pace IMO), and a much clear recent reacceleration.
The GDP growth data showed an upside surprise in all the components of ‘core’ private final domestic demand. Household consumption was strong, investment was strong across categories, and this held even when stripping out the main, if not only, direct impacts of the AI boom. Q2 saw the strongest pace of private final domestic demand ex software and IT goods investment since ‘23Q1 after a sluggish past year. I doubt the positive boost from residential investment will continue given rates moves higher over the quarter and the high frequency data but beyond that growth does seem to be broadening out (something Chair Warsh said he was watching and hoping for in yesterday’s press conference).
The AI boom is benefitting the US economy through higher PFDD but it is also leaking into the rest of the world through the surge in imports as well. The analog to stimulative fiscal policy during a normal or overheated economy, where real multipliers are quite small due inflationary and rates offsets, is imperfect but illustrative with the effects from the AI clearly supporting RoW production, which partially circles back to US corporates and households through overseas earnings.