DAILY STRATEGY: Main Points – 1) For those that interested in what is in front of us in macro. If the consensus is correct for payrolls this Friday (4.2% urate, so flat MoM, and a still very low labor participation rate of 61.6 and +80k headline payroll) 10yr yields should remain stable and support risk assets. That would not be a hawkish report.
2) For those interested in how the longer-term direction of travel is unfolding, it is getting more positive for the overall market. 8500 on the S&P is possible. Below is why. This is long for a daily report, but a ton has happened over the last few weeks. Please read. Thanks.
Economic data continues to be trend well above 2% real and this week’s economic data reinforced that (PMIs, JOLTs, high frequency demand indicators, HERE). Earnings data continues to come in much better than expected and is the fundamental driver of the market. The constraint on the market and economic cycle is inflation. Not lack of economic demand or poor company fundamentals. Elevated inflation risk is why the overall market and most fundamental factors and Cyclicals sectors trade inversely with 10yr yields (more HERE). Oil prices and 10yr yields have moved lower this week, clearing the way for investors to focus on strong fundamentals.
Our call for 2H26 is that core inflation will slow some, leaving the Fed to hike MAYBE one time and 10yr yields ~4.5% range. With implied equity risk premiums relatively high and corporate earnings much better than expected, upside to equity markets has increased (8500 on S&P 500 is possible) if our inflation and 10yr call is correct and AI continues to support margins. Cyclicals and fundamental factors (EPS Momentum, Expected Growth, Value, GARP) have increased tailwinds. Non-AI Cyclicals (Retailers, Regional Banks, Transports) are particularly interesting now. We are long Risk-On vs Risk-Off Factors, which is a tradable basket through Morgan Stanley (MS22RISK Index on Bloomberg).
A nuance to our framework following the FOMC meeting. Asymmetric risk has increased, both ways, if 10yr yields are going to do the heavy lifting in tightening or easing financial conditions (HERE). If Core PCE comes in above the 3.3% level (higher than what we would expect, so bad for our call), that would be a problem for risk assets. 10yr yields might increase well above the 4.7% level (investors point to 5% as the problem for risk assets HERE) and markets will have more downside.
The risk is that economic demand is too hot, so nominal GDP stays above 6%. That would lead to much higher 10yr yields than our assumption of ~4.5% between now and year-end. The unemployment rate moving well below 4.2% (payroll report is Friday) would be hawkish. 10yr yields increase. Inflation data itself is next week and the data from CPI/PPI need to imply .21bp MoM or below for Core PCE for 10yr yields to remain stable.
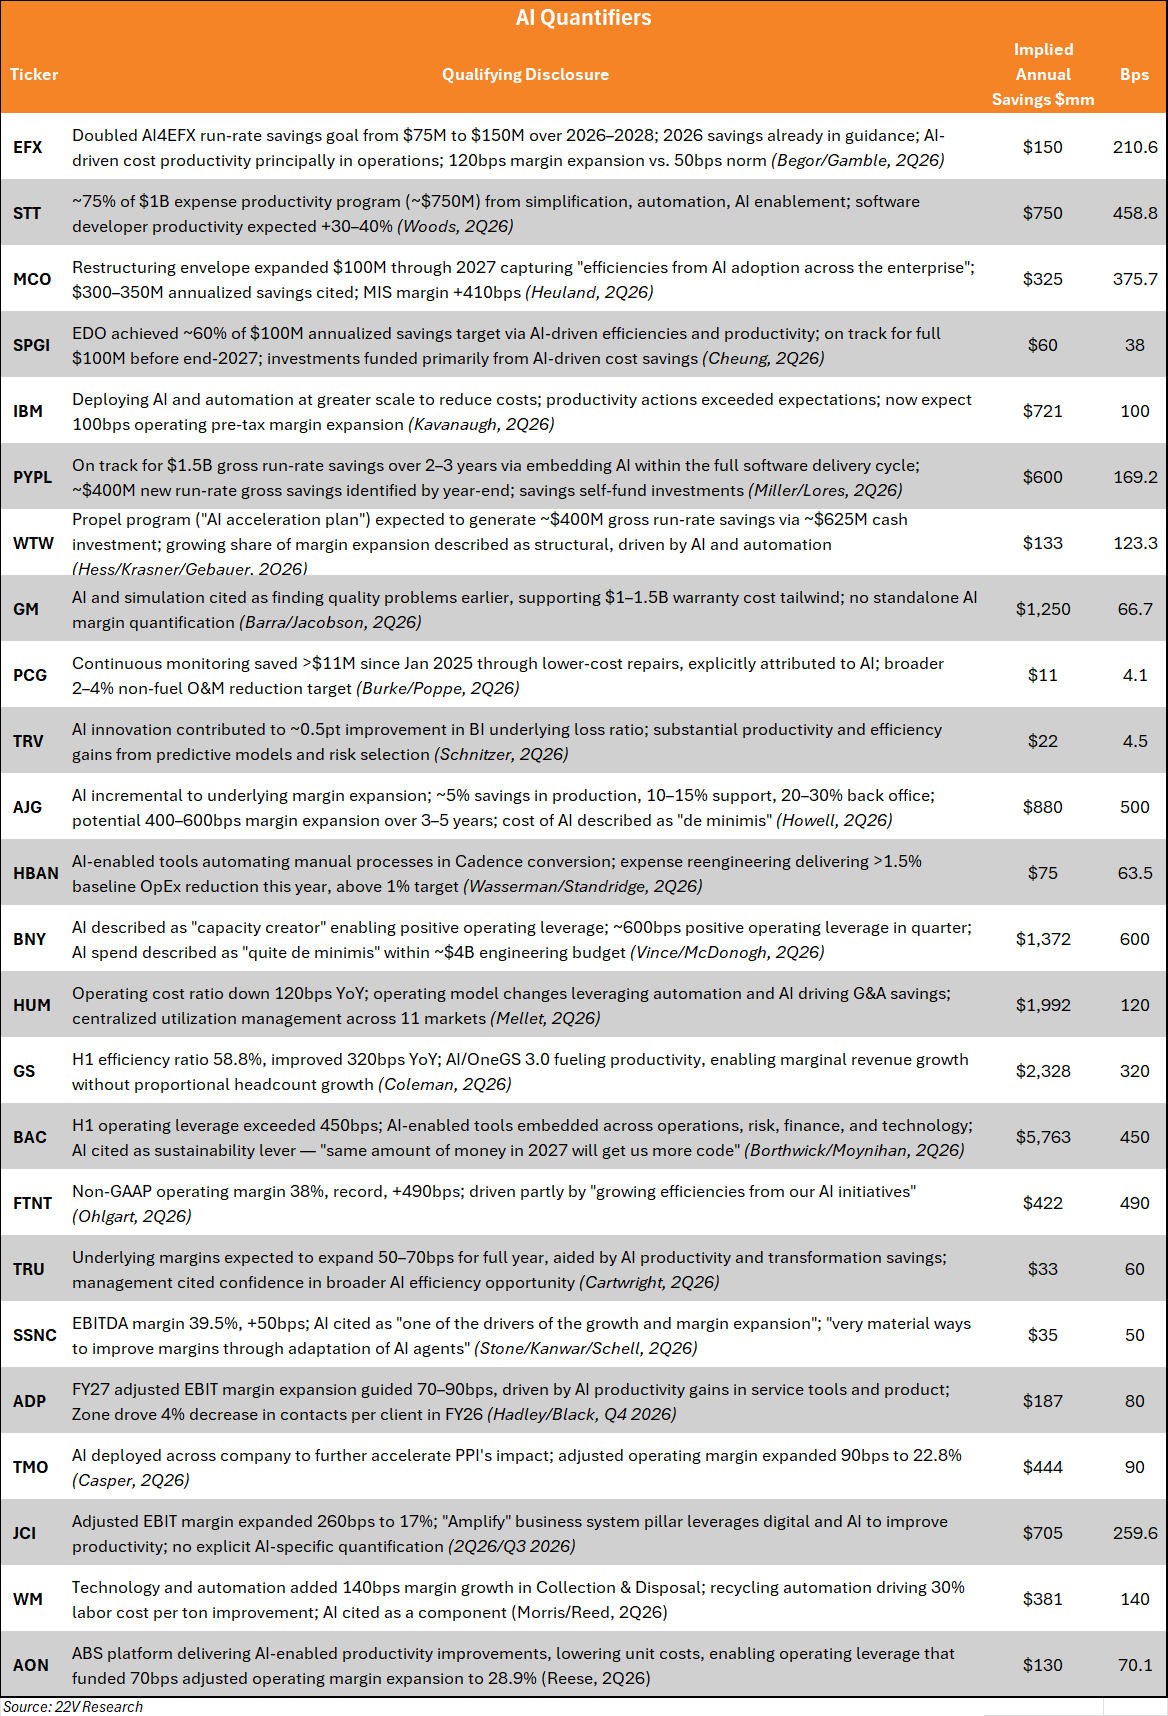
AI QUANTIFIERS: We have emphasized that the performance of AI buildout beneficiaries and AI users is ultimately a product of the ROI of AI (HERE). The overly simplified version is if AI boost margins, there will be more demand for it. Concerns over a semis earnings growth bubble would be overblown. To help measure this, we track margin sentiment and use consensus margin estimates, and we also review earnings transcripts for management teams quantifying an estimated impact from AI (the ‘AI Quantifiers’), then applying the results to our valuation work.
So far this quarter, 25 companies have quantified the impact from using AI (list at the end of this report). In aggregate, those 25 companies guide to ~180bps of margin improvement. That is already more quantifiers than last quarter, with a larger impetus to margins (80bps last quarter). Several of the companies lumped AI together with other cost saving initiatives, so 180bps is likely too high. Ex those messier names, the margin improvement was ~100bps. We don’t want to ignore a subset of the Quantifiers, so haircutting the messier the names and blending them with the cleaner reads, unscientifically, implies something like ~150bps of margin improvement. Direction matters more than precision in these early estimates, and the direction is towards more AI users reporting better margin improvement than last quarter.
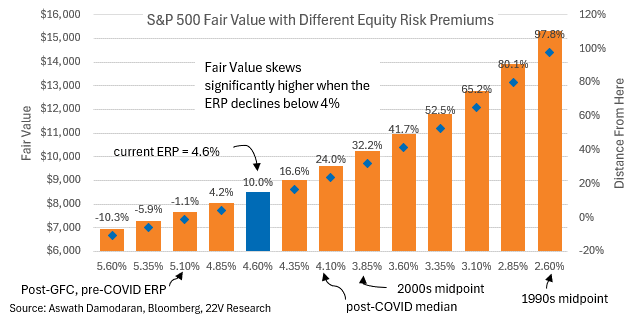
Extrapolating 150bps of margin improvement to the index* would imply a minimum of ~+10% upside to S&P 500 Fair Value. There are two direct ways that cost savings increase fair value – a higher path of earnings and a higher long-term cash return ratio (because cash return is a function of ROE). Together, that’s worth +740 points (+10%), with upside if cash return is higher**. The equity risk premium would also move lower (fair value higher), an indirect result but one we have high conviction in. The equity risk premium is more difficult to model, so we provide a range of estimates; the magnitude of the impact would be another +~10% to as high as another +~50%.
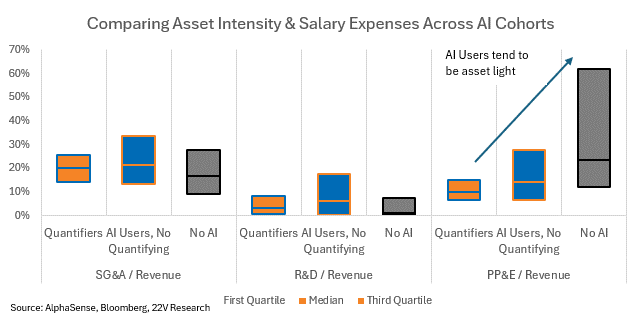
*Extrapolating 150bps of margin improvement assumes that AI is helpful across different business models. Examining Property, Plant & Equipment expenses, R&D, and Sales, General & Administrative expenses across the lists of Quantifiers, AI Users with no quantification, and no AI usage shows AI usage is concentrated in asset light businesses (low PP&E revenue). This is a risk that we will monitor. Again, it is early.
Details and charts…
Applying the 150bps of margin improvement across the next three years of consensus estimates improves the EPS path from…
2026: $349 to $374
2027: $408 to $436
2028: $467 to $497
We know 150bps across the index won’t happen this year. We aren’t calling for that outcome, we are laying out an anchor point given the current trends. The practical implication is that current equity valuations are not stretched, and that the skew to index-level returns is higher.
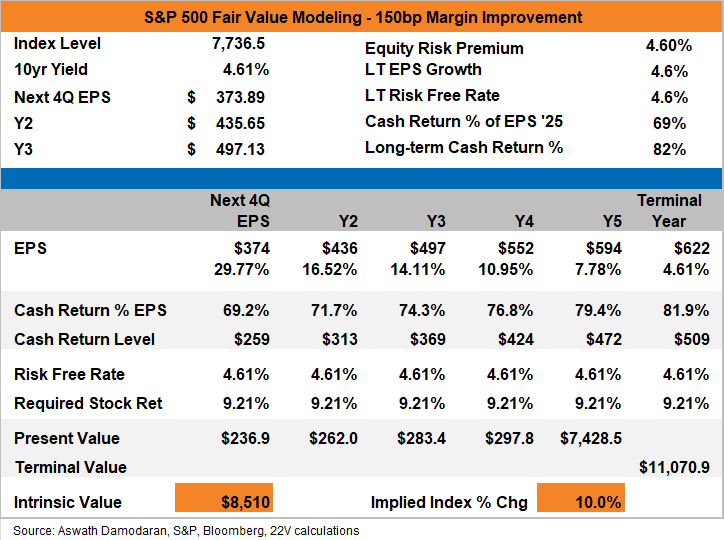
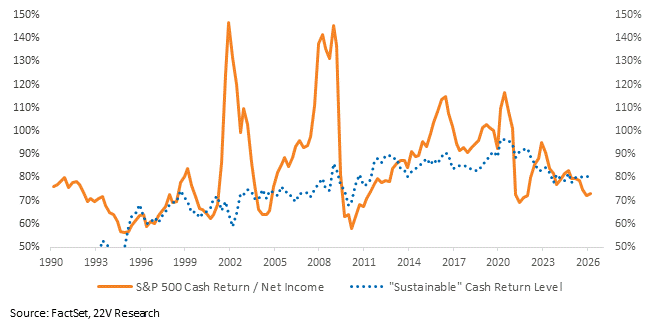
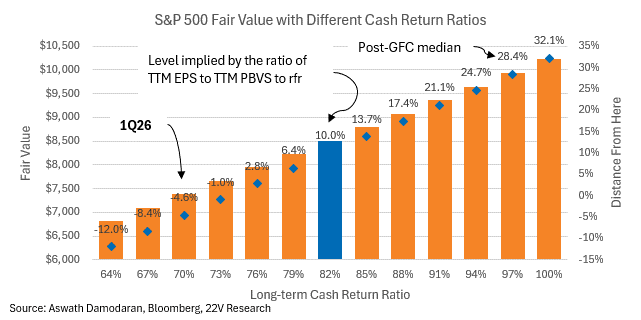
** The cash return ratio would increase from 79% to 82%, assuming the index retains what it needs to grow earnings at the risk-free rate and returns the rest as cash (the “sustainable” level). We will stick to that number in our fair value model, but we have high conviction that cash return would increase above what is modeled. It has frequently tracked above the modeled “sustainable” level (chart below) in the past, and it seems a safe bet that fresh all-time high margins would lead to a cash return higher than its 55th percentile. We include a bar chart of Fair Value using different cash return ratios to offer different anchor points.
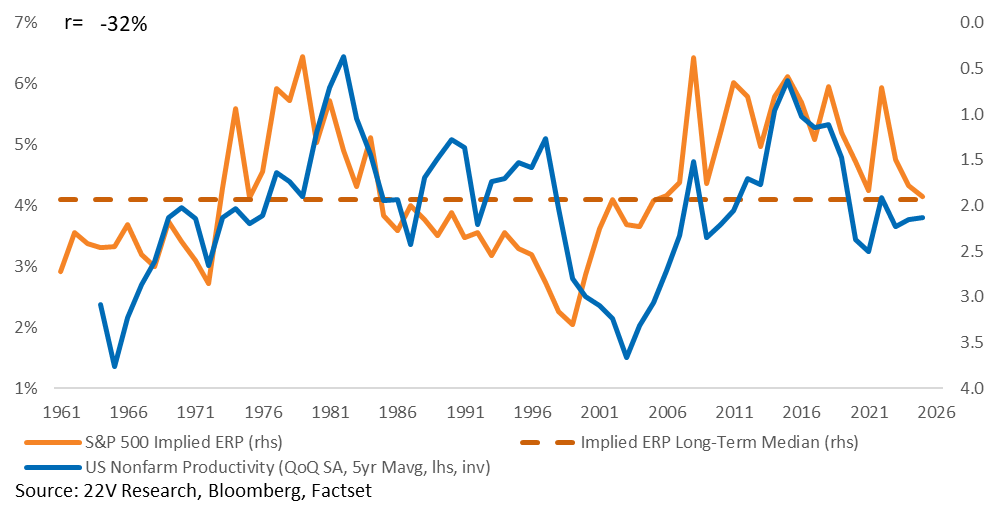
We do not adjust the ERP in the table above, but it is almost certainly going to decline. The ERP has moved in ranges based on productivity in the past. Better productivity = higher valuations. It is possible that the ERP would fall to a range more consistent with the 1990s or 2000s, a period of high productivity growth. That opens additional upside in a range of +~10% to as high as +50%. Estimating an ERP based on productivity would be false precision – the practical implication is higher fair value, with a tail to much higher fair value.
FAIR VALUE EXPLAINER: We value the index using a DCF model, discounting aggregated dividends and buybacks. It is based on the work of valuation guru Aswath Damodaran. He has a great resource on his implied equity risk premium HERE.
QUANTIFIERS: We use an LLM to filter through earnings transcripts for management teams referencing specific numbers for AI ROI – margins explicitly or cost savings that we can calculate margins from. The list, alongside summaries of the quantifications, is below.