Weekly – Per the new format, we mark to market our main themes each week. Themes are bolded and market to market follows.
New THEME – 10yr Volatility Is Higher: Based on what Fed Chair Warsh said last week, there is a clear preference for short-term borrowing, which the Fed largely governs, over longer-term UST bonds, where moves are based more on market forces. The RANGE on 10yr yields is wider as a result. A 10yr yield well above 4.7% (close to 5%) on hawkish data is possible and well below ~4.3% on dovish data. The move higher in 10yr yields, inflation breakevens, and term premia are consistent with investors pricing in 1) stronger economic growth with persistently higher inflation, and 2) a Fed chair that wants to talk inflation down vs raise rates. At least for now.
Expect Higher Volatility In Long Duration Equities (Consumer Durables, Homebuilders, and high Debt Risk) if inflation remains well above target, these names will suffer. Lower oil prices or a dovish payroll report this Friday could lower inflation expectations and would be positive I.e. 10yr bond vol is higher and long duration equities vol is higher. If our call for economic growth is correct – 2% real GDP growth and less hawkish core PCE inflation (tracking below 3.3% YoY for 2026) – long duration assets will do well.
Our call is for a benign slowing of economic growth to the ~2% or below range. That would be consistent with 10yr yields in the 4.2-4.5% range and support duration sensitive equities (Tech, Discretionary, Banks, Consumer) and fundamental factors. Marking to Market – In short, economic growth has not been consistent with our call of a benign slowdown. If August and September remain firm, we would give up on this idea. The implication would be a much higher 10yr yield going forward (4.7% or above) and financial conditions tightening risk. Last Thursday’s GDP data showed private final domestic demand (PFDD) surged to 3.9%, its strongest since early 2023. The 30,000-foot read from Peter Williams (HERE) is that there’s simply too much nominal demand to lower inflation toward the Fed’s target. Growth needs to slow, particularly consumer spending, in the back half of 2026. Consumer spending trends in July HAVE slowed a touch, but the level of nominal GDP growth suggests more upside vs downside risk to 10yr yields.
More Asymmetric Risk for Markets. Both Higher and Lower. Higher AND lower asymmetric risk is new. Before the risk was more one sided (lower): Marking to Market – A move above 4.7% on the US 10yr yield, a level Peter Williams views as more obviously restrictive for economic growth, and $100 oil would likely lead to a risk-off move. Last week 10yr yields and oil prices increased. Asymmetric downside risk to markets increased. We have nuance to our asymmetric risk. We see more upside asymmetric risk. If the energy shock fades quickly (Iran deal) and or we have more dovish data (payroll this week and CPI/PPI on 8/12 are important). 10yr yields would have more downside and financial conditions would ease. Markets are likely to assume a more dovish reaction function.
Before last Wednesday we had confidence that the FOMC would let economic growth slow (if that happened) and keep short rates relatively high (less dovish reaction function). We are less confident that will be the case now. Strong earnings growth and Fed willing to keep financial conditions easy increases the odds PE could expand some.
Data That Support Our Normal Economic & Market Regime Base Case: Marking to Market –
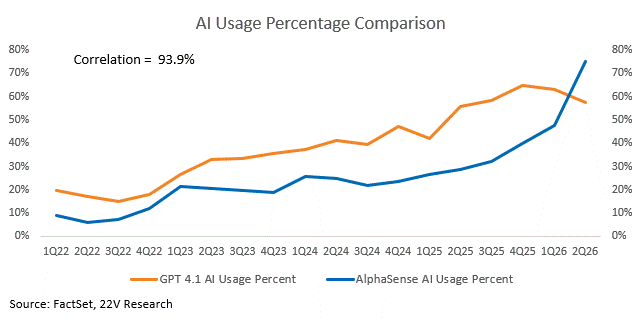
Companies showing productivity and margin gains from using AI tools are really important for the Normal Expansion. If enterprises are not adopting AI tools to increase productivity, risk of a sudden slowing in AI capex increases. With more than 50% of S&P 1500 companies reported, AI usage appears to be accelerating dramatically. Margins have come in better than expected. Plus, an indicator of compute demand is increasing and at a high level. That suggests compute is still tight and demand is high.
The implication is many companies are using AI tools, which is confirmed by AI demand indicators, and that AI usage is associated with improving margins. This is a support for the AI Buildout names longer term.
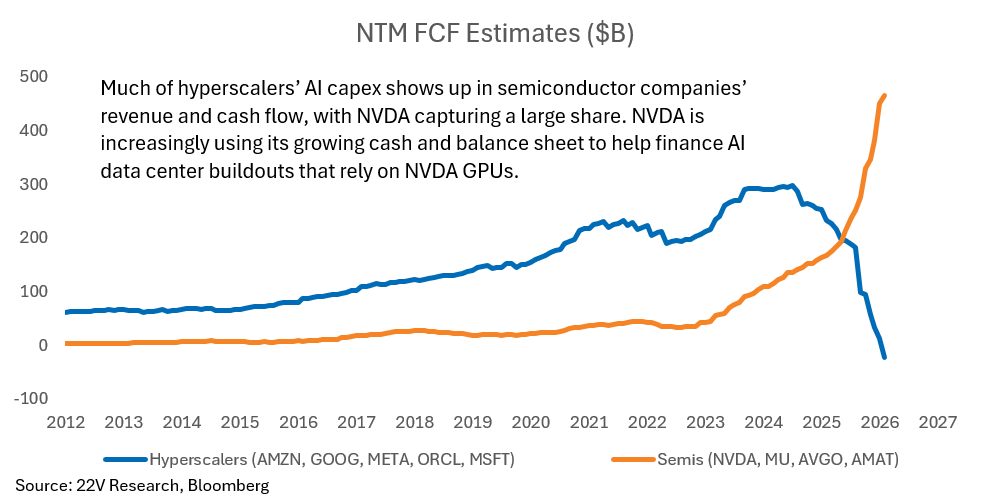
FYI – NVDA’s latest $750B in AI deals is the latest example of the rapidly increasing value at risk in circular deals (HERE), and the risk profile compounds as Hyperscaler free cash flow turns negative. More of the growth in the buildout is being funded by companies that benefit from it, clearly a problem if AI ROI disappoints. FYI – the scale of the current AI buildout is on par with the TMT boom. Capex is not levered as it was then, but the risk to a normal economic expansion would increase if AI usage disappoints.
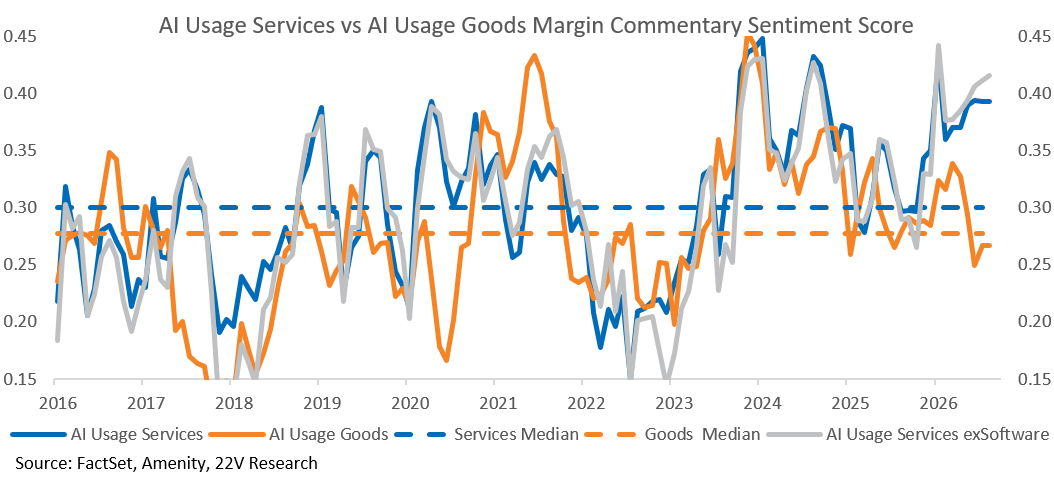
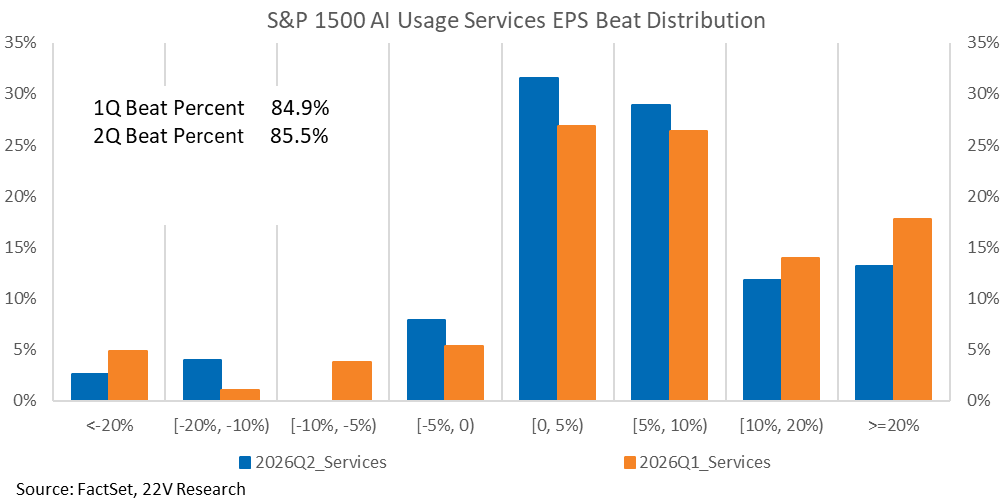
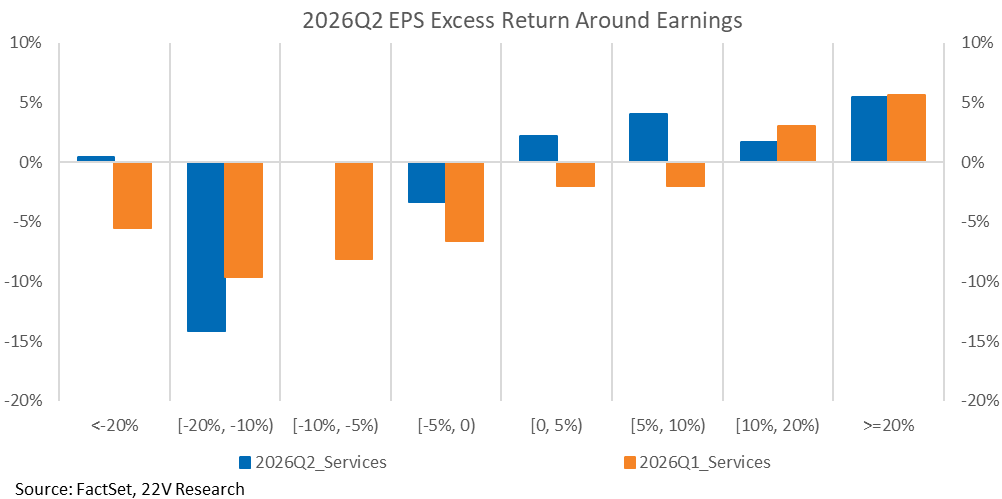
AI Idio is Supportive Based on Demand for AI tools Being Robust Longer Term – We are constructive on Service companies that use AI. High AI usage services are beating EPS estimates at nearly the same rate as last quarter (85.5% vs. 84.9%). This quarter, though, beats are more concentrated in the 0–10% range, and all beat sizes have generated positive average relative performance. Last quarter, by contrast, only beats of 10% or more were rewarded. Further, margin sentiment for the AI service basket has accelerated. That is consistent with margin expansion across the index. AI service companies, with and without Software names included have unusually high margins.
Going forward we would expect AI Goods, which includes semis and the broader AI buildout names, and the AI services basket to both outperform if AI is improving profitability for all companies. The current trends of increasing margins across market caps and strong compute demand support that view (HERE).
We have both Services and Goods available as tradeable swaps through Morgan Stanley: MS22AISV Index and MS22AIGD Index on Bloomberg, respectively.
Charts related to the comments above are below…
This helps to inform our views on asymmetric risk. Chair Warsh repeatedly affirmed the Fed’s commitment to price stability but declined to specify what conditions would trigger future action, and further rattled markets by suggesting the 2% inflation target could evolve over time while refusing to name the alternative measures he prefers — a signal many read as a risk of continued inflationary selectivity. Inflation breakeven increased as result.
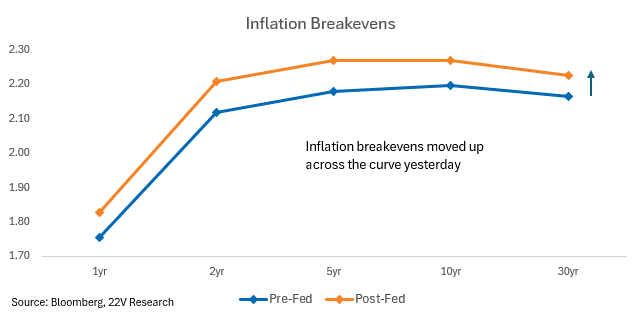
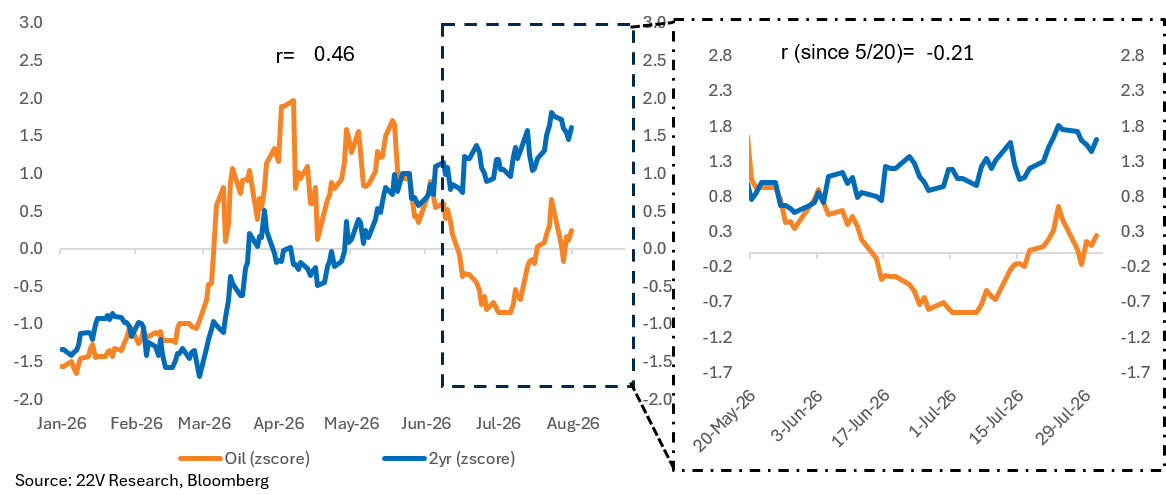
Related, changes in oil prices have had a large impact on Fed rate hike expectations and 2yr yields. Oil prices swings should be more impactful on the 10yr going forward. The selloff in nominal yields was driven by inflation breakevens across all maturities, a sharp change from recent moves, along with an extremely sharp steepening in real yields.
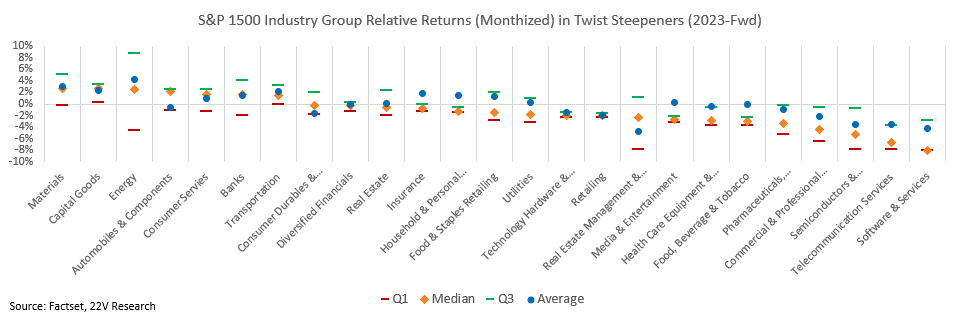
Lower 2yr yields and higher 10yr yields following FOMC meeting represent a twist steepener. If that trend continues, history (5 observations) suggests Value has outperformed with the strongest median and average returns, while risk-on has generally beaten risk-off despite high volatility. Growth and Momentum have tended to lag.
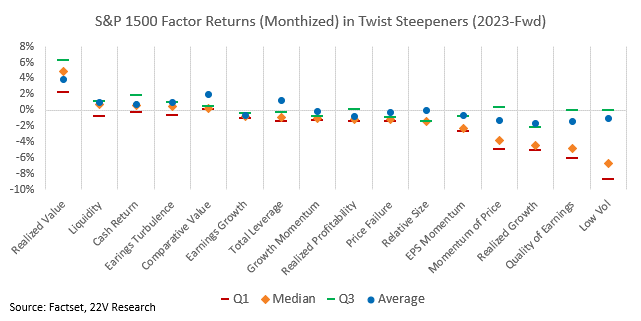
In industry group terms, best for Deep Cyclicals (Materials, Cap Goods, Energy, Transports) and consumer-facing industries (Autos, Consumer Services, Banks). Again, we suspect the outlook for Cyclicals will be a function of inflation data more than the reaction function though.
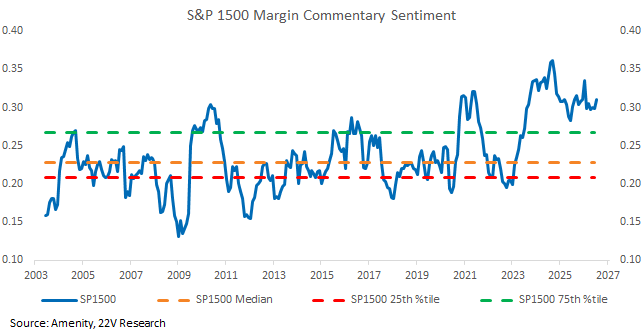
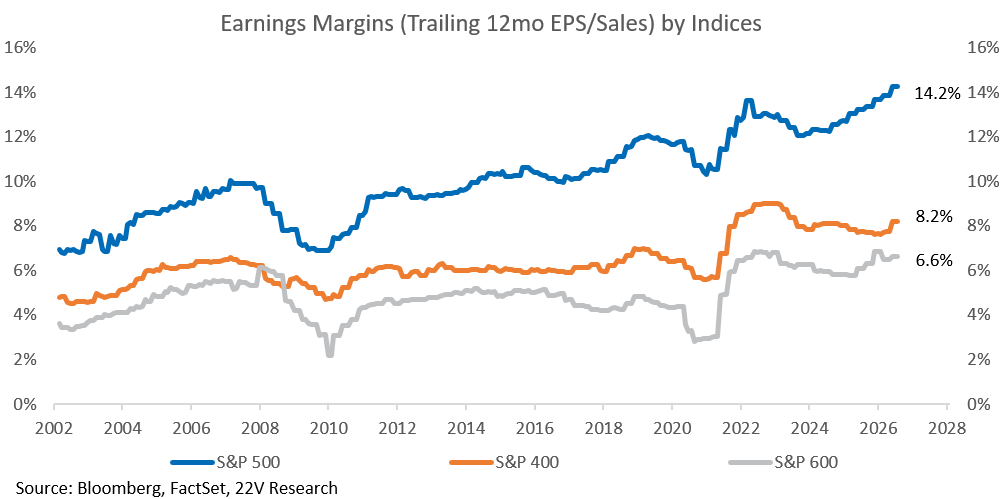
MARGINS: So far in earnings season S&P 1500 margins continue to grind higher. Margin sentiment for small, mid and large cap companies has increased. It can’t be proven definitively that AI tools are the reason margin expansion is happening, but AI usage is increasing across small, mid and large cap stocks. AI capex trends should be expected to persists if companies are increasingly using AI tools and margins are expanding. That is a support for the AI Capex Beneficiaries longer term.
Actual margins across small, mid and large cap stocks continue to have an upward bias.
AI USAGE: The percentage of companies using AI tools is accelerating, margins have come in better than expected, and an indicator of compute demand is increasing.
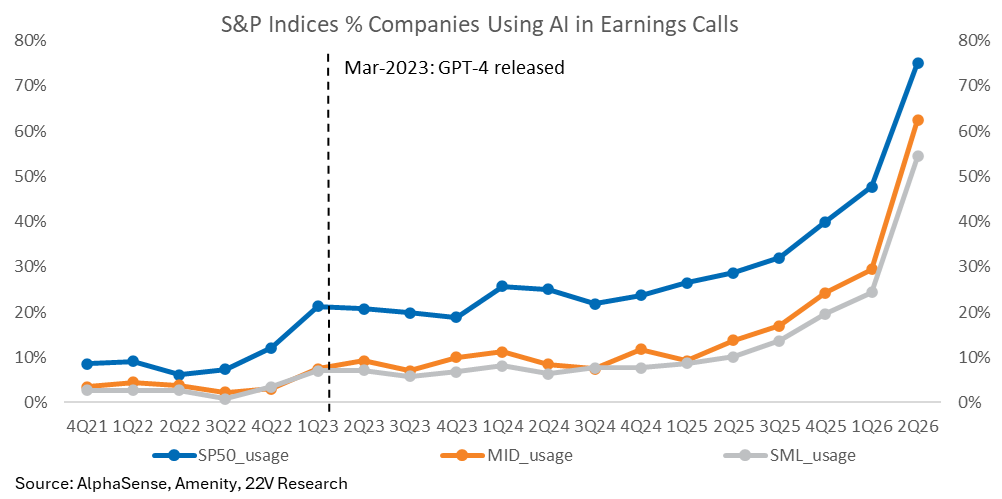
There are discrepancies in when the providers deliver transcripts, leading to differences in usage rates over time. The rate of earnings usage can swing a lot over the course of an earnings season since there is different sector mix shift over time, making intra-earnings season updates more of a tentative reading than deterministic.
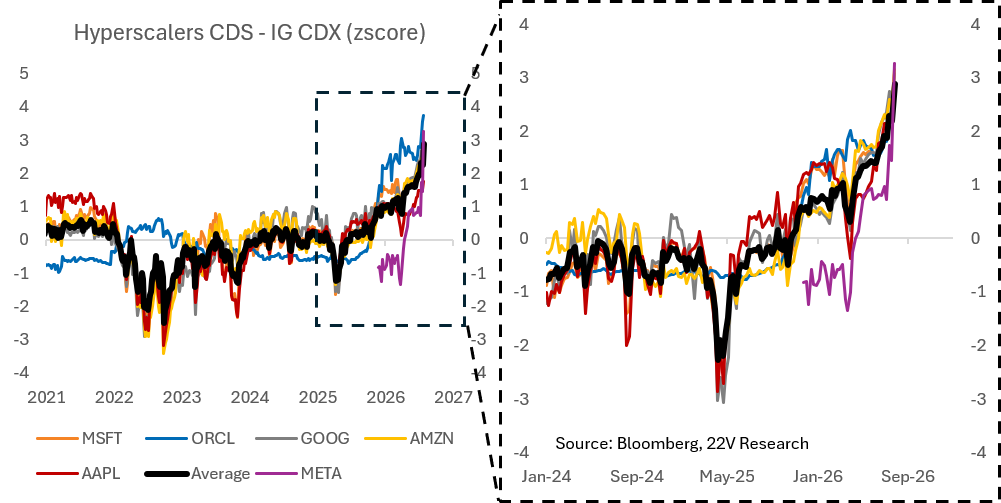
HYPERSCALERS & AI QUANTIFIERS: Much of the hyperscale’s capex shows up in Semi’s cash flow. NVDA is using a portion of that cash flow to fund data center buildouts. Those data centers will presumably buy NVDA chips, but also all the other infrastructure associated with the AI buildout. Investors seem fearful that if Hyperscale’s AI capex slows, a negative feedback loop could develop quickly.
Hyperscaler CDX spreads moving wider increase those fears.
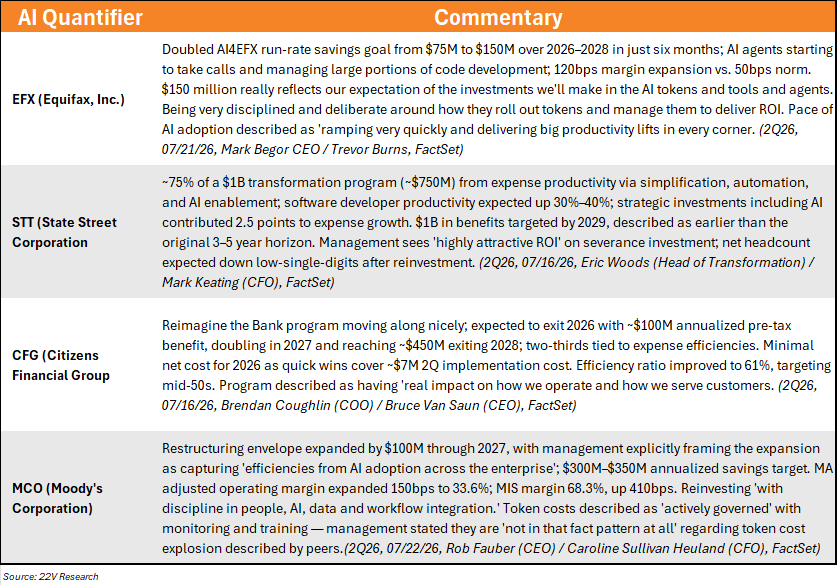
It is increasingly urgent to monitor what companies are saying about the value creation of AI. AI proving to be worth the investment is the cleanest way to prove the circular finance deals aren’t going to become a problem for issuers. So far, the trends have been positive for those quantifying the impact on AI on earnings.
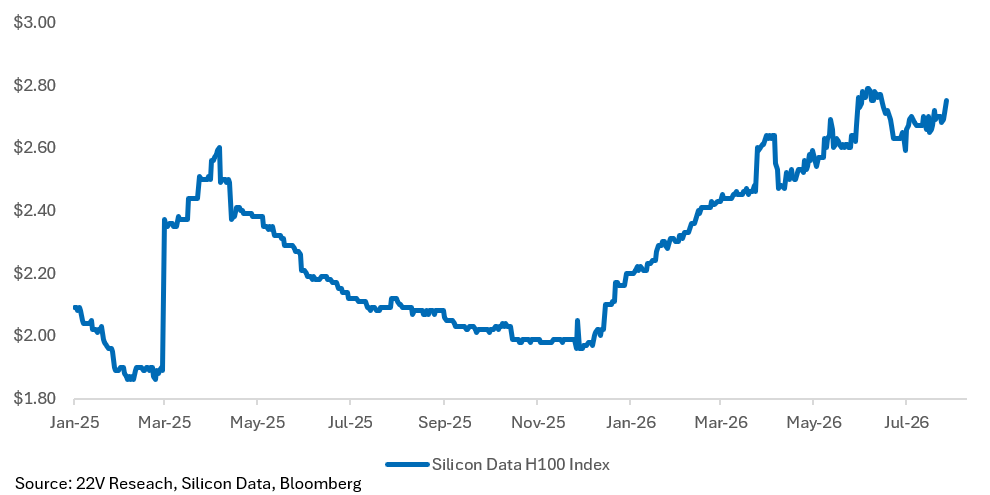
The H100 rental index (ticker SDH100RT) is a daily benchmark tracking the average hourly spot price and contract costs of renting an NVIDIA H100 GPU. It standardizes prices across neo-clouds, hyperscalers, and private platforms. The implication is that many companies are using AI tools and that usage is associated with improving margins. That is positive LONGER TERM for the AI Buildout names.
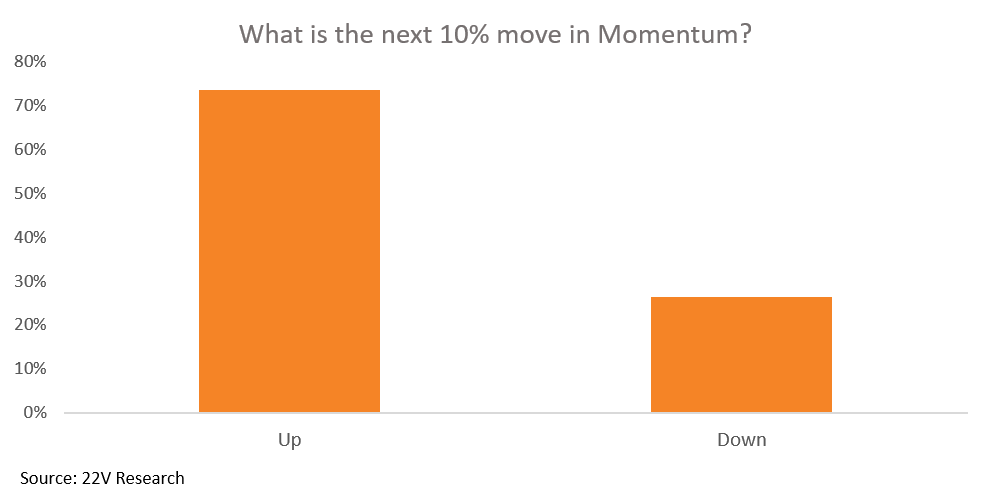
PRICE MOMENTUM: 73% of Investors we surveyed expect the next 10% move in the Price Momentum factor to be higher, not lower. History suggests that +10% is the norm after such a large sell-off in Price Momentum factor…but over 12 months.
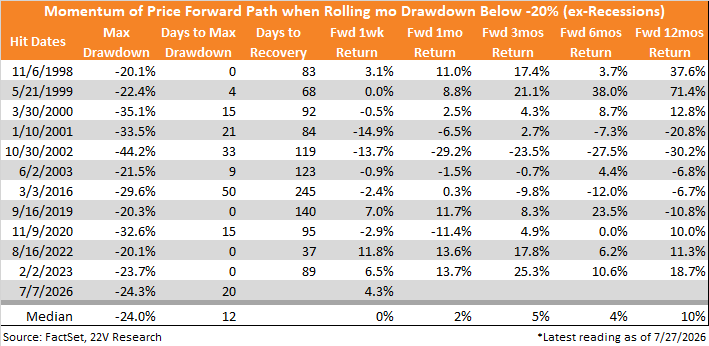
Although the duration and ultimate depth of the current unwind remain difficult to predict, historical non-recessionary episodes in which Momentum of Price drawdowns first breached -20% provide some references. The median maximum drawdown across these episodes was approximately -24%, close to the current level. Subsequent returns were volatile but generally leaned positive, suggesting that the worst of the decline may be behind us, although a rapid recovery to the previous peak is unlikely.
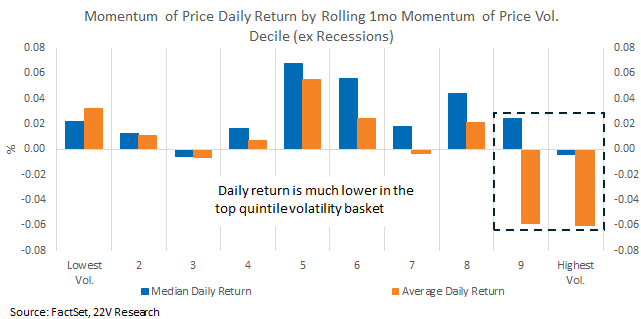
Breaking down 1mo volatility into deciles for historical non-recessionary periods, the top quintile group has the worst Price Mo daily return, especially during sharp plunges. Current 1mo volatility remains at historical 97th percentile, which needs to drop below the 90th percentile, roughly the level around 0.012 to imply a more stabilized Price Mo outlook.
AI SERVICES: The margin story seems to favor AI Services. Implementing AI remains a competitive advantage, while investor concerns have shifted toward the cost of AI infrastructure buildout. We remain constructive on AI service companies, as open-source models appear less threatening to the application layer than frontier labs using proprietary data to compete directly with customers.
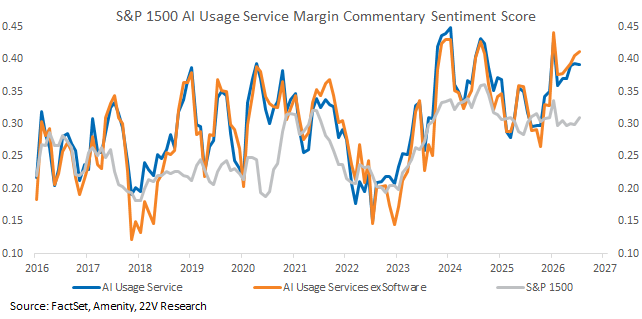
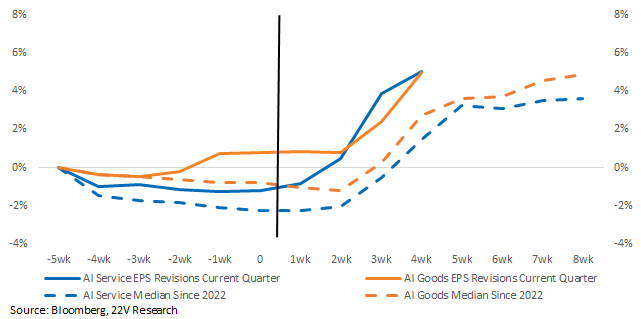
If AI continues to enhance profitability, we expect both AI Goods (semis and infrastructure) and AI Services to outperform, a view supported by rising margins, strong compute demand, and improving EPS revisions across both groups.
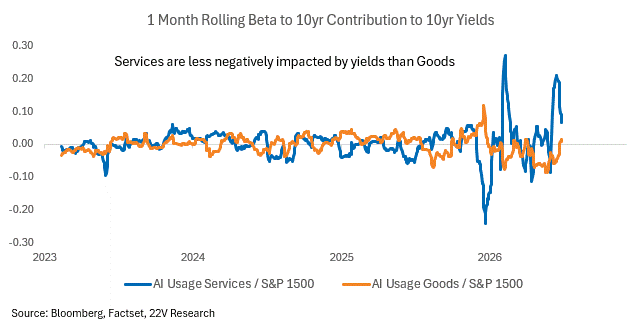
AI Service names are less sensitive to higher rates. Post the FOMC meeting, our view is 10yr yield volatility is going up. Tightening or easing of financial conditions is more likely to come through the long end of the yield curve vs the Fed funds rate. Current economic trends suggest more upside vs downside risk to 10yr vol (see Peter Willaims HERE and the Video we did with Peter HERE on this subject).
Service companies that are using AI have a similar EPS beat rate compared to last quarter (85.5% vs 84.9%), but fewer large beats. Beats are more concentrated in the 0-10% cohort. All beats have resulted in positive average relative performance. Last quarter only beats of 10% or greater were positively rewarded on average.
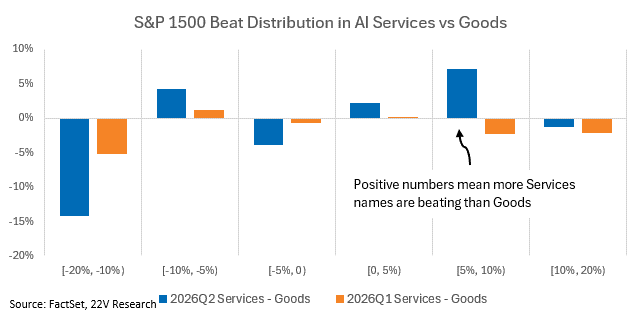
AI Services are beating earnings at a higher clip than AI Goods. The chart below is the spread between the Service and Goods beat rates in each cohort. This quarter is much better for Services than last was.
AI Service and AI Goods revisions are BOTH stronger than normal.