Back Portfolio Strategy

Why Yields Didn’t Rally + Tokenmaxxing Update

Published on June 16, 2026

∙ Download the PDF Report

By

Dennis DeBusschere

Kevin Brocks

Sophia Wang

DAILY STRATEGY: 10yr yields were flat yesterday despite lower oil prices and 1yr inflation swaps. The 10yr-2yr curve steepened slightly while longer-term inflation expectations held steady — consistent with an improving real growth outlook as the energy shock headwind fades.

Why yields didn’t rally: consumer spending has remained strong during the energy shock. Banks flagged at last week’s financial conference that spending is holding up, with some improvement at the lower end (HERE). With the Energy shock fading, real incomes will move higher and downside risks to consumer spending are fading. We don’t expect the real income lift to fully offset fading fiscal impulse, but that will take time to play out. So, our base case is yields stay rangebound (4.4-4.5% range) until there’s more clarity on how much growth slows. Or not.

Assuming the economic outlook keeps 10yr yields below ~4.5%, which is our call (with lower conviction now unfortunately HERE), fundamental factors (EPS momentum, Earnings Growth, GARP) and Cyclical sector will be supported.

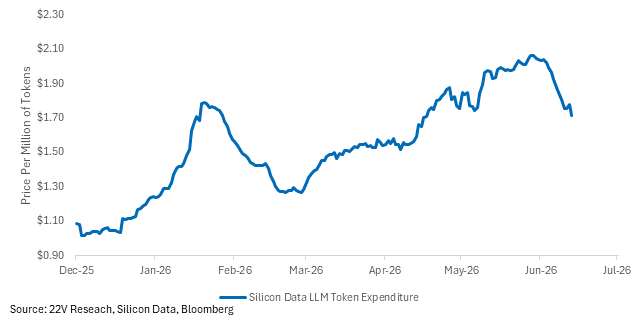
TOKENMAXXING UPDATE: Two weeks ago, we wrote about investor concerns that AI demand is “inflated” at the same time value creation is unclear. The concern is large AI bills without monetizable productivity gains. The AI buildout baskets were perceived as at risk because of their sensitivity to usage statistics and/or token pricing (especially after 50%+ YTD price gains).

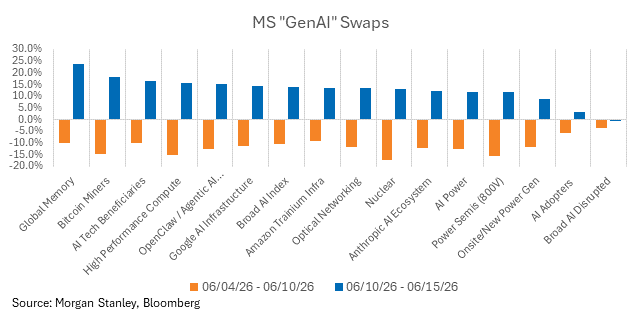
Since then, token prices dropped and buildout beneficiaries (memory, compute, power generation, liquid cooling, neo clouds) fell initially but have now pared losses.

Dauvin Peterson, head of 22V Data Infrastructure/Commodities, wrote last week how lower token prices encourage firms to adopt AI, so lower prices are not a long-term bearish signal for the buildout, even if tokens become “commoditized” (HERE). Investors may be pulling forward that view. It was one of the most asked questions we got last week. Employees can go back to testing AI tools more economically. The effectiveness of these tools is still a risk (more on that below), but at least the tools are cheaper again.

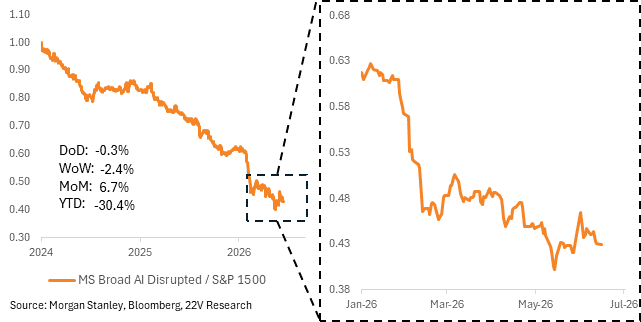
During the great AI buildout drawdown of June 2026, the baskets of AI Disrupted stocks stabilized but did not outperform to near the same extent. Investors were NOT reconsidering whether AI as a technology is effective. The terminal values of companies disrupted by AI were still perceived as at risk. That implies the fundamental thesis for the AI and AI buildout trade are intact.

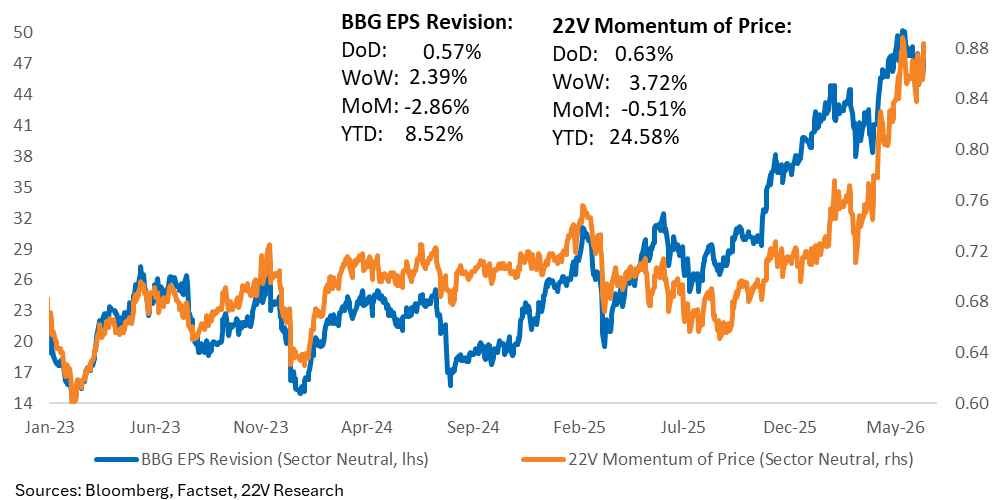
Price Mo is sensitive to inflation and supply shocks, given inflation is the limiting factor on the expansion and Price Mo is the first derivative trade in a VAR shock/broad derisking. Momentum began its drawdown when labor data was stronger-than-expected, deepened when the US and Iran resumed missile strikes, and then began pared losses when peace talks perceivably gained traction late last week.

The Most Important Longer Term Demand Driver Is Enterprises Making More Money with AI – We continue to track what companies are saying about their AI deployment and its impact on margins/productivity. There is no update here. 2Q earnings reporting season will be important. What we know is companies that use AI are more optimistic about their forward outlooks for margins (across sectors, not just Tech) than companies that do not. The early quanitifiers in Q1 guided to ~85bps of margin improvement from AI tools (HERE). It is difficult to be short Price Momentum unless margin sentiment declines, the quantifiers guide to worse margin improvement, and/or no additional companies quantify the impact from AI next quarter.

Recall, the negative argument for AI Usage (and by extension the AI demand outlook) is as follows – It is possible that recent margin expansion/productivity gains have VERY little to do with AI. As Peter Williams pointed out in a report last week, when accounting for the fact that businesses are simply working their existing workers and machines harder — which naturally happens after an economic slowdown, the recent productivity gains appear to be driven by a surge in capital and labor utilization rather than AI. Theoretically, this is a temporary lift to margins/productivity.

Also, the immigration slowdown could be temporarily boosting productivity now. Fewer low-wage immigrant workers means total work hours are dropping faster than economic output, which makes productivity look better for a time, but should fade (HERE).

All of the above suggests AI is not really the driver of recent margin gains. If companies are struggling to find value using AI tools, the demand outlook will be much less certain. The ROI assumptions are more at risk.

Charts…

Momentum baskets have pared losses. AI buildout baskets have pared losses.
A graph of blue and orange lines

AI-generated content may be incorrect.

During the drawdown, names that face the greatest risk from AI stabilized but did not outperform to the extent that the buildout baskets underperformed.
A graph of a price fall

AI-generated content may be incorrect.

The LLM Token Expenditure Index (BBG: SDLLMTK) is a daily financial benchmark that tracks the effective aggregate spend on large language model (LLM) APIs rather than just nominal price per token. It measures how much enterprises are spending on AI inference.
A line graph with numbers and a line

AI-generated content may be incorrect.

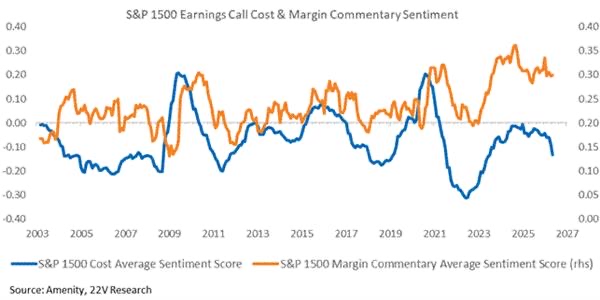
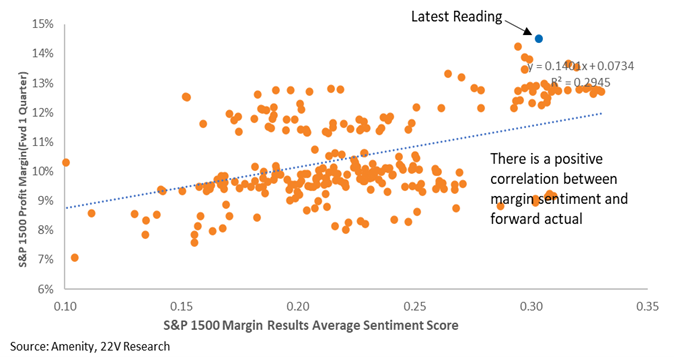
The current level of margin sentiment suggests an INCREASE in margins in 2Q26. Unless margin sentiment declines or actual margins decline, it will be difficult to be short Price Momentum.
Attachment_1.jpeg

A graph of orange dots

AI-generated content may be incorrect.

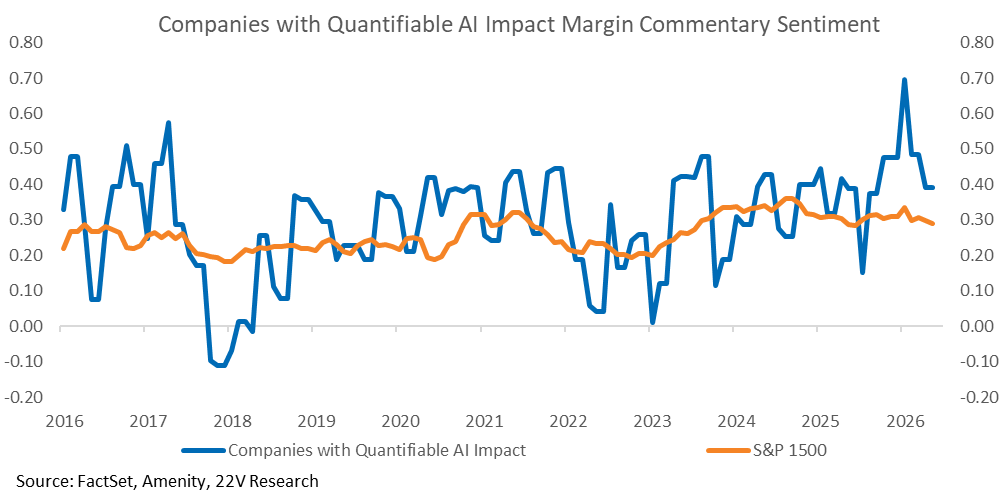
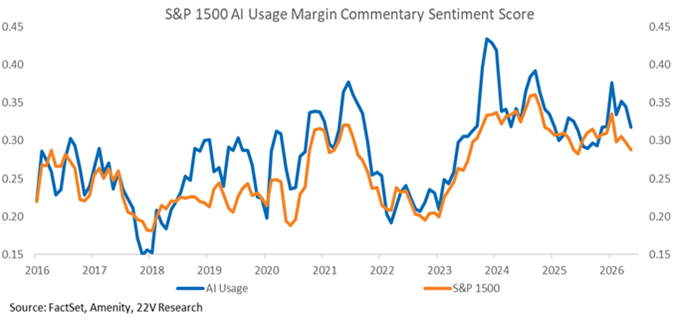
Companies that quantified the impact from their AI tools have much higher earnings sentiment than the rest of the index. Companies that mentioned use cases of AI, but did not quantify the impact, also have higher margin sentiment than the index.
A graph with blue lines and orange lines

AI-generated content may be incorrect.

A graph of a line graph

AI-generated content may be incorrect.

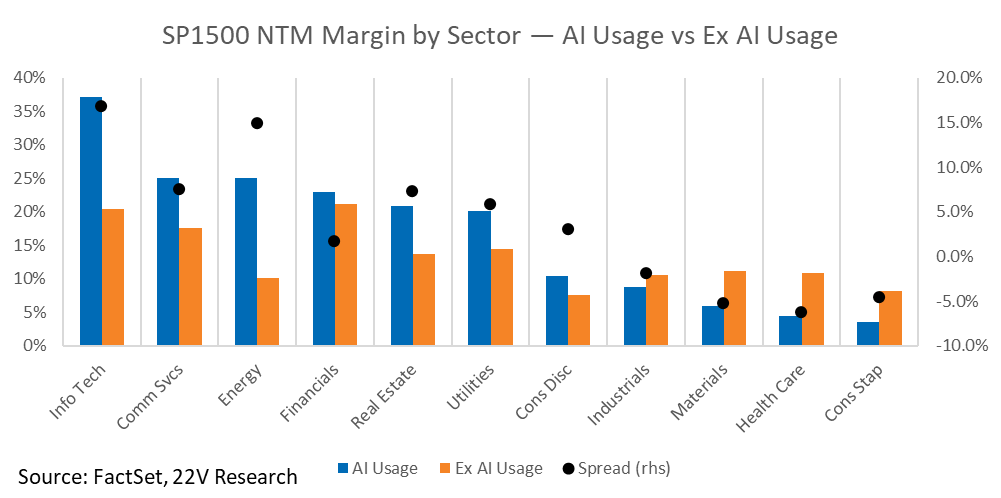
Consensus margin estimates are higher for AI users as well. That is NOT just concentrated in Tech.
A graph of blue and orange bars

AI-generated content may be incorrect.

DISCLOSURES AND DISCLAIMERS

Analyst Certification

The analyst, 22V Research Group, primarily responsible for the preparation of this research report attests to the following: (1) that the views and opinions rendered in this research report reflect his or her personal views about the subject companies or issuers; and (2) that no part of the research analyst’s compensation was, is, or will be directly related to the specific recommendations or views in this research report.

Analyst Certifications and Independence of Research.

Each of the 22V Research analysts whose names appear on the front page of this report hereby certify that all the views expressed in this Report accurately reflect our personal views about any and all of the subject securities or issuers and that no part of our compensation was, is, or will be, directly or indirectly, related to the specific recommendations or views of in this Report.

22V Research (the “Company”) is an independent research provider. The Company is not a member of the FINRA or the SIPC and is not a registered broker dealer or investment adviser. 22V Research has no other regulated or unregulated business activities which conflict with its provision of independent research.

22V Research, LLC is a professional services and independent publication organization. 22V Research, LLC is not a securities broker-dealer, not a member of the Financial Industry Regulatory Authority (FINRA), not a registered investment advisor (RIA) and not a member of SIPC.

Securities transactions, when offered, are offered by 22V Securities, LLC through LPS Capital, LLC. Certain employees of 22V Securities, LLC are dually registered as securities representatives of LPS Capital, LLC or Analyst Hub Securities, LLC. 22V Securities, LPS Capital and Analyst Hub Securities are members FINRA, SIPC.

https://brokercheck.finra.org/

Current Ratings Definition.

SECTOR OUTPERFORM: An “outperform” rating anticipates the company will outperform the S&P Regional Banking Index (peer group).

SECTOR PERFORM: A “market perform” rating anticipates the company will perform in line with the S&P Regional Banking Index (peer group).

SECTOR UNDERPERFORM: An “underperform” rating anticipates the company will underperform the S&P Regional Banking Index (peer group).

Limitation Of Research And Information.

This Report has been prepared for distribution to only qualified institutional or professional clients of 22V Research Group. The contents of this Report represent the views, opinions, and analyses of its authors. The information contained herein does not constitute financial, legal, tax or any other advice. All third-party data presented herein were obtained from publicly available sources which are believed to be reliable; however, the Company makes no warranty, express or implied, concerning the accuracy or completeness of such information. In no event shall the Company be responsible or liable for the correctness of, or update to, any such material or for any damage or lost opportunities resulting from use of this data. Nothing contained in this Report or any distribution by the Company should be construed as any offer to sell, or any solicitation of an offer to buy, any security or investment. Any research or other material received should not be construed as individualized investment advice. Investment decisions should be made as part of an overall portfolio strategy and you should consult with a professional financial advisor, legal and tax advisor prior to making any investment decision. 22V Research Group shall not be liable for any direct or indirect, incidental or consequential loss or damage (including loss of profits, revenue or goodwill) arising from any investment decisions based on information or research obtained from 22V Research Group.

Reproduction And Distribution Strictly Prohibited.

No user of this Report may reproduce, modify, copy, distribute, sell, resell, transmit, transfer, license, assign or publish the Report itself or any information contained therein. Notwithstanding the foregoing, clients with access to working models are permitted to alter or modify the information contained therein, provided that it is solely for such client’s own use. This Report is not intended to be available or distributed for any purpose that would be deemed unlawful or otherwise prohibited by any local, state, national or international laws or regulations or would otherwise subject the Company to registration or regulation of any kind within such jurisdiction.

Copyrights, Trademarks, Intellectual Property.

22V Research Group, and any logos or marks included in this Report are proprietary materials. The use of such terms and logos and marks without the express written consent of 22V Research Group is strictly prohibited. The copyright in the pages or in the screens of the Report, and in the information and material therein, is proprietary material owned by 22V Research Group unless otherwise indicated. The unauthorized use of any material on this Report may violate numerous statutes, regulations and laws, including, but not limited to, copyright, trademark, trade secret or patent laws.