SUMMARY
2025 is likely to remain in a ‘Normal’ economic regime. In other words, the economic expansion keeps going without a material acceleration or deceleration. Our 2025 strategies and themes flow directly from this macro call. We had the same basic regime framework in 2024, which worked well for Cyclicals relative to Defensives, but low Vol factors performed better than we would have thought for most of 2024.
Our S&P 500 Earnings Per Share (EPS) target is $277 (tracking +14%), and our estimate of S&P 500 is 6550 (+12% higher from here). Inherent in our target is a slowdown in the pace of equity returns. The y/y declines in Equity Risk Premia have been extreme over the past two years as it became clear that core inflation could decline toward the Fed’s 2% target accompanied by 2.5% to 3% real economic growth. Relative to the last few years, we don’t see an obvious macro reason for a significantly higher or lower Equity Risk Premium.
Sensitivity to earnings was the driver of returns in 2024 and is going to be the driver of again in 2025. Fundamentals recovering in factors and sectors that had relatively poor earnings growth in 2024 is a theme of ours for 2025. Consensus estimates indicate a recovery in Sectors and Factors that lagged in 2024 and should be a tailwind for those Sectors and Factors in 2025. We see no macro reason to fade those estimates. In 2024, multiple expansion followed earnings growth. That has led to unusual valuation spreads, given the normal economic backdrop, which should normalize in 2025.
Our framework favors SMID caps relative to large caps. It is a tailwind to Value over Growth, and a headwind to Mo, Low Vol, and Quality. For sectors, continued outperformance of Cyclicals relative to Defensives. Deep Cyclicals (Industrials, Materials, Energy) will benefit, but are more attractive relative to Defensives than Early Cyclicals (Tech, Comm Svcs, Discretionary). Deep Cyclicals are partially dependent on rest-of-world growth, which still looks uninspiring.
A normal economic expansion, along with fundamentals recovering, supports another good year of stock picking. Spikes in correlations and in volatility should be faded. We are much more interested in micro themes in 2025.
The tail risk most likely to move the macro classification model out of a Normal economic expansion is inflation failing to track tolerably towards the Fed’s 2% target. For 2025, that means tracking above 2.5% (ex the potential impact of tariffs). Demand growth is firm, and as Friday’s employment data showed, there is a rebound in hiring happening now. RISKS have increased that interest rates need to increase/FCI tighten to push core PCE closer to the Fed’s 2% target.
It is also possible employment in interest rate-sensitive industries (Housing, Auto, Manufacturing, etc.) needs to roll over, increasing recession risk, to bring core inflation to the Fed’s 2% target. That would be in addition to some mild tightening of FCI to slow growth of the interest rate-sensitive sectors mentioned above. That is because of strong consumer spending, particularly on services, and well above trend real income growth.
But this is a risk, not the base case. Service inflation would be coming from cyclical strength, which can be solved via higher rates acting as a natural governor on economic growth, while wage growth, which is high in level terms, could be a catch-up effect (to earlier inflation and to recent productivity) rather than an indication the labor market is too tight.
We have a series of swaps live through Morgan Stanley to position for these themes. And, if you disagree with our macro call for a continued economic expansion, these can be used to position against our call as well. We’ll only be a little offended.
The best way to position for a broadening out of returns + fundamental factor leadership is going long SMID Cap GARP (MS22GARP Index) and short the S&P 100 (MS22100 Index). Pair trade is MS22LGSM Index. If your view is that Size and Mo will sustain their 2024 pace, flip the pair to go long MS22100 Index and short MS22GARP Index.
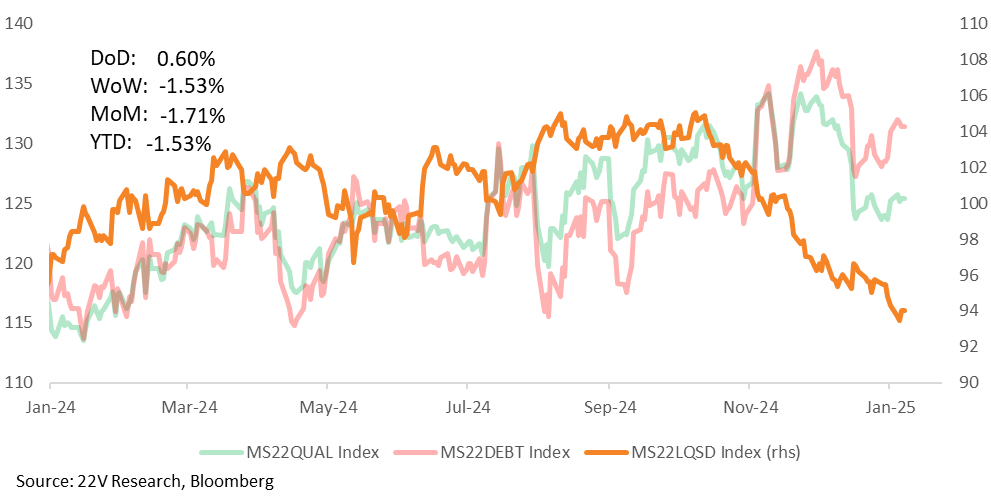
To start the year, we’ve fielded a number of questions on how to play changes in the 10yr via equities. If 10yr yields are increasing because of more restrictive monetary policy, short companies with high variable debt (MS22VARD Index) and companies with volatile cash flow and deteriorating debt ratios (MS22DEBT Index). The underperformance would be worse if employment in housing, construction, and manufacturing needed to roll over. For a pair trade, long Quality and short Debt. Ticker MS22LQSD Index.
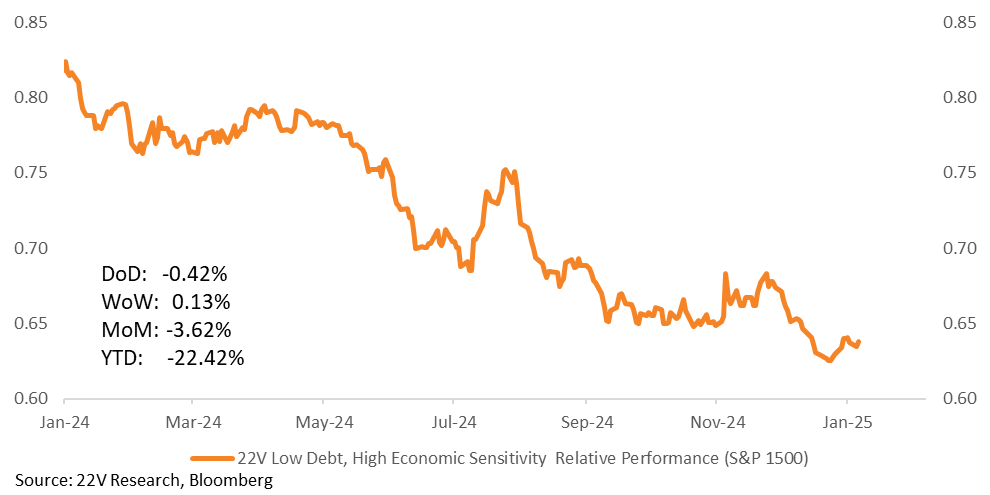
If 10yr yields increase because real economic growth is better in a disinflationary boom, debt baskets would rally, aggressively. In addition, go long companies with low debt and high economic sensitivity (MS22LDHE Index). Historically, this group of stocks is correlated with high frequency activity indicators, but not with 10yr yields. In other words, they will benefit from better activity but shake off higher debt costs. That would be a significant reversal from last year.
The Normal Economic Backdrop Will Stay Normal
Our process for forecasting macro, market, sector, factor, and idio themes relies on combining quantitative, fundamental, and sentiment analysis. Our “strength” is identifying the current economic regime and associated risks. This process informs the longer-term sector and factor tailwinds and 1-, 3-, and 6-month macro risk management around our secular themes. We lay out our process in detail below to demonstrate how we arrive at our 2025 themes.
Step 1 – Identify the Regime
We identify the macro regime we are in by using a machine learning model to aggregate the breadth of macro and market indicators (our Macro Regime Classification Model, MRC, white paper here). The MRC was consistently in a ‘Normal’ expansionary pattern in 2024. Uncertainty around inflation and labor markets never impact actual data enough to seriously challenge the normal expansion conclusion.
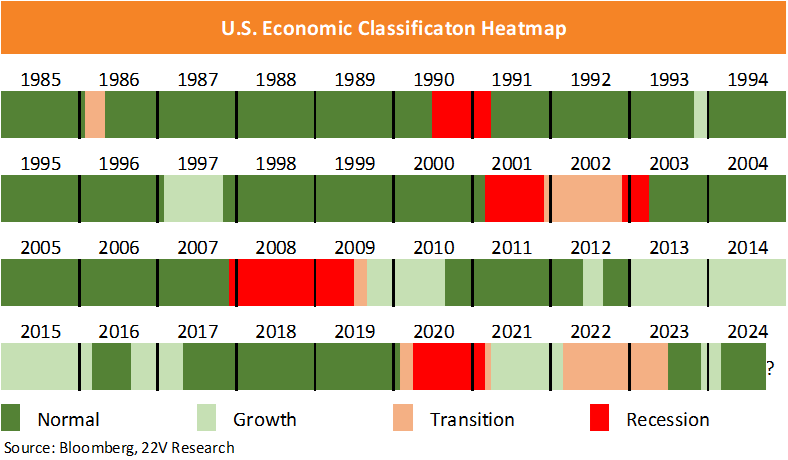
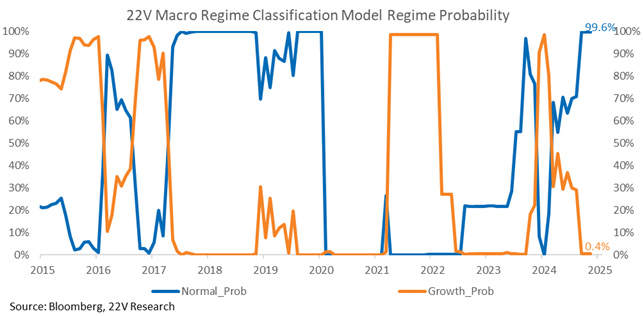
2025 look set to remain in a Normal regime. A material tightening of financial conditions would threaten that expansion, but that is a two-stage process. First, FCI needs to tighten from its currently supportive level. Second, that tightening would need to show up in increased default risk (wider spreads) and/or labor market weakness. The labor market has decelerated some (in-line with the Fed’s goals) but is NOT showing signs of problematic weakness. The outlook for consumption is solid given the labor market, record level of household net worth, little reliance on credit expansion, and no reliance on a dwindling stock of excess savings (which never really existed, HERE). Though we see uncertainty coming from the slight hawkish shift in Fed rhetoric and the apparent policy focus of the incoming administration, the macro backdrop remains a LONG way from the instability that triggered increased volatility in early/mid-2024. There are tail risks around the labor market and inflation outlook, but those risks are significantly lower the in 2023 and 2024. More on the tail risks later, but net net, the economic expansion is on a sustainable path in 2025. Our regime model currently puts the odds of the U.S. being in a normal economic expansion at 99.6%.
Step 2 – Identify the Central Tendencies of the Regime
Based on the macro regime, we assess the outlook for index-level valuations and identify central tendencies for sector and factor trends.
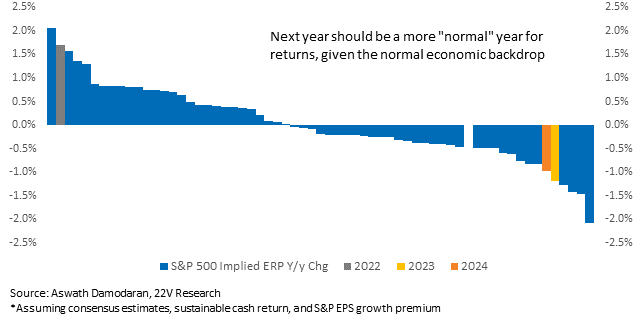
The tightening and easing of financial conditions, thanks to supply shocks and the Fed’s monetary policy cycle, have led to extreme changes in equity risk premia for the past three years. The Fed is nearing the end of its cutting cycle, with only another 1-2 cuts priced into 2025 (a view we agree with), so we do not have a good macro reason to expect another significant risk premium adjustment (higher or lower). Consistent with a Normal economic backdrop with lower volatility, the pace of returns should slow.
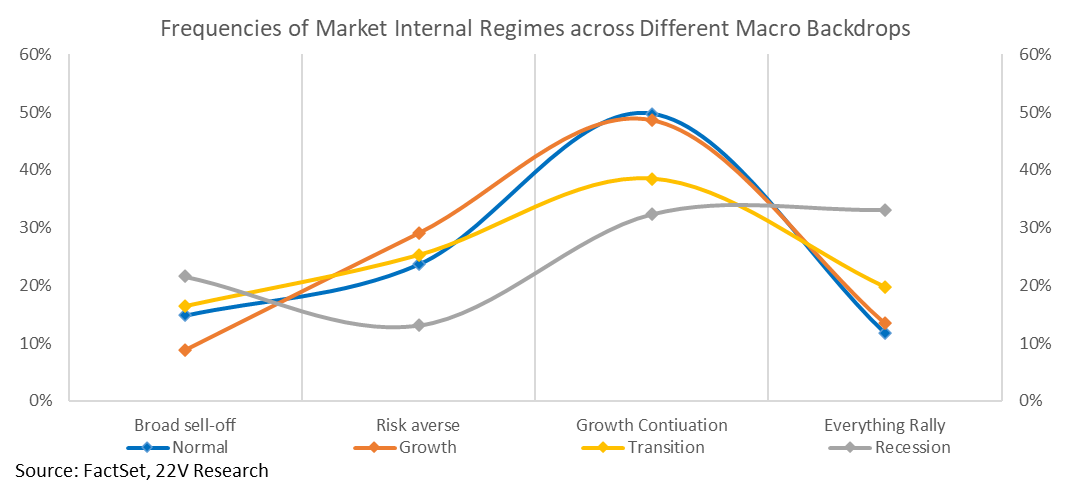
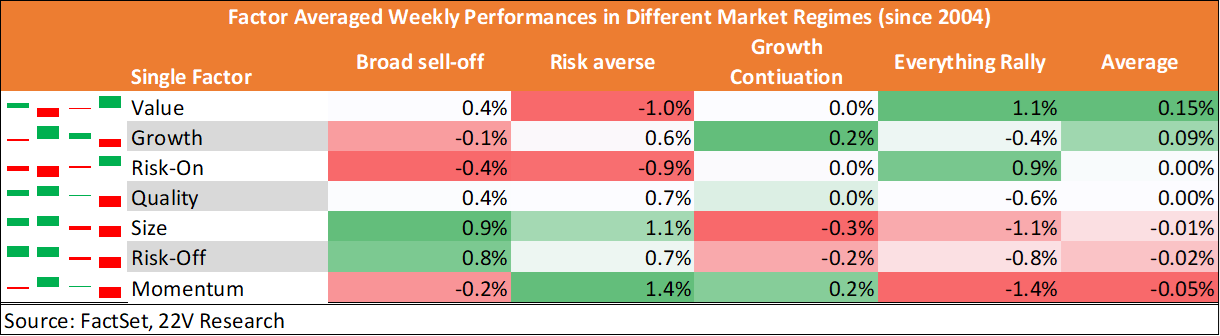
Macro regimes are medium term conditions. To help make regimes actionable for sectors and factors, we built a classification model for market internal regimes (the MIR, white paper HERE), that splits market internals into four distinct categories. The distribution of the four internal regimes lets us set a central tendency for factor returns and asses the skew of factors on a week-by-week basis.
In a normal economic backdrop like today’s, the market tends most often be in a “Growth Continuation” regime where fundamental factors (Value, Growth, GARP) lead. Exposure to risk factors is not in focus.
Step 3 – What Has Been Priced
We compare the central tendencies of recent price action to identify potential trades. Not every dislocation is actionable, but it is a good place to start looking.
The inflation and labor market uncertainty created an interesting trading backdrop for much of the year. Internals were in a ‘Broad Sell-offs’ mode much more often than typical, and in ‘Growth Continuation’ much less. In 4Q, internals gravitated towards “Risk Averse” more than normal. The setup to start 2025 and ahead of 4Q reporting suggest more Growth Continuation and Everything Rally periods near-term.
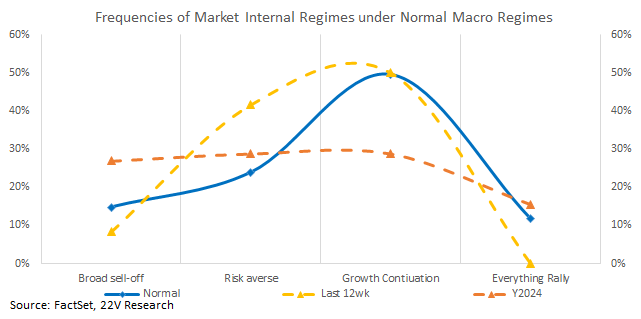
There are still dislocations between the market internals and macro regime. One of the more interesting themes for early 2025 is that investors are still paying up for Growth and Momentum, the two best performing factors of 2024. Growth Continuation would favor fundamental factors, and Everything Rallies would favor Value and other catchup trades.
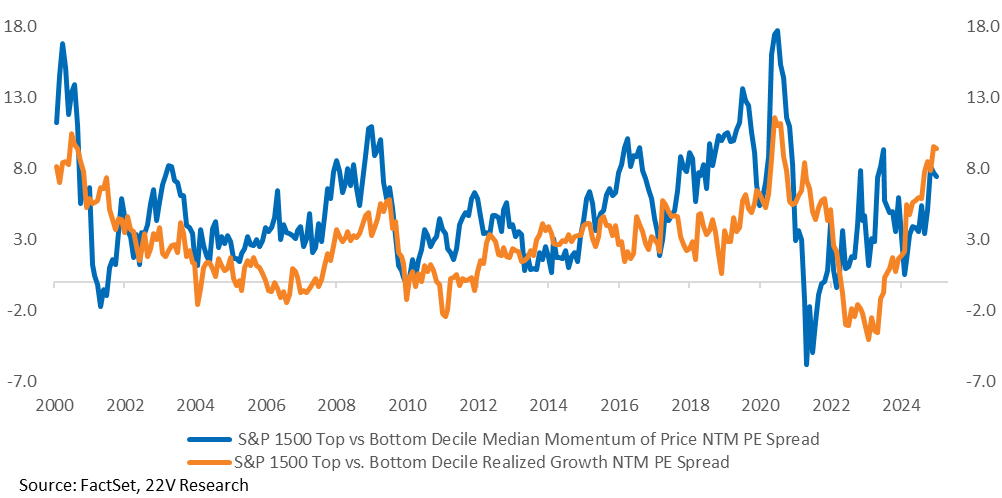
In general, exposure to Growth and Momentum dominated returns in 2024. Although that has to do with uncertainty in the macro backdrop, Growth also generated incredible cash flow this year, outpacing the rest of the market to the tune of a 96th percentile move. That helps explain Growth accelerating in 2H despite continually declining macro uncertainty. We did not predict the market sensitivity to earnings going into 2024.
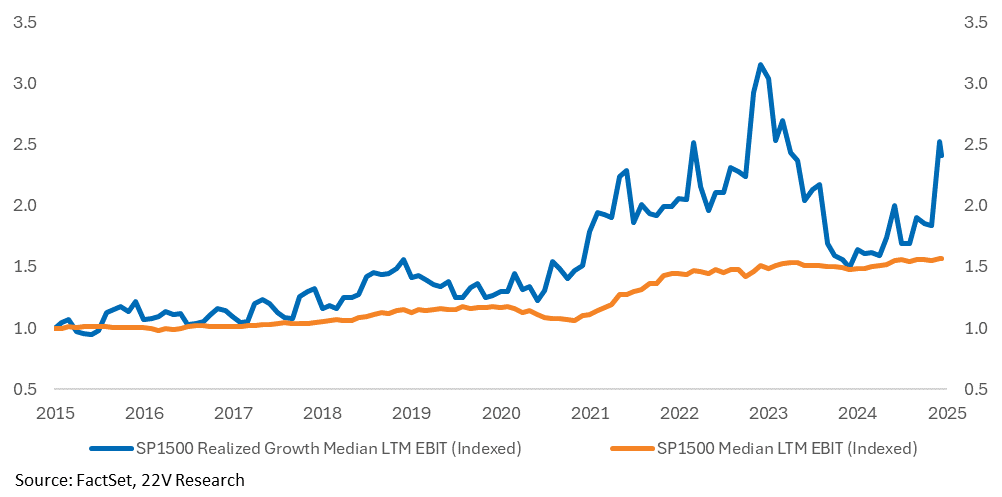
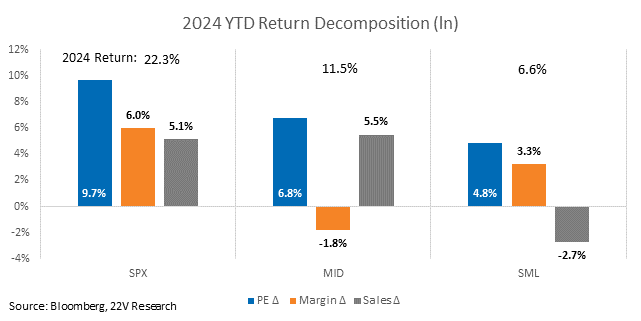
The sensitivity to earnings has happened across market caps. The differentiator in 2024 returns was earnings trends, with multiple expansion scaling with earnings growth. Large caps had the largest multiple expansion, but also the largest contribution from margin + sales growth. Small caps were the opposite.
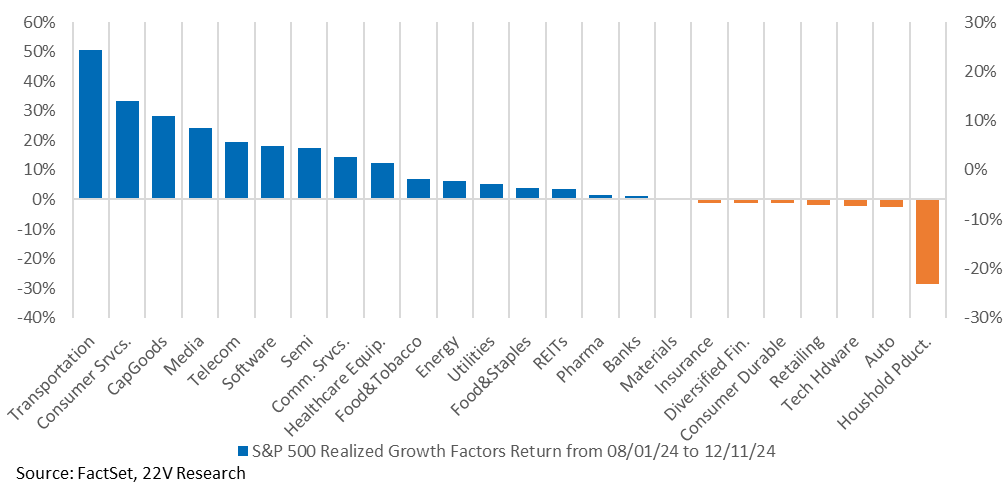
Growth worked across most Industry Groups too. This was not an isolated AI/Tech phenomenon.
Sensitivity to earnings was the driver of returns in 2024 and is should be a significant contributor again in 2025, but this year it’ll be about fundamentals recovering in other factors and sectors. That should help close some valuation gaps as well, as investors bid up factors and sectors that prove to be recovering. That trend would be consistent with the type of returns in a normal economic expansion.
2025 Themes: Earnings Recoveries
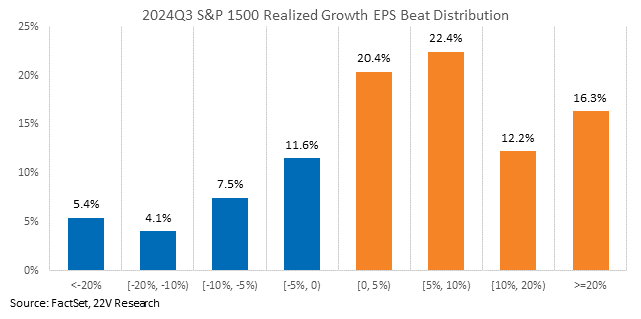
Consensus expectations are for 2024 laggards to start closing their earnings spread gaps. The inflection of earnings trends will be one of the most important themes for 2025. The logical follow-up question is why improving expectations haven’t helped laggards yet. It’s a “prove it” story because Growth keeps beating its expectations significantly. That means owning Growth at an “expensive” forward multiple based on consensus expectations has meant owning Growth at a lower multiple in practice. In 3Q earnings, Growth beats were concentrated at the higher end (>10% higher than consensus estimates). If expectations are right, laggards should catch up to Growth, but that will have to be proven.
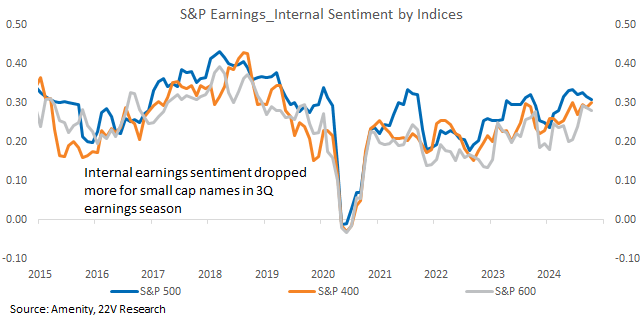
Helpfully, earnings sentiment is better across the board compared to this time last year. We measure sentiment using the Amenity natural language processing tool, a specialized tool built to objectively score earnings transcripts. In other words, management teams themselves sound more optimistic about their own company’s earnings, across market caps at the start of 2025.
2025 Market Cap Catch Ups
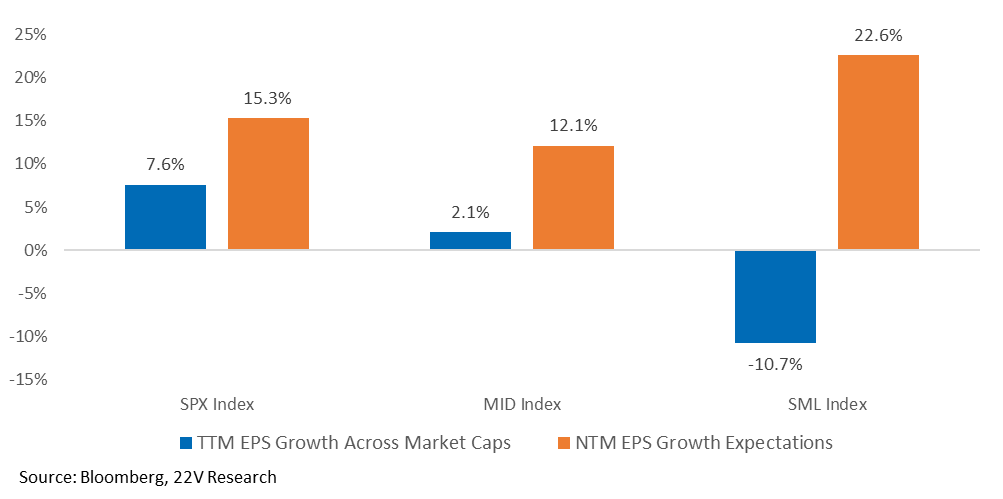
Consensus estimates call for a significant reversal in small cap earnings. That is consistent with what typically happens in normal economic expansions.
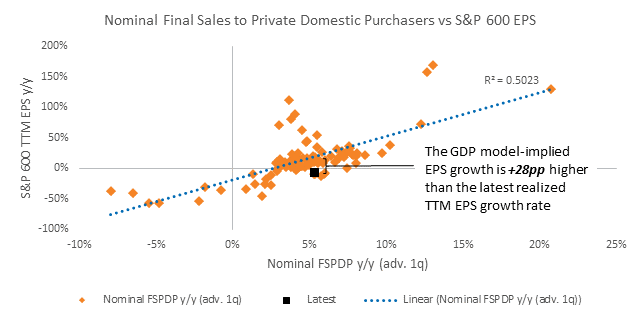
A simple model of S&P 600 earnings as a function of nominal final sales to private domestic purchases (‘core’ GDP) shows small caps have dramatically under-earned nominal growth. That is expected to revert in 2025. There is little reason to fade that outlook.
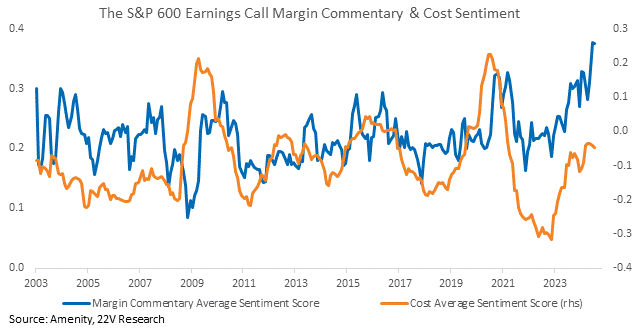
Small caps were being faded because of high input and high debt servicing costs. Underperformance reaccelerated in December as Implied real rates (Treasuries – inflation expectations) rose to a fresh cycle Small cap companies, however, are signaling a much better outlook for costs (orange line below) and margins (blue line).
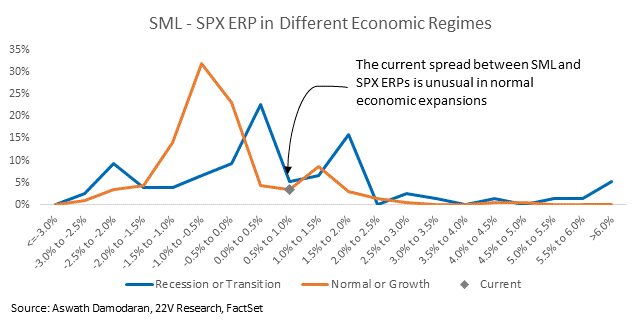
If the earnings story is a “prove it” situation, the rebound in earnings, as it is realized, should also lead to a narrower small-large cap valuation gap. The below chart shows how the current small-large gap valuation spread, based on our preferred cash-return valuation framework (more on this in the fair value section), is more common in Recessions or Transition (slowing growth with high recession risk). It is unusual for a Normal or Growth backdrop like we are in today.
2025 Factor Fundamental Catch Ups
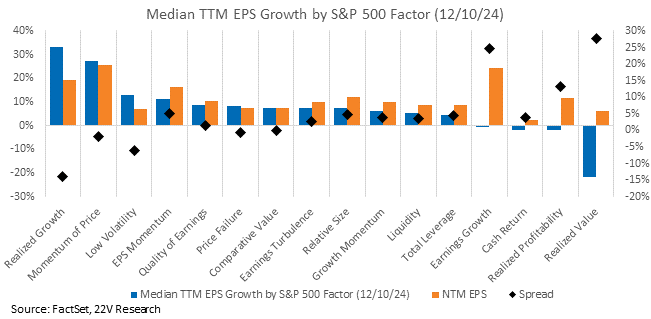
The largest dispersion between TTM and NTM EPS estimates within factors are Growth, Momentum, Low Vol, and Value. Growth names now have the worst NTM EPS growth estimates relative to realized earnings. Value the best. Mo and Low Vol earnings are also expected to decelerate (not decline but decelerate).
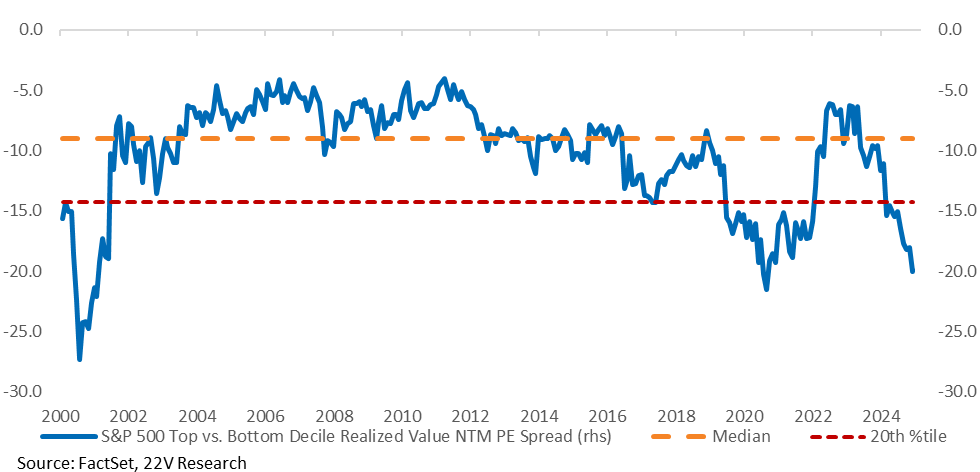
Positioning for that outcome is also consistent with a normalization in valuation spreads…
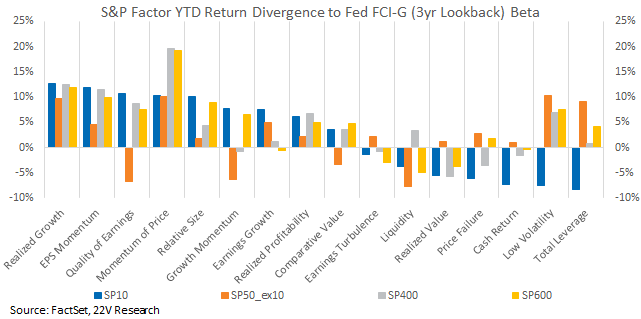
…AND betas to financial conditions, which are not likely to be restrictive in 2025, and against which Value has lagged. The bottom line is that the case for owning Quality in a normal economic expansion, and one with lower tail risk, is thin, while the case for owning Growth vs Value should be weakening.
2025 Sector Fundamental Catch Ups
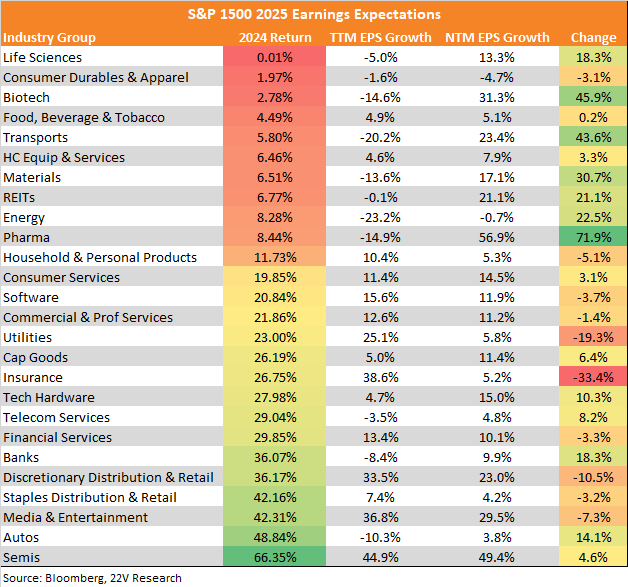
Broadly speaking, the sectors that performed best in ‘24 (with the exception of Tech) have the worst expected earnings growth in 2025, and vice versa. That sets the stage for a broadening out of returns, given our call that the macro backdrop will continue to be consistent with a normal economic expansion.
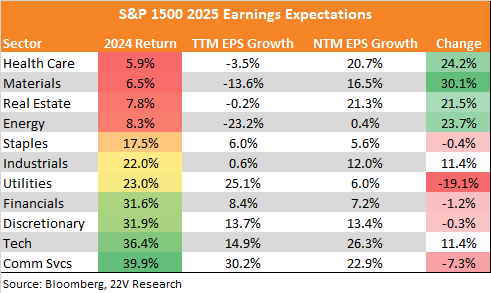
The worst three performing S&P 1500 Sectors in 2024 were Health Care, Materials, and Real Estate. Consensus estimates are for the fundamentals of all three to recover in 2025. In addition, the earnings sentiment for all three is improving as well. If the improvement is realized, these three have a mechanical reason to perform better than last year.
Health Care NTM EPS expectations are being driven higher by both Pharma and Biotech.
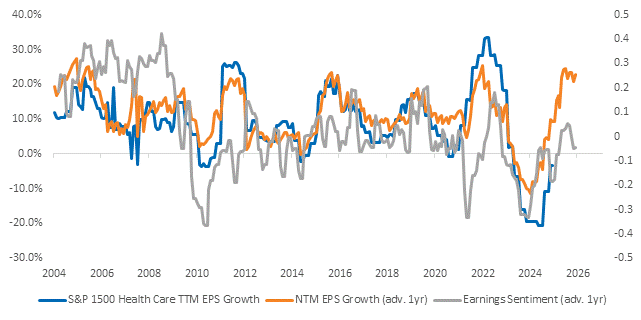
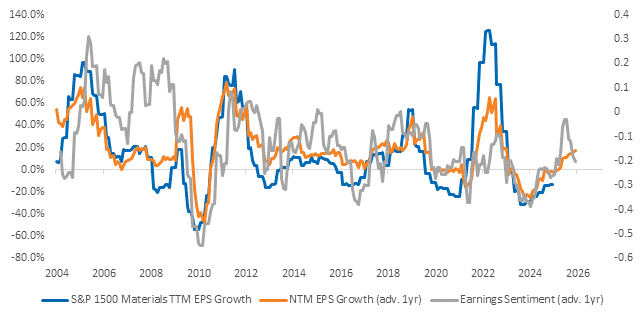
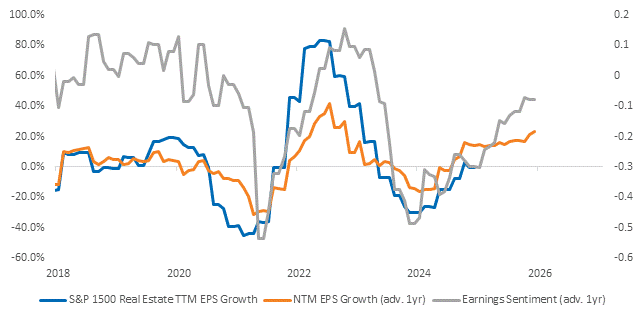
The full Industry Group breakdown is below.
Cyclicals vs Defensives
Defensives (Health Care, Staples, and Utilities) underperformed Cyclicals (Tech, Comm Svcs, Discretionary, Materials, Industrials, and Energy) in 2024, and will underperform Cyclicals again in 2025. Outside of tail risks like blanket high tariffs or exogenous shocks, the macro reasons to own Defensives are few. Health Care may get a bid because of its earnings recovery, but Staples and Utilities look particularly poor. Those two should continue to be a source of funds for unconstrained (rather than sector neutral) positions.
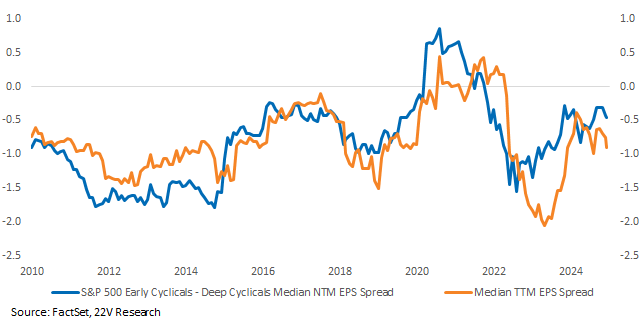
The outlook for Early Cyclicals (Tech, Comm Svcs, and Discretionary) vs. Deep Cyclicals (Materials, Industrials, and Energy) is more muddled. Even though Deep Cyclical earnings are expected to recover in 2025, there is little expected weakness in Early Cyclicals. The chart below shows Early Cyclical NTM EPS trending higher vs Deep Cyclicals. Tech earnings are expected to accelerate again next year. The likely catalyst to a Deep Cyclical rally is in Rest of World growth, which still looks uninspiring.
China will be a particular area of focus given heightened policy uncertainty from both China and the US. WHEN the China stimulus is announced (likely in the March 2025 period, after tariffs are known, HERE), the global growth outlook could change some, but for now it remains muted. There is a full section on China later on in this note.
Good Year for Stock Picking
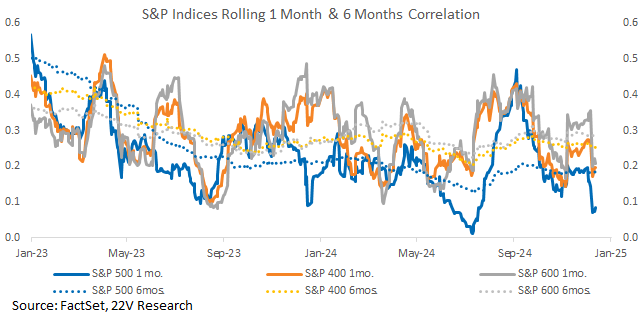
Implicit in the idea of earnings recoveries, next year should be another good year for alpha generation via stock picking. Correlations have been falling, and typically remain low in Normal economic backdrops. That makes intuitive sense as the economy is not so good or so bad that macro trends overwhelm individual company risks.
Central tendency of vol
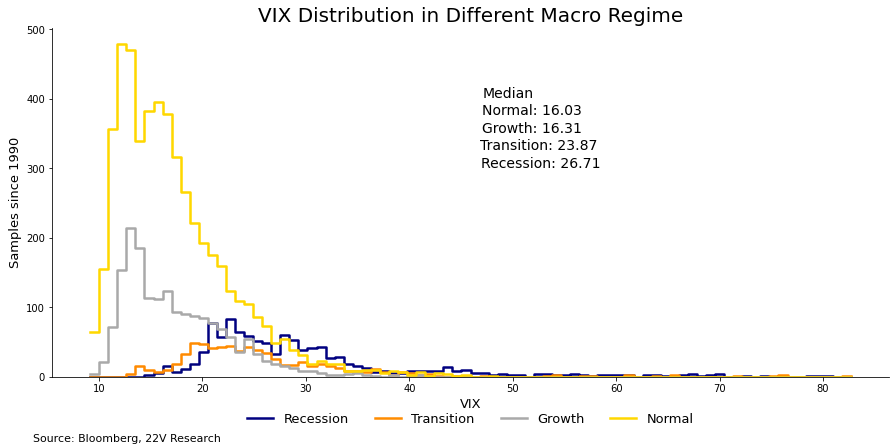
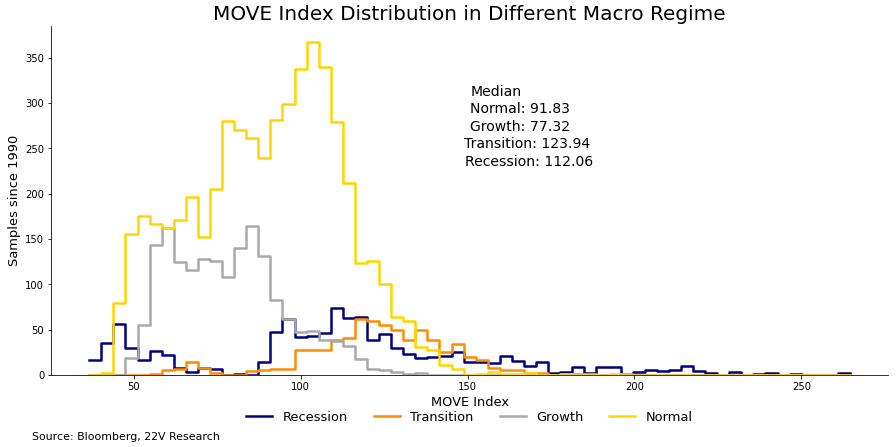
The VIX tends to be low in normal economic regimes. Spikes in volatility are vol selling/dip buying opportunities. For example, when the urate moved to 4.3% in August, it was not enough to move the macro regime. And the urate moved up because of increased labor supply, which is not concerning. We expected the backdrop to stay normal, and so the VIX at 60 was a buying opportunity. The central tendency of next year will be for this pattern to continue.
Interestingly, the MOVE (implied rate vol) does not share this central tendency with the VIX. Implied rate vol tends to compress when the economic regime is growthier. We don’t expect that kind of economic backdrop, not with service inflation on the higher end of the Fed’s target. The practical implication is that high rate vol is not necessarily a vol selling opportunity. That is compounded by tariff risks (more on that towards the end of this report).
S&P 500 Targets
Earnings Target
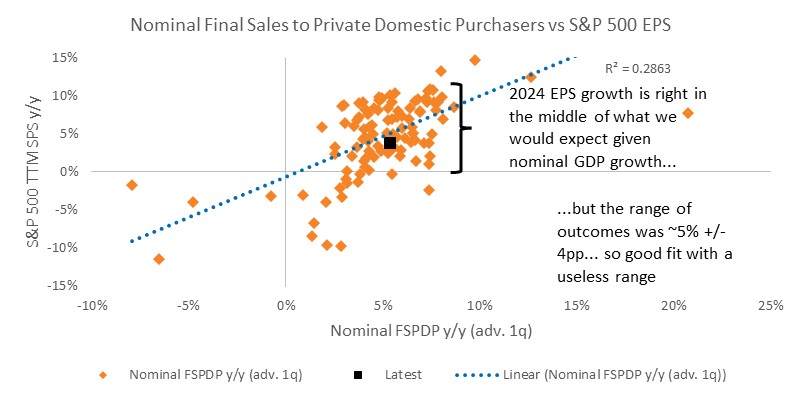
Revenue estimates are a function of nominal GDP. We use nominal final sales to private domestic purchases to strip out the noise from inventories and government expenditures. We assume nominal GDP growth in 2025 = ~6%. Modeling GDP to revenue is imprecise, but we’ll stick to the central case here, implying S&P revenue growth up +7.6%.
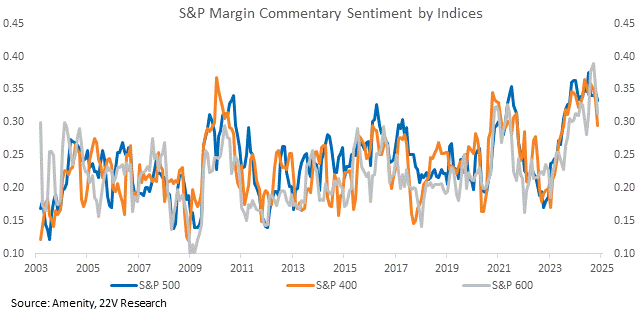
Consensus EPS margin estimates are 13.9%, which is high relative to history. Margins are NOT mean reverting, so that doesn’t matter. BUT margin sentiment – what companies themselves are saying about the forward outlook for their own margins – has rolled over, suggesting some downside risk. We assume a range of 13.5-14%.
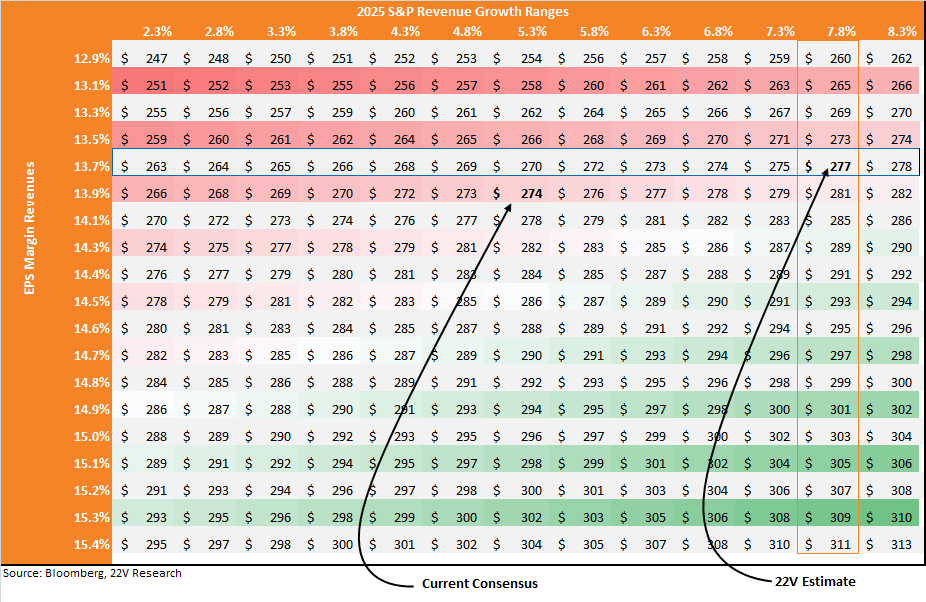
Nominal growth at 6% and margins at 13.5-14% = 2025 EPS $272 – $282, with an average of $277.
Price Target
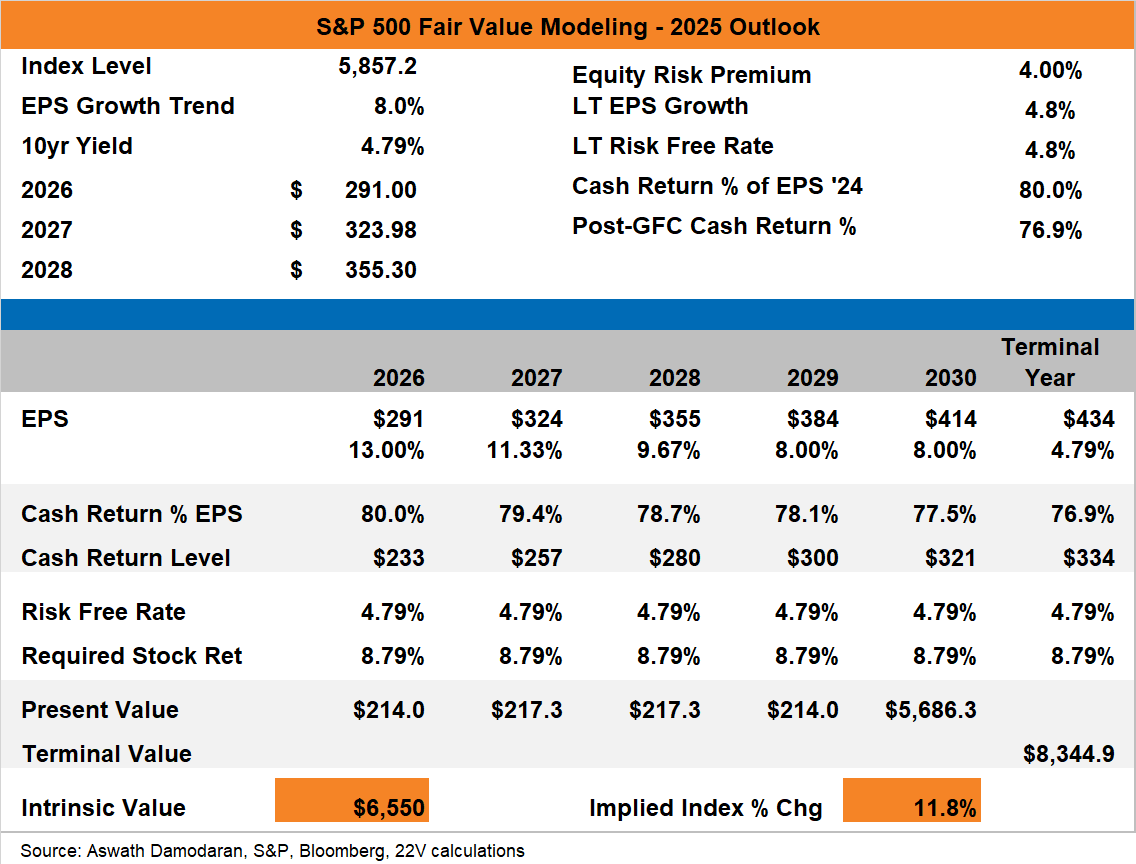
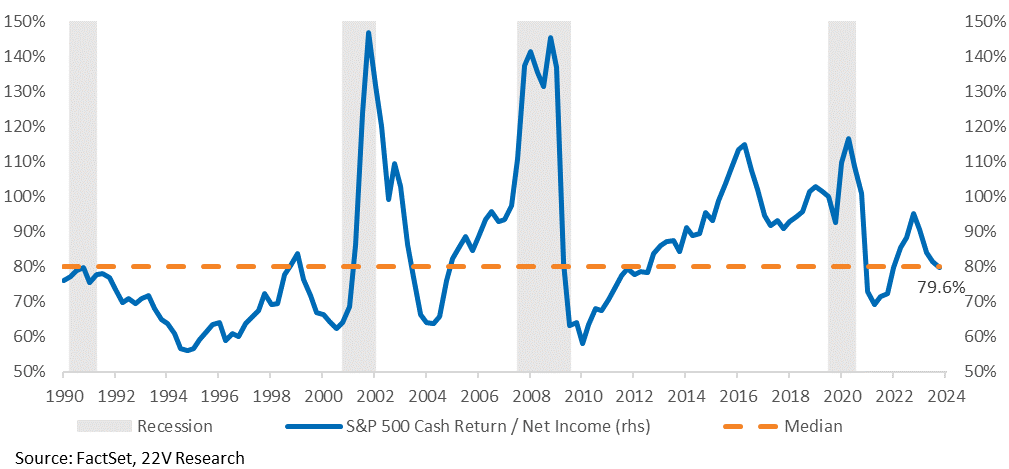
We update our fair value work, which is based on the cash return methodology laid out by valuation guru Aswath Damodaran, on a rolling basis. Usually, we are comparing current levels to current levels of fair value. For a 2025 price target though, we need to look at fair value, assuming our expectation for 2025 cash return has already been realized. In other words, fair value at the end of 2025.
Fair value for the end of 2025 is 6,550, +12% from here.
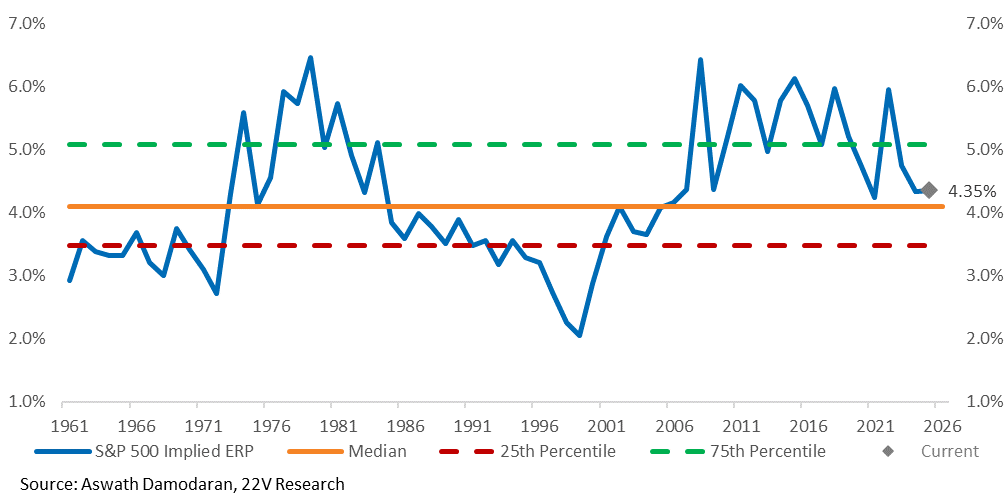
The equity risk premium (ERP) is currently at 4.3%. The version we use is based on the outlook for forward cash return – dividends and buybacks (cash return is an underappreciated part of the valuation framework).
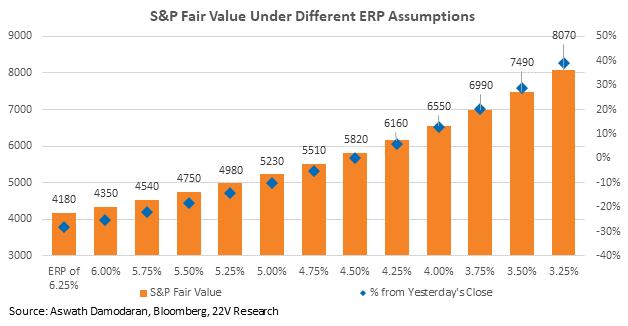
We’re projecting an ERP that stays around these levels, but drifts down towards 4%. The ERP should be the lowest it has been in a decade+ as the economic backdrop moves away from the post-GFC, low-rate regime and towards a more “normal” economic regime off the zero lower bound. An even lower ERP, which is possible but not our base case, would introduce significantly more upside. The most likely macro reason for that to happen is an AI-driven productivity boom (more on that in the next section).
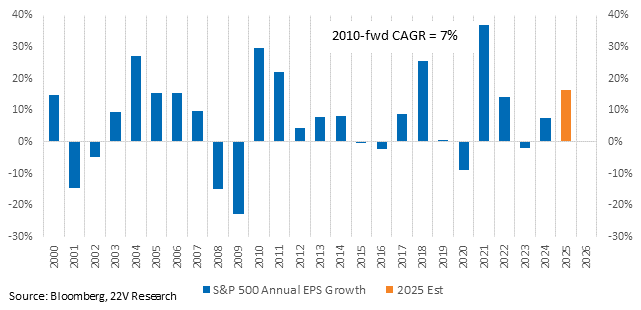
The EPS path is our 2024 EPS number, consensus 2025 EPS growth off our 2024 number, and then back to trend EPS growth. Trend EPS growth is the CAGR since 2010. We are comfortable with post-GFC here because megacap tech and network effects that helped 2010-fwd are still in place. Terminal EPS growth is equal to the risk free rate, as is standard in dcf models.
The short-term cash return ratio is set equal to the current cash return ratio, which then moves up to 80.7% longer-term based on the ratio of trailing EPS to book value, and the long-term risk free rate. The long-term risk-free rate we have at 4%. That reflects our view that neutral rates are higher than in the prior cycle.
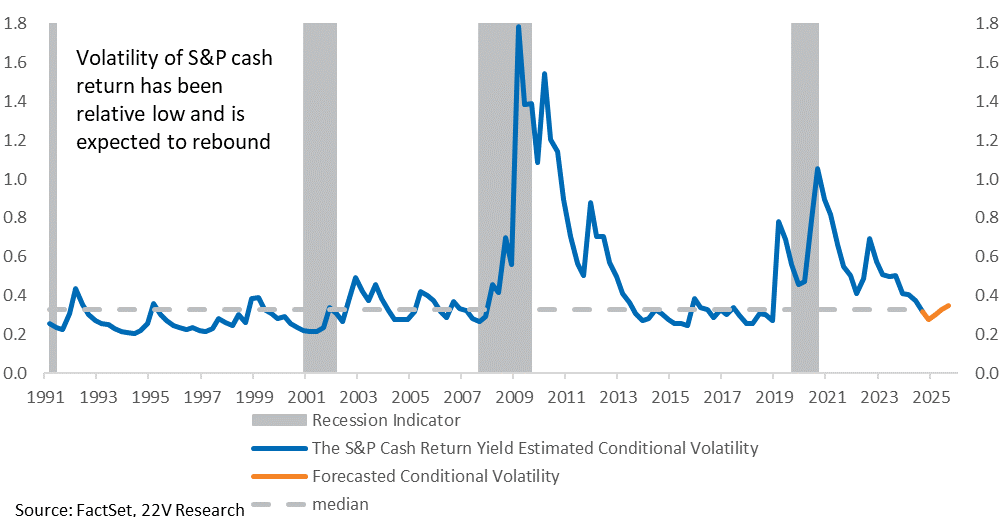
FYI, the forward outlook for cash return skews higher. The Quant team runs a GARCH model to forecast cash return volatility. The actual level of cash return is tied to the decisions of a narrow set of companies, which makes it inherently difficult to forecast, but there is a lower risk of a broad decline in buybacks/dividends. Practical implication – there is upside to fair value via a higher cash return ratio.
AI
We missed the AI trend heading into 2024. AI is becoming more macro relevant, with capex numbers growing rapidly and the AI boom contribution to overall household wealth gains. The risk that capex bottoms out creating macro ripple effects, seems low.
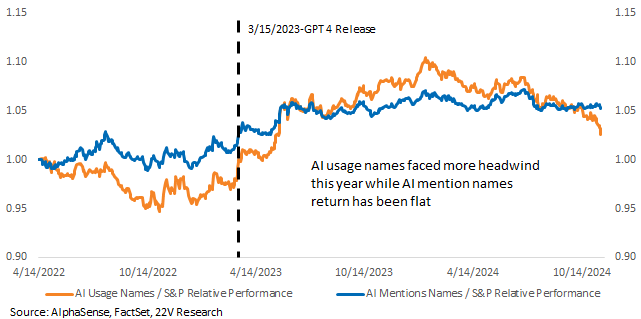
From a micro perspective, AI contributed to the incredibly strong start to the year for Growth. That impact will likely fade in 2025, though we have to put a lower confidence interval on this given we have no edge in knowing the development of this technology. What we can measure is the price performance of the companies that mention specific use cases for AI. And that performance has rolled over. Companies talking about employing AI are not being rewarded. This would flip if AI tools prove to have a great ROI, but from our expert AI calls with an Sultan Meghji (HERE), the ROI is not there in the current use cases.
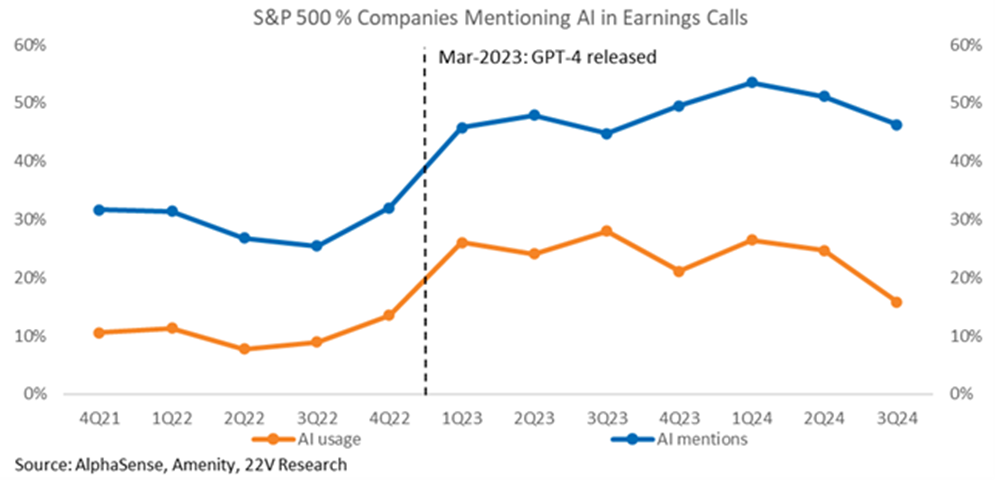
The raw number of companies mentioning specific AI use cases has dropped as well. We will track this throughout 2025.
China
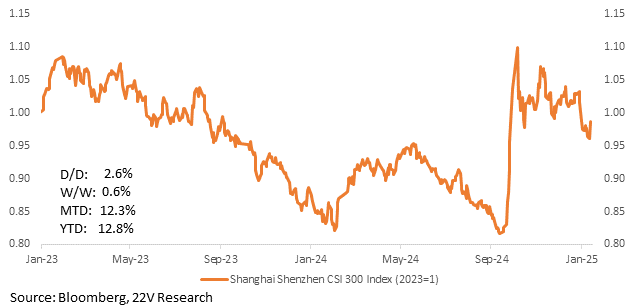
Per Michael Hirson, 22V’s China expert, the readout from China’s Central Economic Work Conference implies Beijing is finally taking deflation seriously. From Michael, “For the first time, Beijing is implicitly acknowledging deflationary pressures and targeting a return to positive price increases. And it is downplaying concerns over local government debt sustainability that have been one of the key reasons for policy restraint.” It’s NOT the proverbial bazooka, but it’s positive for risk assets. That’s particularly the case because Beijing has made clear that equities will be one of the avenues they support consumer confidence via (HERE). There is a special lending program for listed firms/major shareholders to purchase/buyback stock at a rate of ~1.75% (max 2.25% rate). That is WELL below A share cash yields, which are ~6.5%. That puts a floor on equity returns.
2025 Tail Risks
Inflation
The tail risk most likely to move the macro classification model out of Normal is inflation failing to track tolerably towards the Fed’s 2% target. For 2025, that means tracking above 2.5% (ex the potential impact of tariffs). Demand growth is firm, and as Gerard pointed out, a “reacceleration [of private employment] from here, perhaps soon, seems more likely than not, barring a disruptive policy shock” (HERE). Friday’s data delivered on that. RISKS have increased that interest rates need to increase/FCI tighten to push core PCE closer to the Fed’s 2% target.
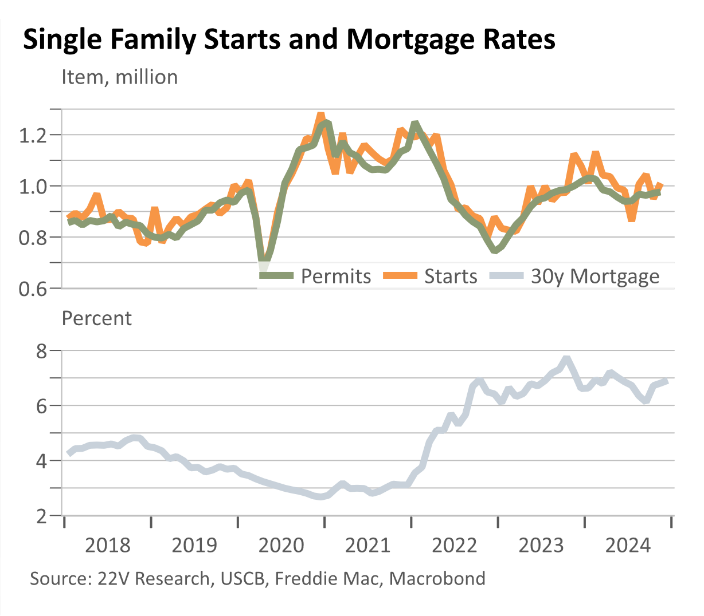
It is also possible employment in interest rate-sensitive industries (Housing, Auto, Manufacturing, etc.) needs to roll over, increasing recession risk, to bring core inflation to the Fed’s 2% target. That would be in addition to some mild tightening of FCI to slow growth of the interest rate-sensitive sectors mentioned above. That is because of strong consumer spending, particularly on services, and well above trend real income growth. Service inflation looks to be settling at ~3.1% (core services PCE), which is too high.
That would lead to a meaningful tightening of financial conditions, benefitting risk-off factors and Defensives. Financial conditions, based on a modified version of the Fed’s FCI-G model (HERE), implies a 20bp impetus to economic growth over the next 4 quarters, if asset prices were to hold at these levels. That would have to shift to a drag on growth if inflation were to sustainably (vs noisily) reaccelerate.
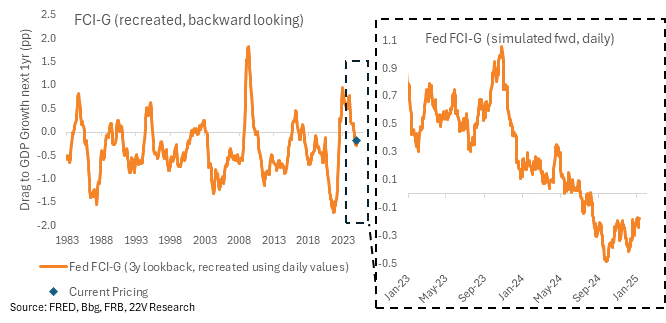
A couple reasons this is not our base case, though, first from Peter and second from Gerard… 1) service inflation would be coming from cyclical strength, which can be solved via higher rates acting as a natural governor on economic growth…
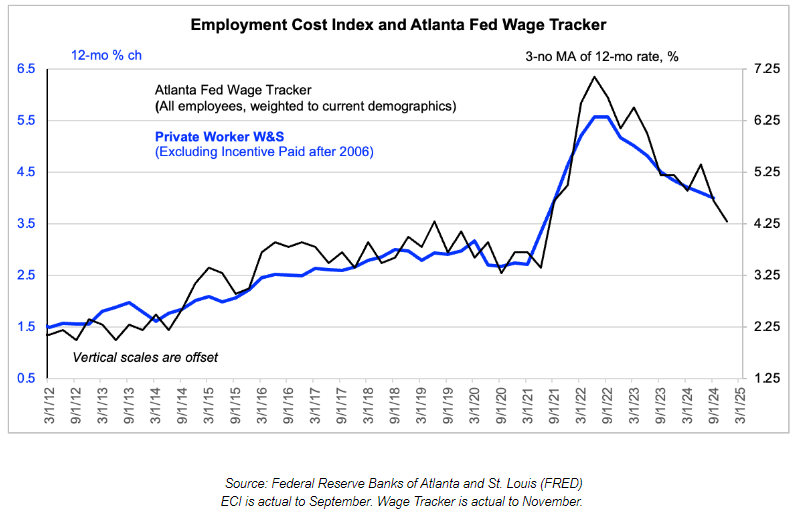
… while 2) wage growth, which is high in level terms, could be a catch-up effect (to earlier inflation and to recent productivity) rather than an indication the labor market is too tight. First, though, wage growth looks to be decelerating anyway…
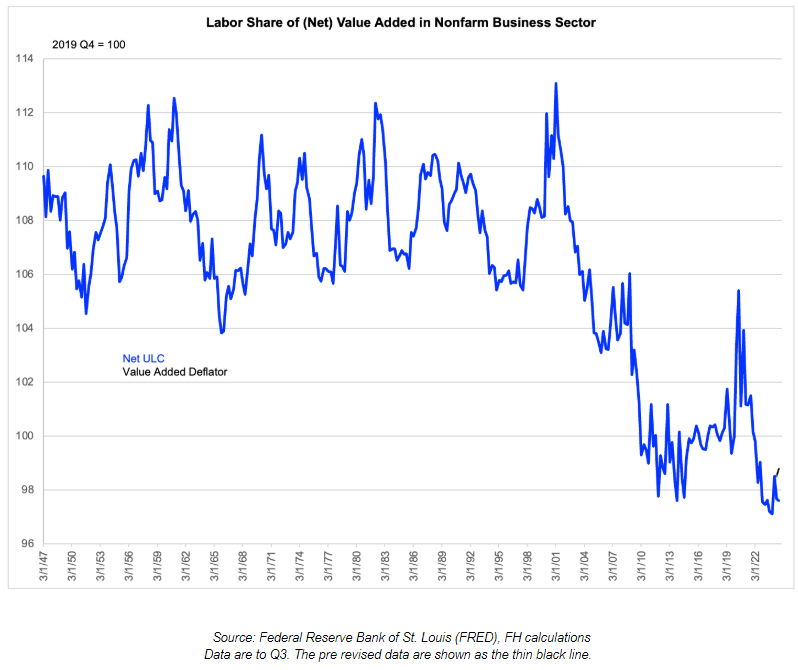
… while second, labor is not driving costs higher. More technically, labor share of net value added in the nonfarm business sector is low.
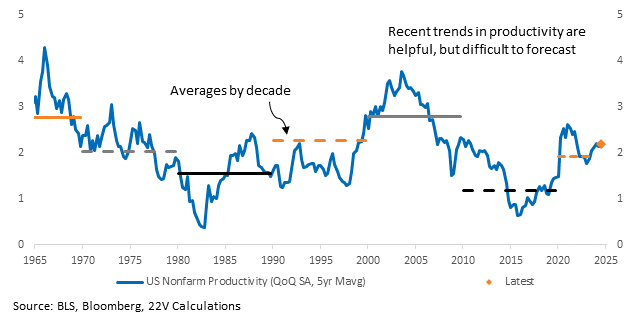
It is also possible, though, that productivity is strong enough to allay these fears. This risk is not our base case either. But it does increase the importance of 1Q inflation and labor prints.
Policy Uncertainty
A transactional President Trump would be more market-friendly than a more dogmatic administration. That’s our base case in terms of tariffs. And Trump tends to liken equity prices to an approval poll, which probably helps steer the administration away from market unfriendly policies. But even in a transactional presidency, there will be tariff threats that will raise the central tendency of vol. We have already experienced the risks from competing tariff headlines, a market reality that will stay with us in 2025. This is a reason to expect rate vol to stay elevated. But, again, our base case is no supply shocks that would derail the economic (and market) backdrop.
From Kim Wallace and Sandra Namoos, 22V’s Washington Policy team, “One vol risk from those tariff threats, much less actual tariff announcements, will be potentially affected parties’ reactions. This includes trading partners, US consumers, investors, and US businesses as they are forced to game out the risk of threats relative to possible action. The New York Fed’s Liberty Street researchers last week released a report on the many observed consequences of 2018/19 tariffs, concluding that the negative effect on the US economy was “substantially larger than past estimates.” The authors acknowledge significant uncertainty in reliable real-time estimates, but found evidence when looking at the day-of and longer-horizon valuation changes to yields, stock prices, dividends, that tariffs led to a drop in national revenues and investor pessimism, particularly toward specific companies and risk assets in general (see Using Stock Returns to Assess the Aggregate Effect of the U.S.-China Trade War).”
Swaps
We have a series of tradeable idio and factor theme swaps live. All available for viewing in a Bloomberg worksheet – just ask us if you’d like us to send it to you. Here are the strategies we expect will be most relevant for 2025, presented via the conditions for the long and short to outperform.
As highlighted above, a broadening out of returns + fundamental factor leadership is one of our higher conviction themes for 2025. One way to express this view is going long SMID Cap GARP (MS22GARP Index) and short the S&P 100 (MS22100 Index). Pair trade is MS22LGSM Index. If your view is that Size and Mo will sustain their 2024 pace, flip the pair to go long MS22100 Index and short MS22GARP Index.
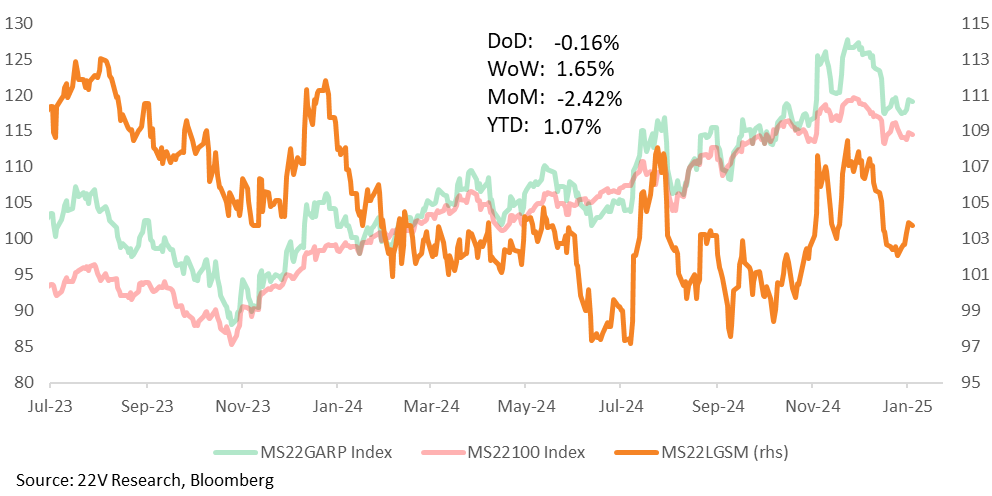
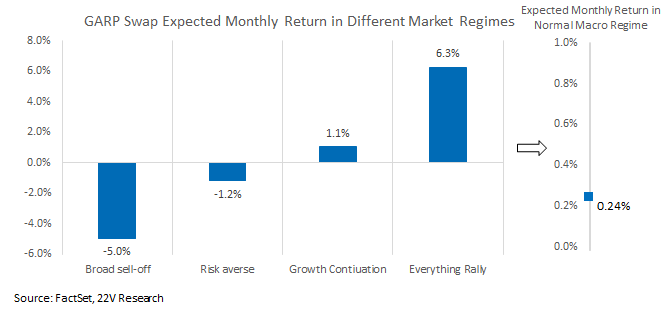
Our formulation of GARP is the S&P 400 + 600 names with average Value and Growth scores in the top quartile of each. If fundamental factors outperform this year as we expect, in addition to Value and Growth tailwind, Momentum and Quality exposures and negative exposure to Low Vol should be a source of positive returns. Regime scenario analysis shows that the swap performs best during Everything Rallies and delivers positive returns during Growth Continuation periods, the two regimes we expect to appear more often during 2025. Under a Normal macro regime, the expected monthly return for the basket is ~0.24% per month.
The pair trade of Retail and Transports ex Airlines (MS22RETL Index) vs Consumer Services (MS22SERV Index) is a good way to position for tariff outcomes. Long Retail and Transports ex Airlines for a benign tariff outcome, and long Consumer Services for a tariff supply shock. FYI, Transports have one of the biggest expected earnings accelerations (+41pp). Retail is expected to decelerate but remain strongly positive (22pp). The pair is pricing in a lot of bad outcomes…
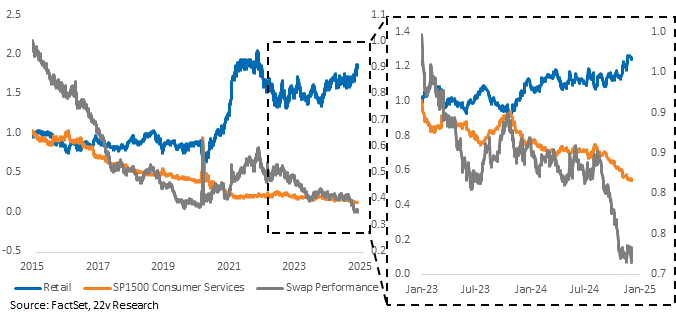
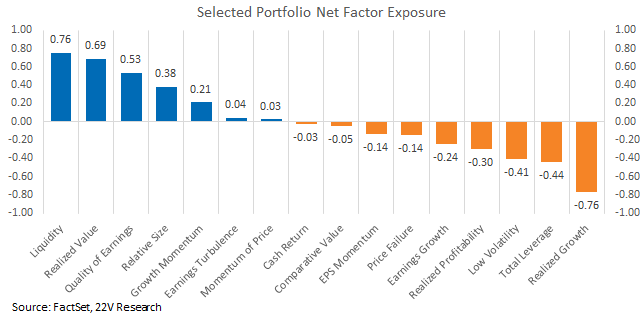
Meanwhile, as highlighted in a recent expert call hosted by 22V (replay HERE), the holiday shopping season has beat expectations. Company sentiment and analyst expectations have inflected higher. However, one of the biggest headwinds has been the strong Realized Growth of the short. The swap is very exposed to 2024’s leading factor, but Value’s negative beta is expected to improve, relative to Growth, in 2025 alongside factor EPS. This is one of the pockets to play a reversion in Value vs Growth without shorting AI/Tech.
To start the year, we’ve fielded a number of questions on how to play changes in the 10yr via equities. There are multiple options, all dependent on why the 10yr is moving. First, and what comes up most often, if 10yr yields are increasing because of more restrictive monetary policy. In this case, short companies with high variable debt (MS22VARD Index) and companies with volatile cash flow and deteriorating debt ratios (MS22DEBT Index). The underperformance would be worse if employment in housing, construction, and manufacturing needed to roll over. For a pair trade, long Quality and short Debt. Ticker MS22LQSD Index.
In the POSSIBLE, though not likely, scenario that activity rebounds but inflation remains benign in a productivity boom, 10yr yields would increase because real economic growth is better, and financial conditions would not tighten. Debt baskets would rally, aggressively. In addition, go long companies with low debt and high economic sensitivity (MS22LDHE Index). Historically, this group of stocks is correlated with high frequency activity indicators, but not with 10yr yields. In other words, they will benefit from better activity but shake off higher debt costs. That would be a significant reversal from last year.
2025 Investor Expectations
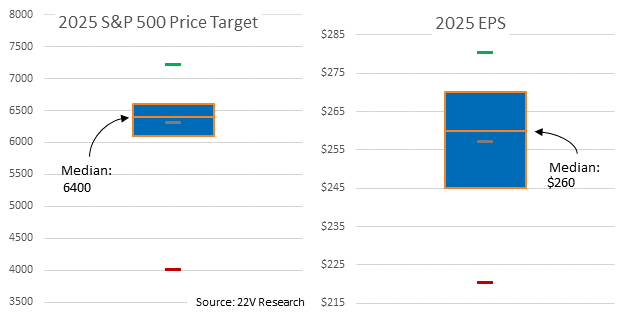
The investors we polled have a median S&P 500 price target of 6400 (+8% from here), and a median S&P 500 EPS target of $260 (+7%). That implies both limited expansion and significantly lower EPS growth than consensus ($273). This rhymes with our underlying theme that EPS need to show up in 2025 for the average stock to outperform.
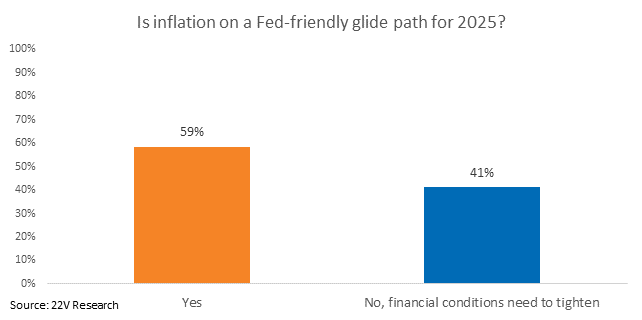
59% of our survey respondents think inflation is on a Fed-friendly glide path for 2025. 41% think financial conditions need to tighten. More investors expect FCI to tighten than before the December CPI and FOMC (36%, see HERE).
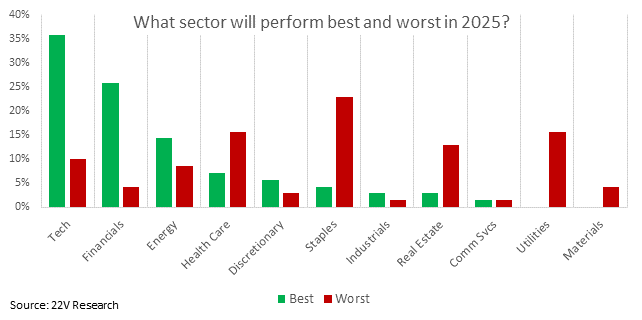
Investors prefer Tech and Financials for 2025, and think Health Care, Staples, Real Estate, and Utilities will underperform. That is heavily tilted towards Cyclicals over Defensives, a view we agree with.
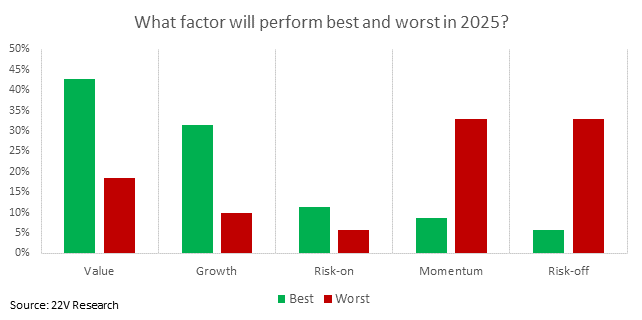
The most popular factor long in 2025 is Value, with Growth coming in second. Momentum and Risk-off are out of favor.
AI and Energy (in which AI was frequently mentioned) dominate the favorite idio themes for 2025. There’s also frequent mentions of SMID caps, a disinflationary boom, reinflation, and M&A.
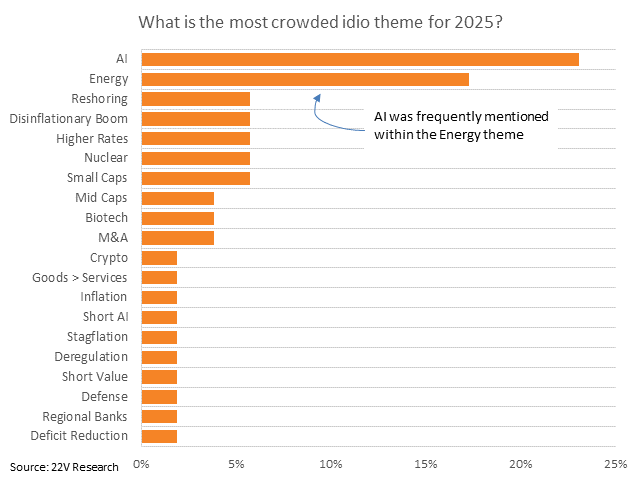
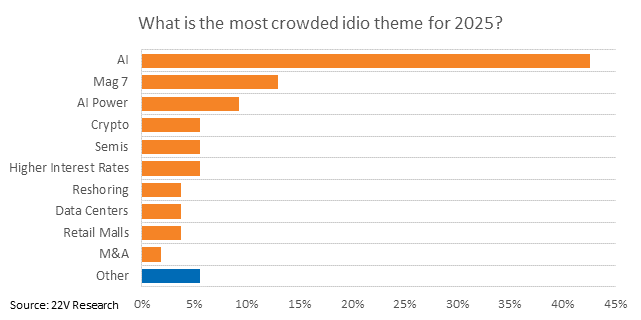
AI, Mo, and AI-related themes (semis, power, data centers) dominate the most crowded idio themes for 2025. So, AI is a top theme and a most crowded theme.