

Assessing even the current pace of employment growth is tricky because the contemporaneous data may overstate the momentum. But a reasonable judgment here would be that private employment growth has probably bottomed at a pace that is consistent with the economy avoiding recession. And a reacceleration from here, perhaps soon, seems more likely than not, barring a disruptive policy shock, which – in fairness – I am not the least able to exclude. In this note, I briefly explain why I see it this way.
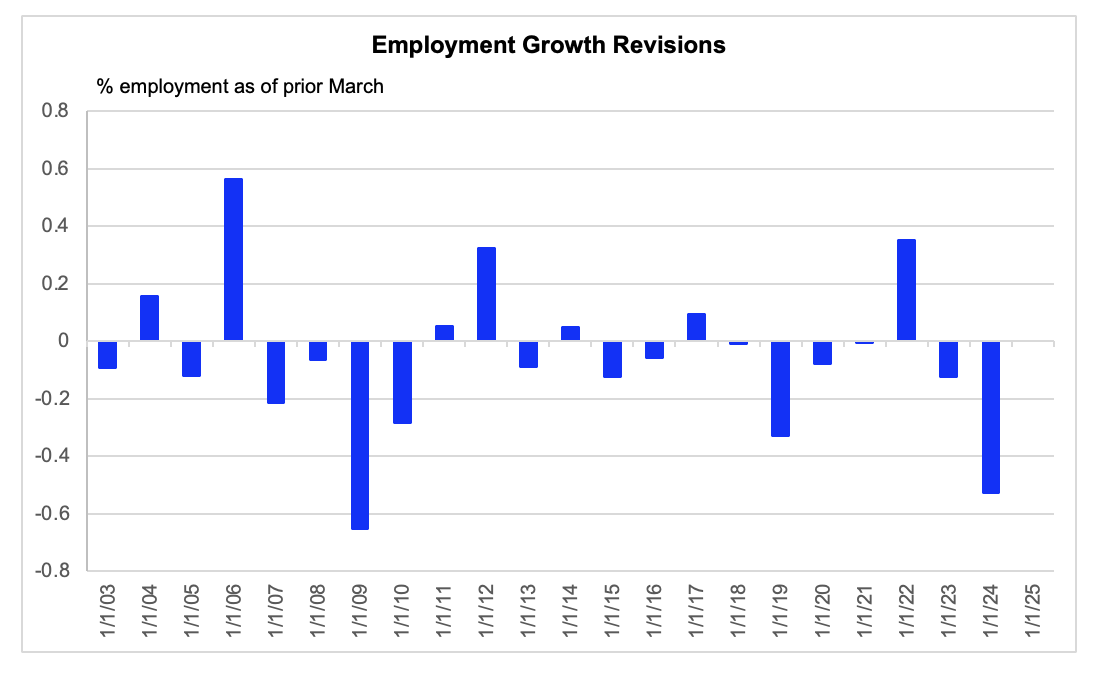
Let’s start with the issue of revisions. We know from the BLS’s preliminary estimates last August that private employment growth during the 12 months to last March is (still) overstated in the current data by just over 800k. This implies that employment growth is overstated by an average of 62 basis points (ar) during each of the twelve months to last March. We will get a formal measure of which months were most affected when the formal revisions are produced next month.
We do not have a reliable indication of how much employment for the recent period will be revised downward, if at all. Last month’s Quarterly Census of Employment and Wages (QCEW) for the second quarter made for grim reading on this point. But Guy Berger, a labor market specialist at the Burning Glass Institute, has explained that the QCEW is very volatile and does not map to BLS employment revisions at a quarterly frequency. See the discussion here. So, I am going to stick with my earlier approach of splitting the difference and assuming that the overstatement since March is half that of the twelve months to March. This is partly because those revisions were so outsized from an historical perspective and partly because the revisions themselves have tended to be cyclical, especially since the mid-1990s. In fairness, the large revision to be published next month will not conform with that pattern, but that is the pattern. And the data revisions coming next month are themselves subject to later revision.
This year’s annual revision is unusually large
Source: Economic Policy Innovation Center (EPIC), as linked above, Bloomberg, FH calculations
Data are actual to 2024. Please note these data reflect revisions to total, rather than private, employment, because the EPIC data depict that.
The chart below shows a history of the 3-month rate of private employment growth during the past few decades. The measure is “corrected” by subtracting 62 bps from the growth rates for April 2023 to March 2024, and then 31 bps for the period since then. I show the 3-month growth rate (rather than, say, a 2- or 4-month rate) to bracket the effects of the hurricanes and strikes late last fall, and I include the consensus estimate for next Friday (+133k), even though that estimate is not yet well populated. My best guess, then, is that employment growth has bottomed. And I should mention in passing that this bottoming is not just an artifact of the series break I impose between April and March of last year. The low for the corrected growth rate was in August. In fairness, the pace of employment growth looks worrying, particularly for those (not me) who might believe the concept of a stall speed here. I would put more emphasis on the notion that the downward momentum has at least for now been broken, for reasons that are hopefully obvious from just a quick look at the chart.
Private employment growth has recently stopped decelerating

Source: Bloomberg, NBER, FH calculations and estimates
Data are actual to November, consensus for December, and “corrected” as described in the text.
We might be tempted to add here that the recent trends in initial and continuing unemployment insurance claims are inconsistent with the notion that employment growth is faltering here, especially if we control for calendar effects as well as the perennial trouble with seasonal adjustment itself. For example, applying the seasonals and calendar from 2019 generates a relatively upbeat take on this issue. And there might well be some incremental information there. But I assume the signal is largely incorporated into the consensus take for how the December employment data will print (let alone the subsequent revision), and I want to avoid double counting the signal.
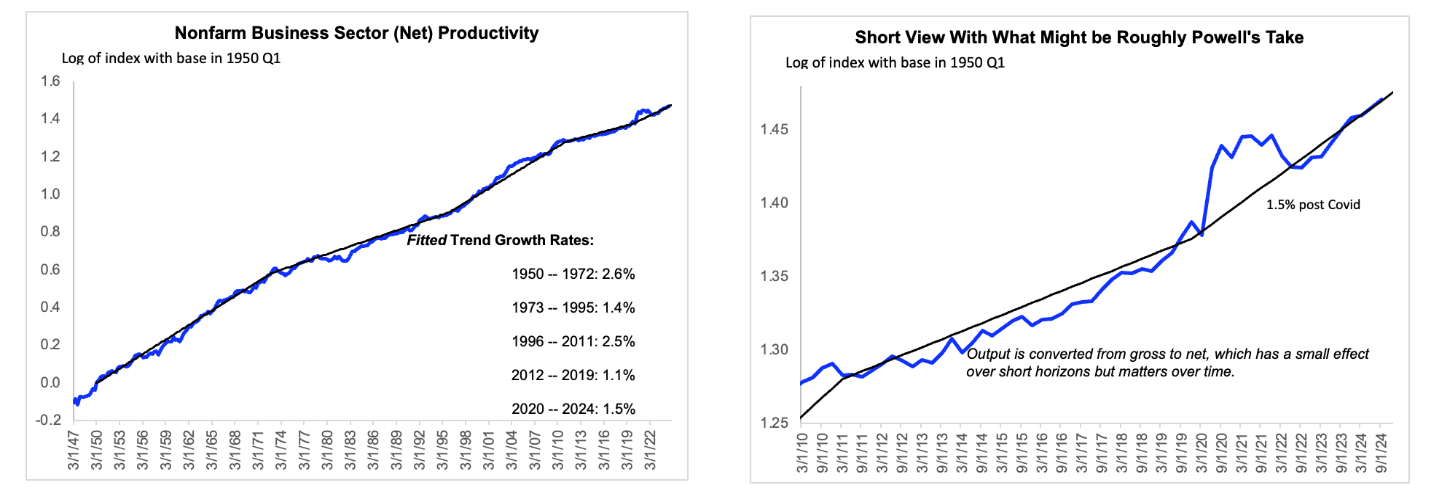
Looking further ahead, the main reason to be optimistic here is that employment growth tends to follow aggregate demand growth, which has been strong. I concede that employment growth can itself be a source of momentum behind demand growth, which is presumably why it is so closely followed by analysts and in markets. But job-related income growth has been strong enough not to worry much about this effect, as I have discussed in earlier notes. More to the point, the causation runs primarily from demand to employment. And the recent reacceleration of demand growth has now been running long enough that it should have implications for employment growth, which – to repeat – looks in the data like it might have bottomed. Closely related, productivity growth has recently been surprising to the upside, which suggests – admittedly without proving – that labor hoarding has not recently been an issue.
Little evidence of labor hoarding in the productivity data
Source: Federal Reserve Bank of St. Louis (FRED), FH calculations and inferences
Data are actual to Q3
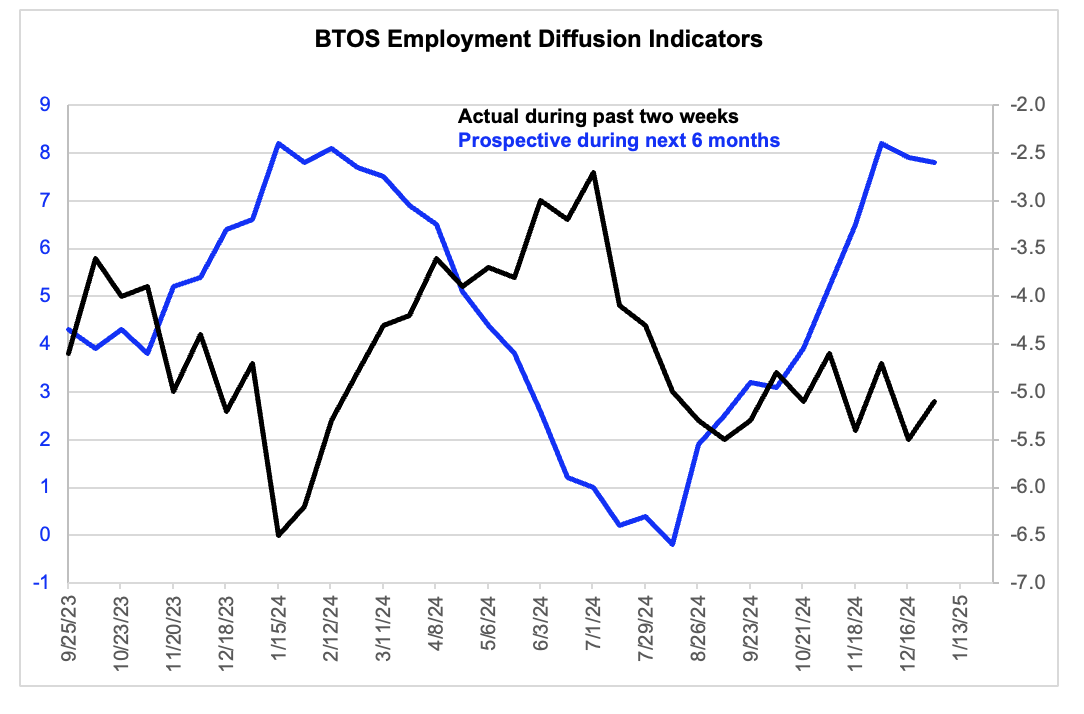
Meanwhile, the Census Bureau’s new Business Trends and Outlook survey shows that employers report that their hiring intentions have moved substantially higher from the interim (and record, given the brevity of the time series) low achieved in August, when private employment growth itself was on its low. And it remains at near its highest level in the (brief) history of the time series. The diffusion index measuring actual employment change during the trailing two weeks remains near, but not below, it low for this episode, although – again – I would lean more on the consensus for next Friday than on any one specific indicator of current employment growth. Incidentally, in the chart below I show these series on a dual vertical scale. Some sophisticates think that the dual scale is slippery, but their prejudice is unfounded. Depicting these series on a common scale would not make much sense, in part because two weeks is different from six months. Doing it properly allows us to see that there is some evidence that intentions lead. It is two for two, within the survey as shown by the chart. And the intentions lead actual private employment growth almost as reliably so far, although that is not shown in the chart.
Hiring intentions have rebounded strongly
Source: Census, FH calculations
Data are actual to the last two weeks of December.
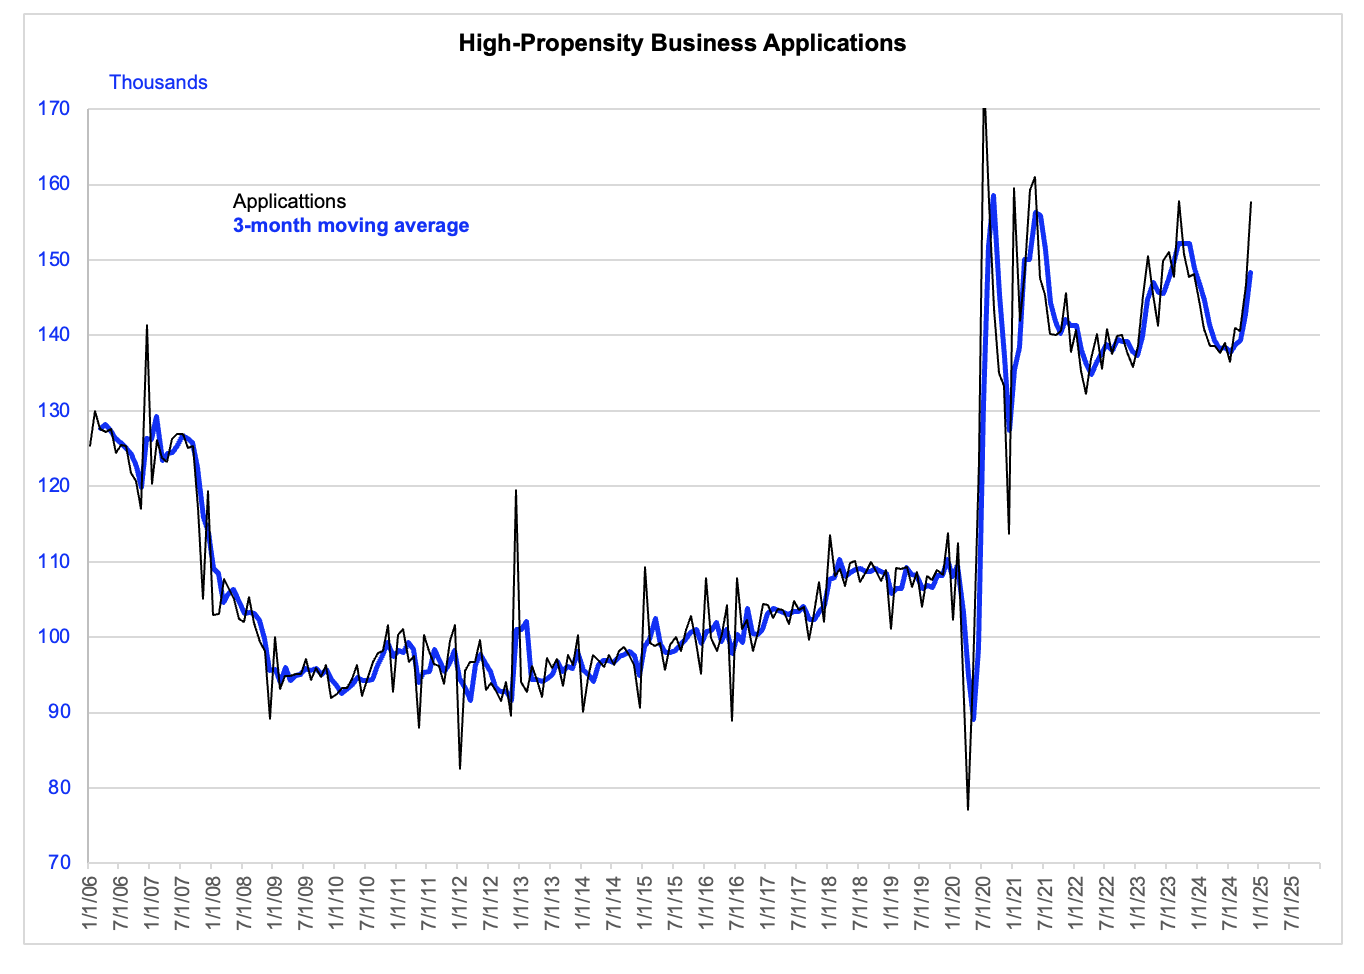
Looking still further ahead, there is also some grounds for optimism in the Census Bureau’s measure of High Propensity (to hire) Business Applications series. As a recent study published at the NBER has documented, this series is highly predictive of actual business formation and is a long leading indicator of employment growth and the business cycle more broadly. The indicator is probably less informative than the recent strength demand and productivity and the recent upturn of measured hiring intentions. But evidence of continued business dynamism would seemingly be a positive.
An additional positive related to the more distant prospect
Source: Federal Reserve Bank of St. Louis (FRED), FH calculations
Data are actual to November.

