

Summary: Decoding the market-implied outlook and monetizing the discrepancies between it and one’s own macro perspective are fundamental to developing a macro-informed strategy. For equity-focused macro investors, these tasks tend to be more challenging because the equity market 1) blends multiple non-macro signals and lacks explicit links to macro metrics like growth and inflation; 2) unlike the traditional macro areas like FX and rates markets, it lacks accepted tools to express a macro view.
To help equity investors better understand what equities are signaling and to positions from a macro standpoint, we developed a Market Internal Regime (MIR) model. With this model, equity investors can 1) get an objective perspective of how the equities respond to macro dynamics and 2) develop a framework to translate their macro outlook into factor strategies systematically.
We start with the weekly returns to each of our 16 equity market factors. Starting from there, we determine if a link should be built between each pair of dots/weeks according to the similarity of their factor returns. After constructing all possible links, we apply a graph cut algorithm to divide the weekly data into four groups, such that weeks within the same group have similar factor performances. In contrast, weeks in different groups have distinct factor performances. The resulting four groups form our regimes, the frequency of which we highlight below.
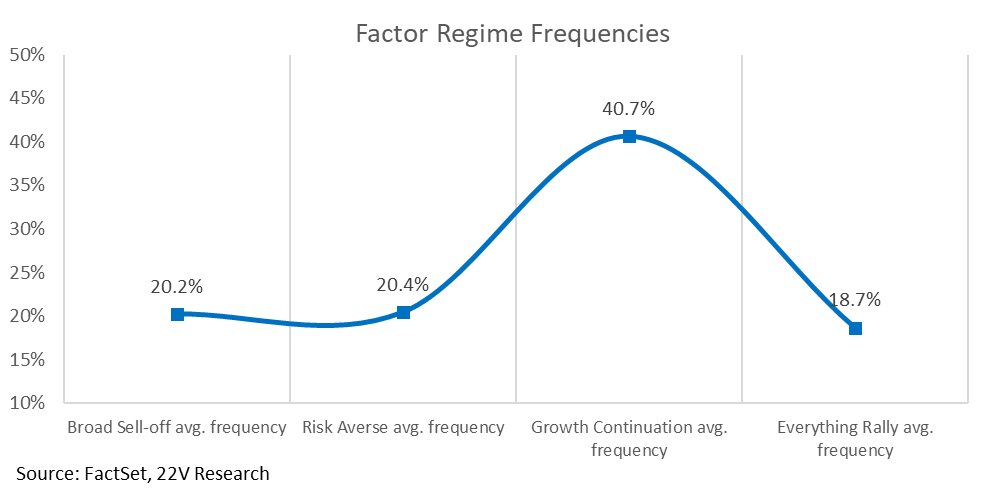
Our market regime model essentially provides a quantified and interpretable view of equity market internals and the associated macro outlooks. Since the model is factor-native, the insights developed from analyzing historical regimes can be readily applied to general risk management and alpha generation processes.
We get into the specifics of the model construction and uses in the full report. There are two quick conclusions for today’s backdrop. If an investor expects risk-dominant regimes to persist due to macro uncertainty, being long Size and Price Failure at the same time (High Size + Low Short-Term Momentum) makes sense. Price Failure performs well in both risk-on and risk-off scenarios, and Size should amplify this performance.
If an investor anticipates a soft landing, style-dominant regimes should return as asymmetric risks fade. The specific portfolio strategy then depends on the micro view. 1) In an orderly normalization where both established and small companies can grow at a more balanced pace, GARP (Growth at a Reasonable Price) is the preferred strategy. 2) In a mild slowdown with downside risk overhang, buying Momentum on dips (High Long-Term Momentum + Low Short-Term Momentum) might be a better choice.
Why Create a Market Internal Regime Model: Traditional technical indicators like RSI, % above 200 MA, etc. are mostly single variate and mainly focus on capturing the directional trend at an aggregate level. These binary signals are very helpful in market timing and trade execution but do not reflect the detailed dynamics underlying the market (rotational movement and lead/lag structure), which limits the possibility of studying how macroeconomic narratives impact markets.
Our MIR model is based on the returns of 16 well-defined risk and style factors with clear links to economic logic. The model classifies the market into four distinct regimes by maximizing how factor returns differ across regimes. As these factors are based on specific economic logic and capture the market internals at a higher dimension, the resulting regimes are also linked to certain economic narratives.
Identifying these regimes provides a systematic method for determining what economic path is currently priced into equity markets. Investors can compare that market regime to their own macro outlooks and/or prevailing macro narratives. In a related use case, investors can use macro-linked market regimes to hedge macro risks and develop rule-based strategies based on their economic views.
Clustering Methodology: Factor returns typically deviate from a normal distribution. Considerable skewness and heavy tails are quite common in the factor zoo. In addition, some factors respond to market sentiment in a linear way, i.e., they may underperform in BOTH unequivocally bullish and bearish markets but perform quite well when the market sentiment is moderately optimistic or pessimistic.
Given that backdrop, for factor analysis we prefer using a bottom-up spectral clustering model over alternatives such as K-means or Gaussian Mixture Models, which impose a normal distribution assumption to the underlying data. Thanks to its distribution agnostic nature, spectral clustering can identify more complex non-linear contours of factors and handle clusters of varying shapes effectively.
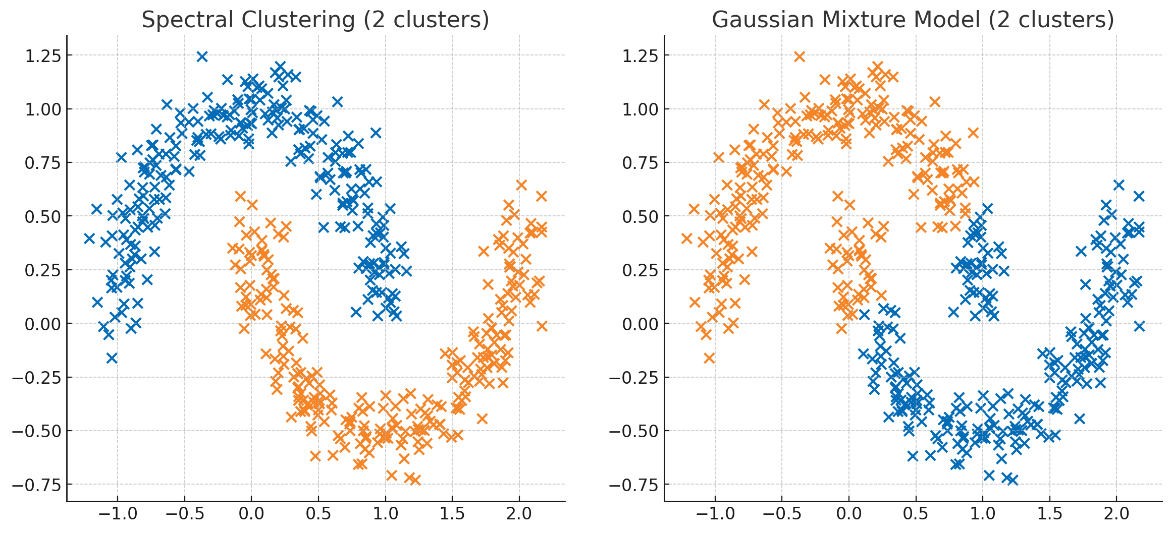
Source: ChatGPT, 22V Research
Spectral clustering is originally inspired by graph cut algorithms, whose goal is to divide a graph (a collection of dots with links/roads connecting them) into several groups in a way that the connections within each group (inner connectivity) are maximized while the connections across groups (interconnectivity) are minimized. In our context, the graph is a collection of dots in a 16-dimensional factor space, with each dot representing the active returns of our 16 main factors during a certain week. Starting from there, we determine if a link should be built between each pair of dots/weeks according to the similarity of their factor returns. After constructing all possible links, we apply a graph cut algorithm to divide the weekly data into four groups, such that weeks within the same group have similar factor performances, while weeks in different groups have distinct factor performances. The resulting four groups form our regimes. As a side note, here we chose the four-regime system because 1) it delivers the best clustering performance, i.e., the highest Silhouette score, and 2) it is easier to understand compared to models with more regimes.
Characteristics for Different Periods: Our market regime model categorizes historical weekly factor performances into four distinct regimes. The “Everything Rally” and “Broad Sell-off” regimes represent the two unequivocal risk-on and risk-off regimes, which occur less frequently; “Growth Continuation” and “Risk Averse” regimes are conservatively bullish and bearish internals and are more commonly observed.

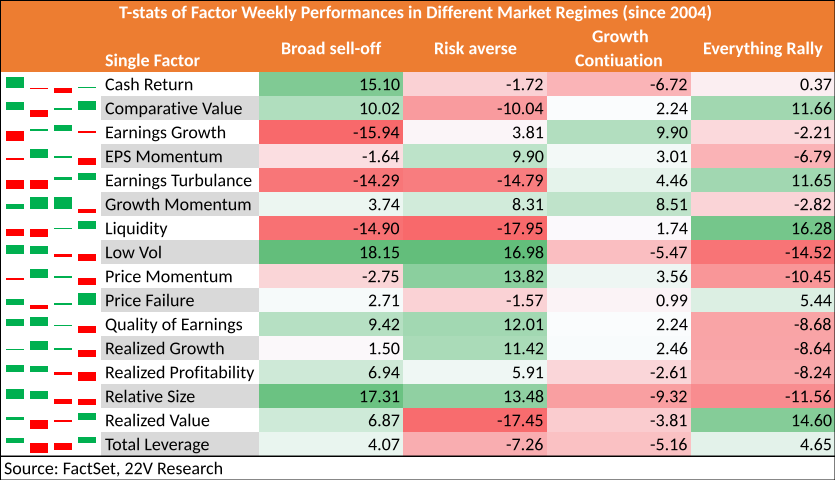
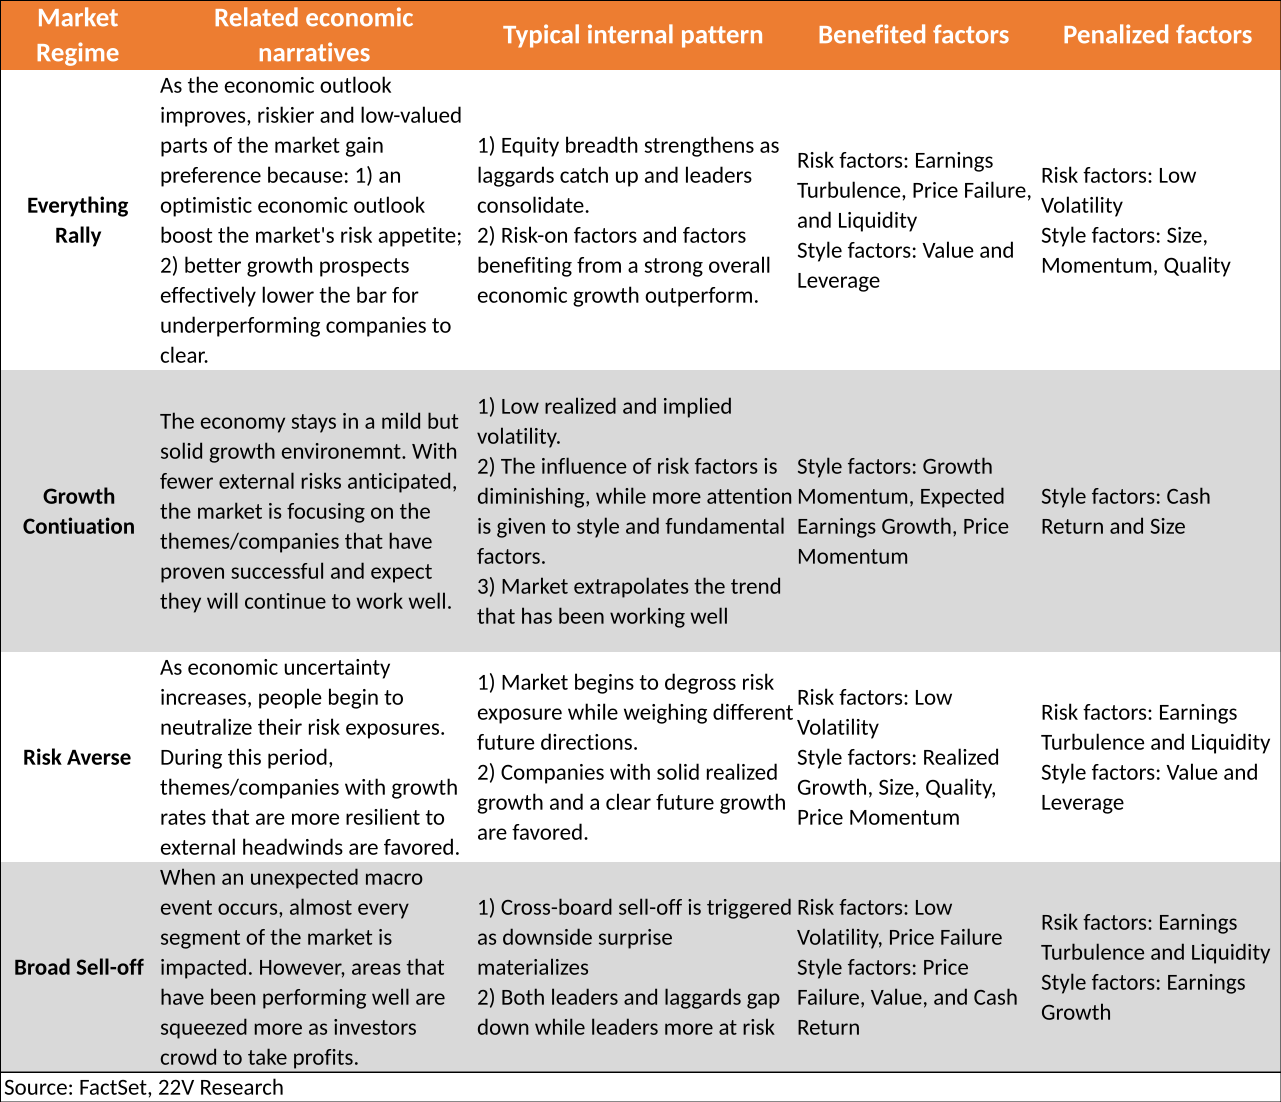
Below is a detailed explanation of the economic logic behind each market regime, along with the factors expected to outperform/underperform in each of them.
Use Cases: Our market regime model essentially provides a quantified and interpretable view into equity market internals and the associated macro outlooks. Since the model is factor-native, the insights developed from analyzing historical regimes can be readily applied to general risk management and alpha generation processes. We present several use cases of this model below, and additional use cases will be discussed in upcoming reports.
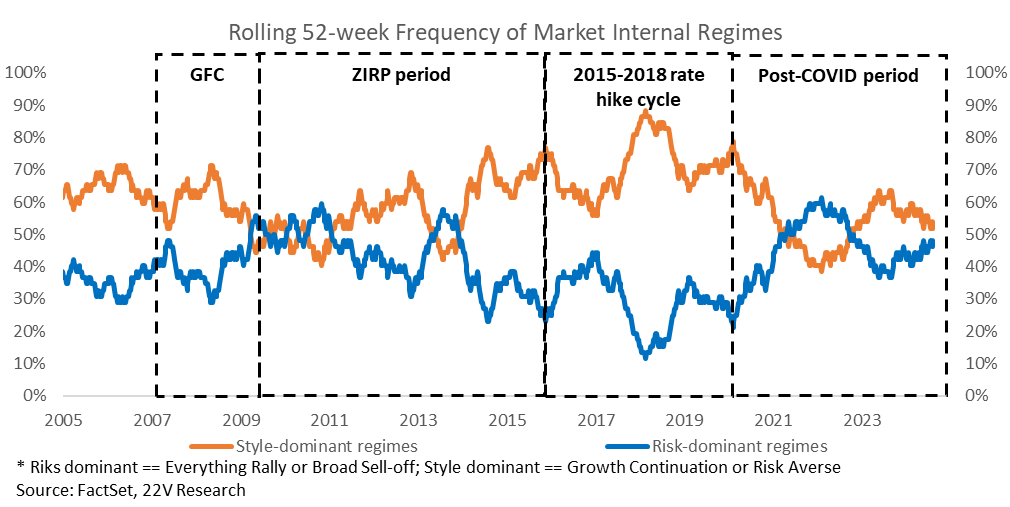
The most straightforward application of the MIR model is to develop a better understanding of market internal sentiments and adjust baseline expectations accordingly. Since COVID one of the most fundamental shifts in market internals is the risk-dominant regimes (Everything Rally and Broad Sell-offs) becoming significantly more frequent, while style-dominant regimes (Growth Continuation and Risk Averse) have become less common. This contrasts with the pattern observed during normal economic periods and aligns with our observation of heightened correlations across stocks since COVID.
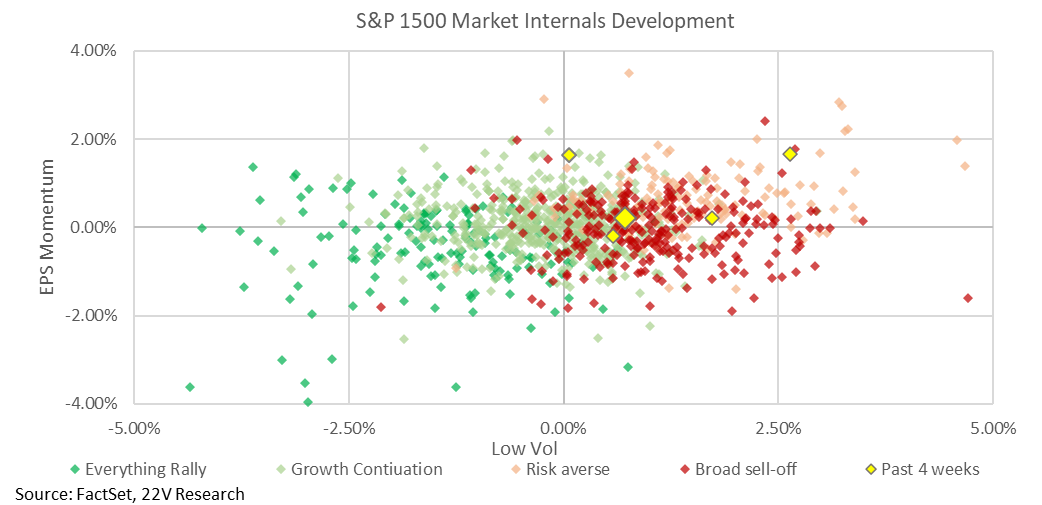
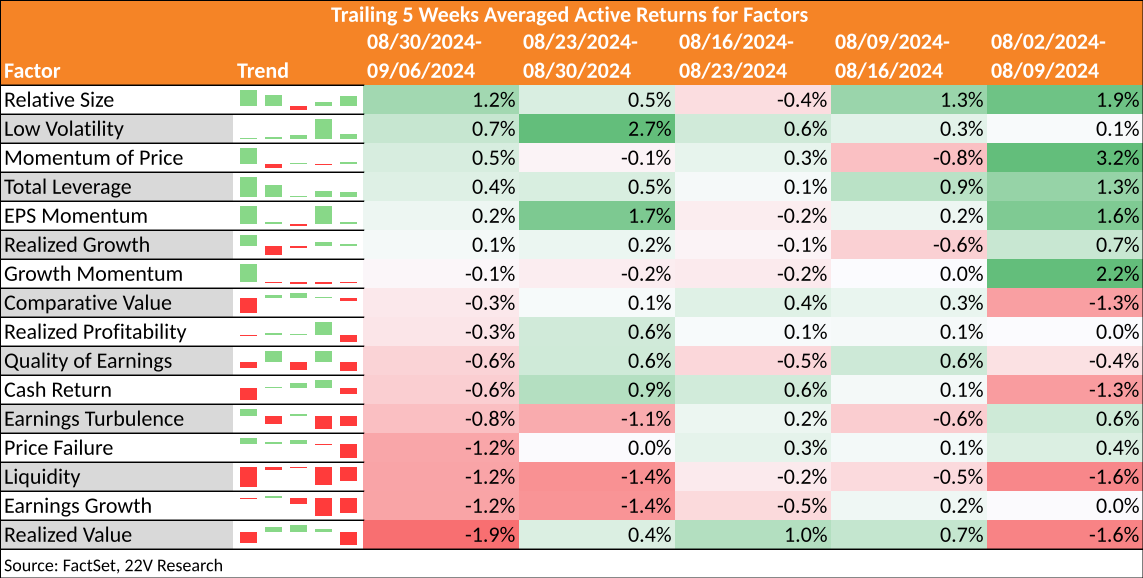
In the near term, although major indexes have recovered some from the trough following the huge miss in June’s non-farm payroll data, our regime model indicates the market internals have remained bearish (Broad Sell-off and Risk Averse) since then. Risk-off factors like Low Volatility have delivered positive active returns for each of the past five weeks. Meanwhile, more defensive-style factors such as Size and Profitability have shown positive returns during this periods.
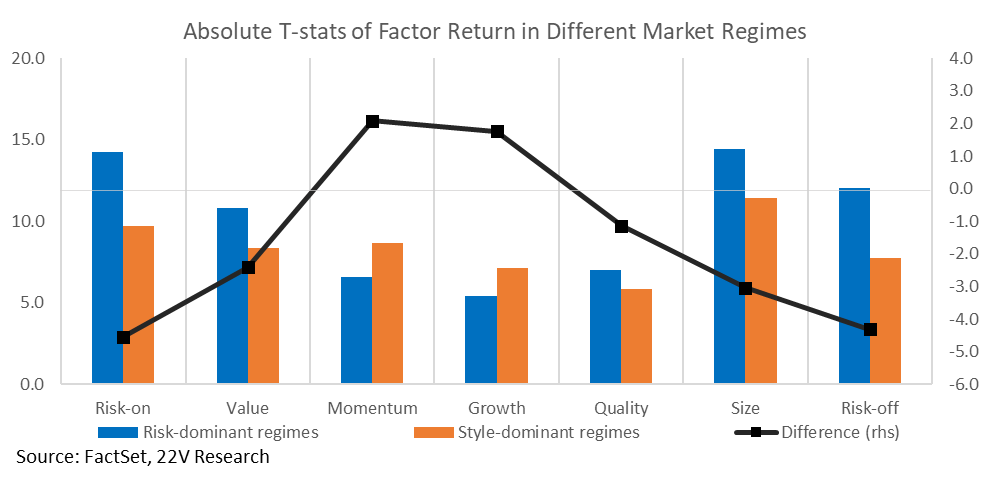
When the market stays in the risk-dominant regimes, stock returns are mainly driven by their exposures to risk factors (such as Earnings Turbulence, Low Volatility, and Liquidity), while sensitivities of fundamental factors are less significant. Conversely, within style-dominant regimes, investors are more focused on companies’ fundamental characteristics, and this leads to more pronounced returns from fundamental/style factors and a less extreme response to risk factors.
The implications for risk managers are: 1) more carefully hedge portfolios’ exposure to general risk factors (market beta, interest rates, FX, commodities, etc.); and 2) adjusting their expectations to the style/fundamental factors that usually worked well before COVID.
In addition to understanding the market’s overall risk appetite from a risk management perspective, a more advanced application of the market regime model is in alpha generation. By using factors’ conditional performance derived from the market regime model, we can effectively map the implied macroeconomic path and corresponding market dynamics to the strategies that are most likely to outperform under those scenarios. We further demonstrate this idea with a simple use case below.
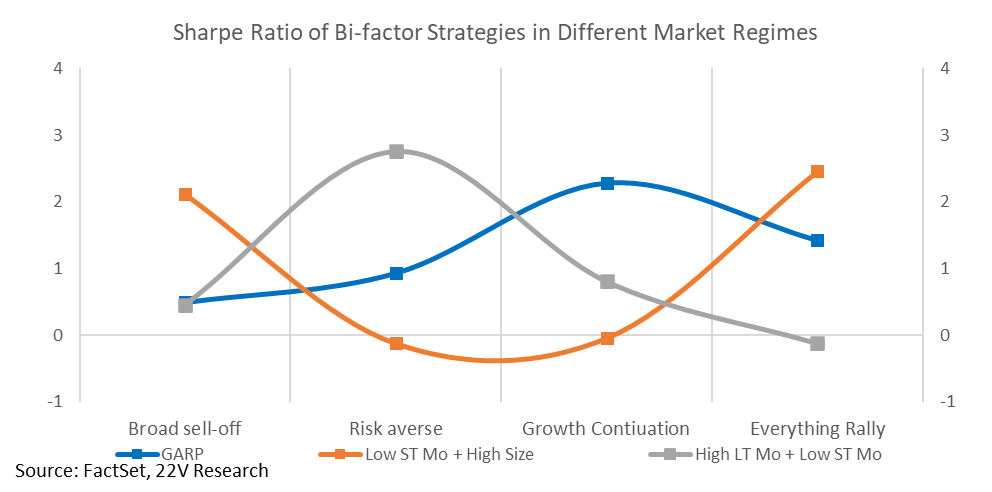
If an investor expects risk-dominant regimes to persist due to macro uncertainty through the rate-cut cycle, they should be long Size and Price Failure at the same time (High Size + Low Short-Term Momentum), as Price Failure performs well in both risk-on and risk-off scenarios, and Size should amplify this performance.
If an investor anticipates style-dominant regimes will return as the economy normalizes and external risks fade, their portfolio strategy will be more dependent on the micro view. 1) In an orderly normalization where both established and small companies can grow at a more balanced pace, GARP (Growth at a Reasonable Price) is the preferred strategy. 2) In a mild slowdown with downside risk overhang, buying Momentum at its dip (High Long-Term Momentum + Low Short-Term Momentum) might be a better choice.

