Summary: The 22V broader macro call remains 3-4 cuts with 2-2.5% Real GDP growth. That call was reinforced last week by data broadly consistent with an extended economic cycle. The services ISM showed expansion, but prices paid and employment readings moved down MoM. Headline Payrolls were firm, but numbers from the past two months were revised down (those numbers had been unusually strong) and wage growth was a bit weaker than expected. The upside inflation tail risk was reduced.
Bottom Line: If our economic framework, as described above, remains intact an extension of the yield curve steepener witnessed after Friday’s payroll report, and which is consistent with an extension of the economic Cycle, should be expected over the course of 2024. Higher odds that the economic Cycle will extend favors risk-on factors internally. Like Earnings Risk, Lower Quality, Value, and Deeper Cyclicals. That leadership would come at the expense of high quality and low vol factors. Our favorite factor is GARP, and we like to being short the S&P 100 (equally weighted) against that. Can send the baskets if interested.
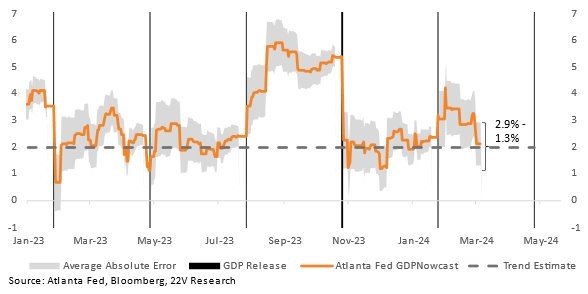
Tactically: We will continue to press the risk-on internal market rotation call into and through CPI with an emphasis on Value and Energy catching up on a relative basis. The payroll report was an important data point that leans against hawkish narratives. As Peter Williams pointed out, given the payroll report, 0.3m/m (i.e. including a low 0.4 as it prints on BBG) might not kill May hike odds on its own. A bit on the hotter side would lead toward June. The Atlanta Fed GDP Nowcast (HERE) printing in the mid-2% range for 1Q24 also reduces concerns over strong economic growth leading to core inflation remaining at too high of a level. Economic growth sustainably above the 3% range combined with a Fed economic forecast that moves closer to 2.75% would lead to much tighter financial conditions risk. Tighter FCI = Companies dependent on a longer economic cycle underperforming.
The point being, an accumulation of hotter than expected CPI data points are needed, specifically driven by Powell’s preferred Core Services Ex Housing, before markets start pricing in much higher odds of zero cuts. Or something that would lead to tighter financial conditions. The USD should be range bound, with slight weakening bias, and 10 year UST yields should be range bound from here in our forecast, but the downside skew has increased. We don’t think there is much risk of a well below 4% 10yr yields in our 2-2.5% GDP growth and 3-4 cut outlook, but there could be sharp downside moves in the 10yr on weaker data points that ultimately reverse.
Side Note on Financial Conditions – We got asked about this many times in meetings last week – don’t focus on Bitcoin And the Fed potentially reacting to the move: The Fed’s measure of financial conditions has eased significantly from the October tights, but the current LEVEL still implies a SLIGHT drag on economy 1yr forward (about 20bp). If the Fed’s measure of financial conditions is basically neutral, but core CPI is slowing and the labor market is slowly loosening, DO NOT expect the Fed to worry about Bitcoin, riskier stocks, what is going on in gold, etc.,
The tightening bias is gone, and inflation is much less of a risk (still a risk, just much less so. Hence the tightening bias that is gone). If core services ex housing remains too high for the Fed and the implication is that Core PCE will not move below 2.7%ish in 2024, then financial conditions would need to tighten more. But wait for it to become clear that core PCE won’t move below 2.75% before shorting riskier assets. Trying to play the tighter financial trade when core PCE is moving toward the Fed’s 2.4% estimate for 2024 is unlikely to work.
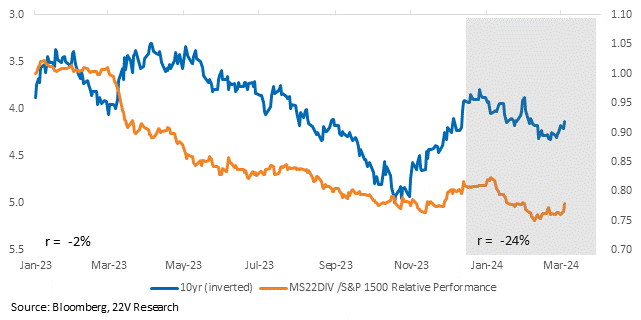
High yielding Defensives stocks and the 22V sustainable dividend basket (MS22DIV Index) is an interesting relative long as the 10yr consolidates. And as noted, the skew in rates is increasingly to the downside if investors get comfortable that 1) economic growth is slowing, and 2) CPI was mostly driven by seasonality in January. Point 1 is happening. We will see on point 2 on 3/12. FYI on the 10yr rates skew. The market can increasingly price the risk of 3 or 4 cuts turning into 6-8 cuts if the economy weakens too much. Even if that sharp weakening never happens. That skew trade becomes more relevant when the economy is growing at 2% ish and not 3%+.
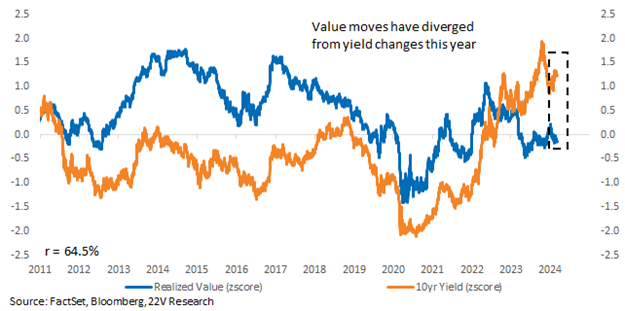
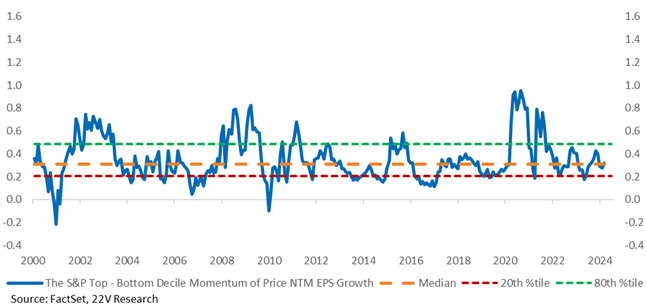
Momentum Reversal: The current NTM PE spread between the High and Low Price Momentum basket is in the 91st %tile. There is a 12.6x point NTM PE spread between the two. At the same time, NTM EPS growth expectations are at roughly their median level. In other periods of significant Price Momentum outperformance, investors were forecasting stronger EPS growth for high Price Mo vs. Low Price Mo stocks. That is not the case today. Theoretically, this mismatch makes high Mo upside less exciting. Also, Momentum’s performance has FAR OUTPACED its sensitivity to 10yr yields. Value has SIGNIFICANTLY unperformed what would be expected given its sensitivity to 10yr yields. Expect Value to catch up vs Momentum as investors price in higher odds of a longer economic Cycle.
Charts and commentary below…
Indicators: The Fed’s measure of financial conditions is basically neutral for the economy going forward, but core CPI is slowing, and the labor market is slowly loosening. DO NOT expect the Fed to worry about Bitcoin, riskier stocks, what is going on in gold, etc., in that backdrop. If core services ex housing remains too high for the Fed and the implication is that Core PCE will not move below 2.7%ish in 2024, then financial conditions would need to tighten more. But wait for it to become clear that core PCE won’t move below 2.75% ish before shorting riskier assets.
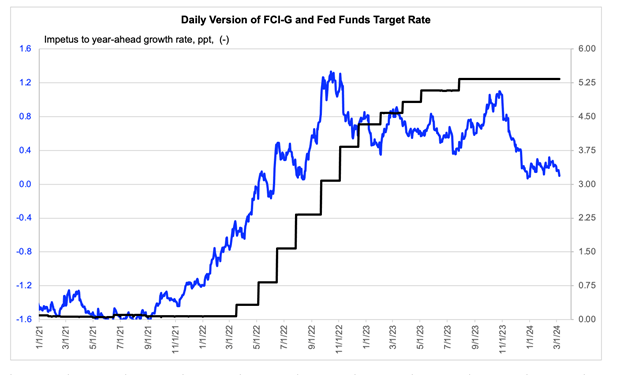
Source: Fed, 22V Research
UST yields seem to be marking to market vs. the current 2% economic growth estimate and incorporating SOME risk that 2%ish turns into 1.3%ish (considering the error bands of the current Nowcast estimate). Again, payroll and CPI will be the major swing factors for UST yields, but if the Atlanta FedGDPNowcast remains close to 2%, there is less upside risk for 10yr yields and the USD.
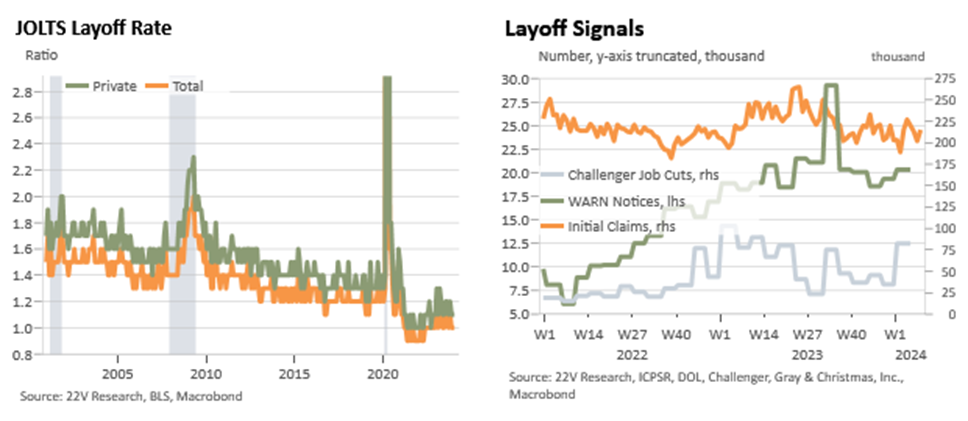
As Peter mentioned in a report (HERE), layoffs are a bigger deal in headlines than in macro data. The JOLTS data, WARN notices, Challenger data, and jobless claims all point to a continued very low layoff rate which seems below its cyclical peak (so far) in 1H23.
The 10yr is still up +30bps YTD. As we framed out last week (HERE), that would benefit our Sustainable Dividend Growth swap. This basket is cash-return focused, which will have a more competitive yield with a lower 10yr. It’s made up of the S&P stocks whose current dividend yield, dividend payout ratio, and recent dividend growth suggests they can maintain or raise dividends.
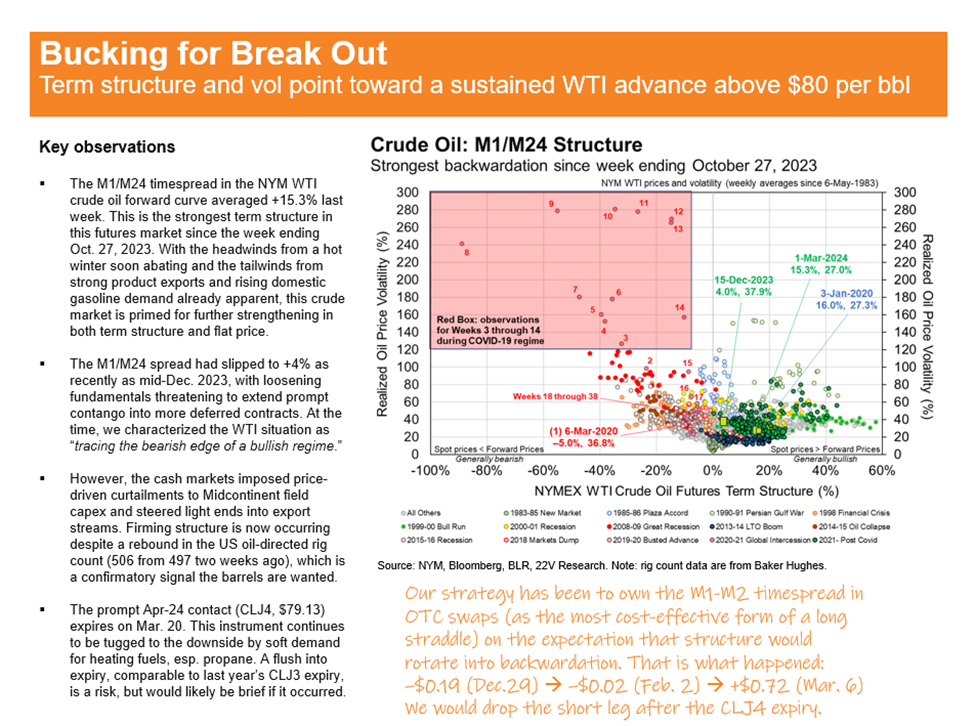
ENERGY AGAIN: Colin Fenton has a bullish outlook on oil, based on the term structure (detailed in his chart below), the outlook for hot and stormy summer weather, and oil product prices. His note yesterday explains the microeconomics of the product prices (HERE).
Source: 22V Research
This increases our conviction that Energy can catch up relative to other Cyclicals.
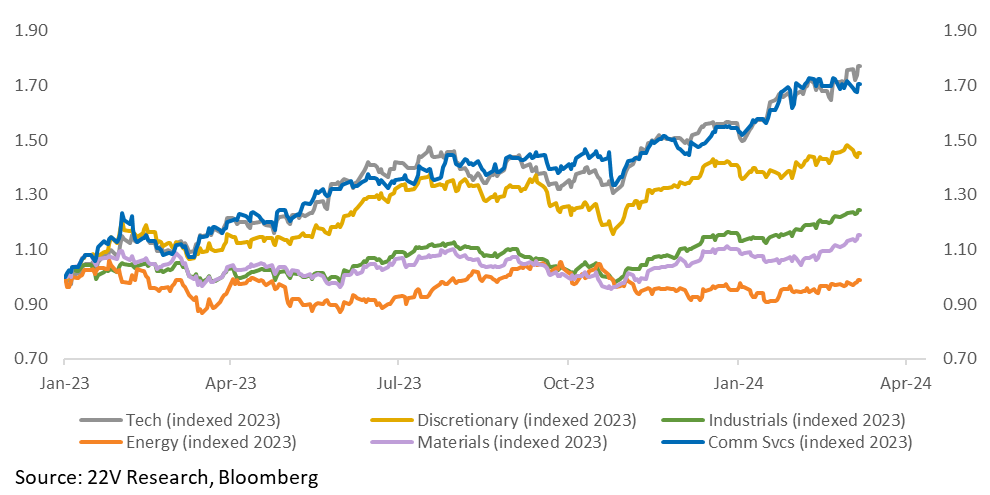
How Extended is Momentum: The Momentum factor started to come under some pressure late last week and accelerated to the downside. If the Price Momentum factor comes under pressure, it is bad news for Size, Growth, and Quality. Value outperformed and given the underperformance of Value to start the year, we suggested a catch up in the Value factor and Energy Sector last Friday (HERE).
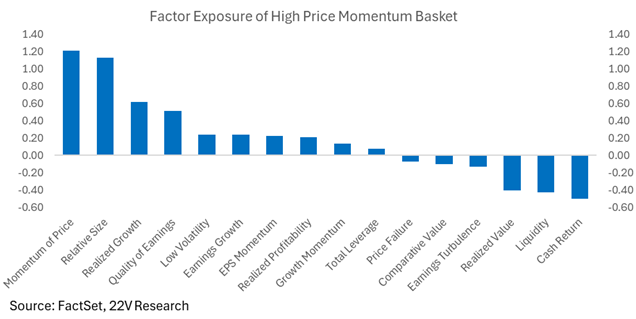
Timing a Momentum turn is extremely difficult, but the current NTM PE spread between the High and Low Price Momentum basket is in the 91st %tile since 2000. It is a 12.6x point NTM PE spread between the two…
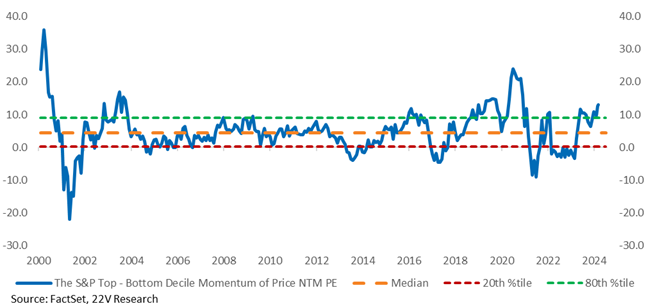
…at the same time, the NTM EPS growth expectations are around their median level. In other periods of significant Price Momentum outperformance, like today, the EPS spread between High and Low Price Momentum stocks was wider. I.e., investors forecasting much stronger EPS growth for the high Price Momentum basket. That is not the case today. Theoretically, this mismatch makes the upside potential less exciting. That being said, from a risk management perspective, another +10% gain could be realized if the NTM PE expands to its 95%tile, i.e., 14.0x. We are not saying that will happen, just trying to give you some context.
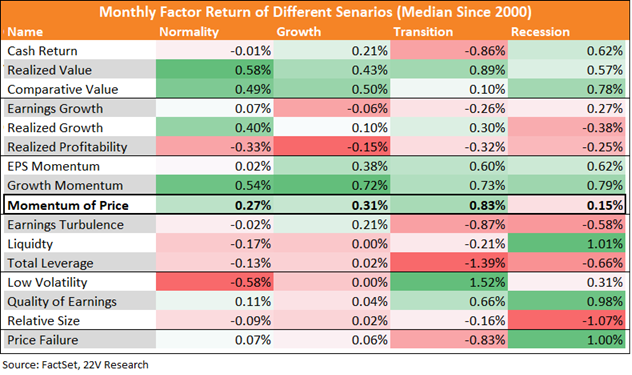
Generally, Momentum factors have worked in the type of economic regime we are in now. The current regime being a “growthier” portion of a normal economic expansion. Being short momentum likely doesn’t make sense if the economy remains within the current Normal/Growth macro regime. Value tends to do well in the current economic regime as well. Again, we expect some catch up in Value.
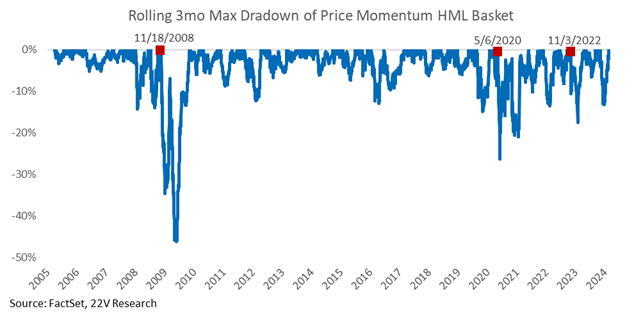
What has Led to Momentum Corrections: Unfortunately, there has not been a consistent theme or reason for Momentum to correct. The correction areas we highlight below have been associated with a significant easing and tightening of financial conditions. It appears a change in FCI matters more than the direction. To shoehorn a potential narrative into why we might see a reversal in momentum now, if 10yr yields stabilize and grind lower, as economic growth remains around 2%-2.5% ish, some broadening out of returns should be expected. Investors would have less reason to hide in Size, Quality and Growth. In short, Companies that have “financing risk” or much higher fixed costs would benefit from 10yr yields having less upside risk. That is what happened in December 2023 when Momentum performance faded.
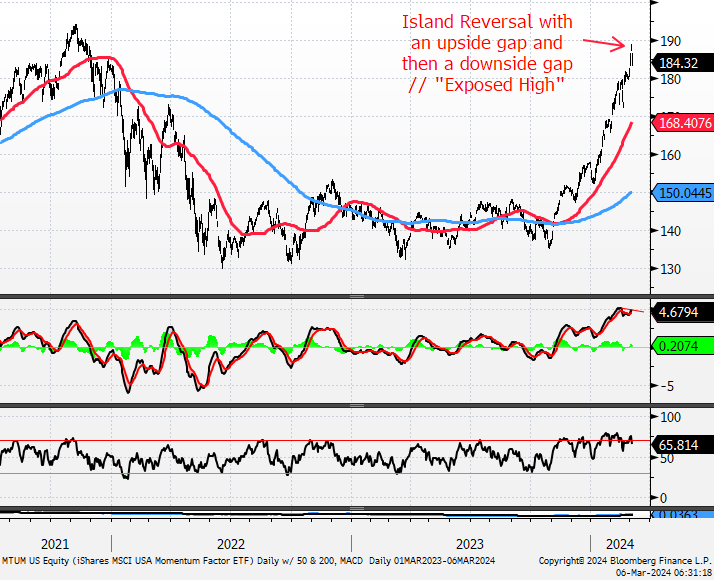
All the above is consistent with what John noted last week, “MTUM – Make no mistake, the Technical Score for MTUM is still a Strong 4; however, I think it’s a decent idea to take a shot at it on the short-side here because (a) it’s extended vs. its 200-Day MA, (b) is into resistance from the 2021 high, (c) just recorded its greatest every daily overbought reading via the MACD in the middle panel, (d) there is a tiny negative momentum divergence with price and the MACD Iin the middle panel as momentum peaked in mid-February, and (e) MTUM gapped up on Mar 4 and gapped down on Mar 5 creating an Island Reversal // “Exposed High”.
Buy stop is just above the intra-day high of two days ago (there has to be a stop) and the downside target is 170.”
FYI – A few things from Quant that fit with what we outline above. When applying rolling 4 years data, Value remains the most sensitive factor across 10yr yields, Yield curves and short rates. Size and Momentum tend to have much lower beta with yields. It is interesting how much Value’s sensitivity to yields has lagged and how much more positive Momentum’s has been. That COULD speak to concerns over Financing risk and asset heavy industries in general struggling in a higher interest rate environment.
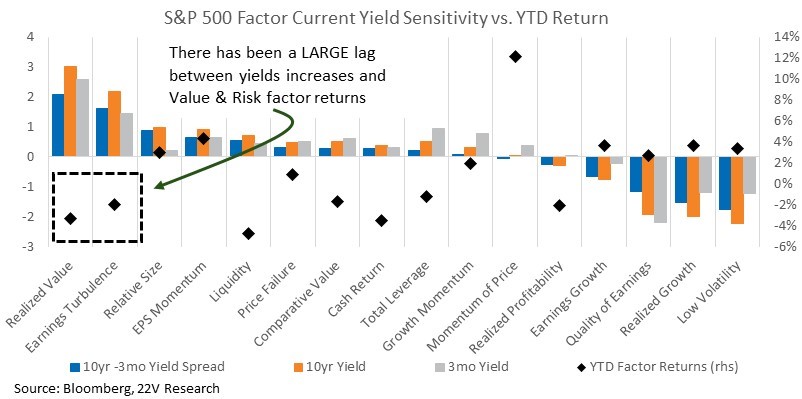
To focus on Value specifically, the divergence between Value and yields this year, along with its divergence relative to PMI reading is unusual (HERE). If it is proven that economic growth continues to grow at a 2-2.5%ish pace with UST yields at current levels, that should be a tailwind to Value factors. Especially given how much they have lagged the macros so far this year.