

Today we are highlighting two potential short-term trades into payroll/CPI data – long our Sustainable Dividend Growth swap, and long a Utilities options strategy. The thesis is 1) consensus has moved to hot data while 2) economic data is still volatile. Extrapolating data is risky, and the potential for weak data this time around is important for risk management.
Details below…
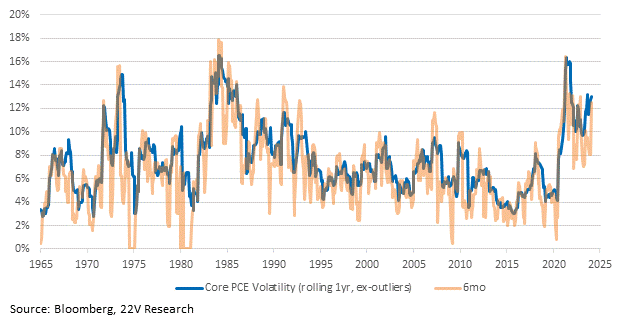
Economic data volatility has been high during the COVID recovery. It’s been high even on a 6mo rolling basis, meaning this isn’t the product of volatility from 2020, 2021, or 2022. The last batch of Payrolls and CPI/PPI were hot, and client sentiment has shifted from thinking weak labor data is imminent to thinking weak labor data is distant. But extrapolation isn’t a best practice when volatility is high. We aren’t going to make the economic case for weak data; our base case is still for strong growth. But for risk management purposes, the volatility of data and current market disconnects are important.
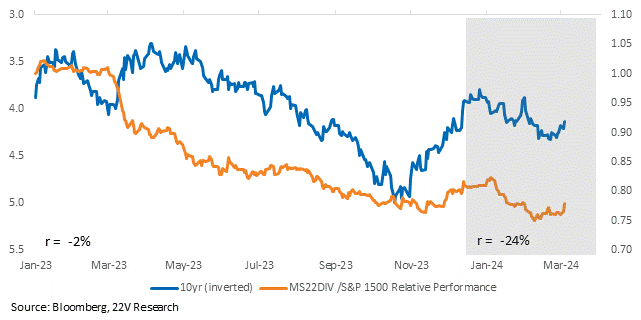
10yr yields are +32bps higher than their trough in late December. They’ve rolled recently (-21bps in 2 weeks), but +32bps YTD still implies downside risk to yields if data cools. If yields continue to fall, our Sustainable Dividend Growth swap (MS22DIV on bbg) is set up for a rally. This basket is a cash-return basket, which will have a more competitive yield with a lower 10yr. It’s made up of the S&P stocks whose current dividend yield, dividend payout ratio, and recent dividend growth suggests they can maintain or raise dividends. Constituents listed at the end of this report.
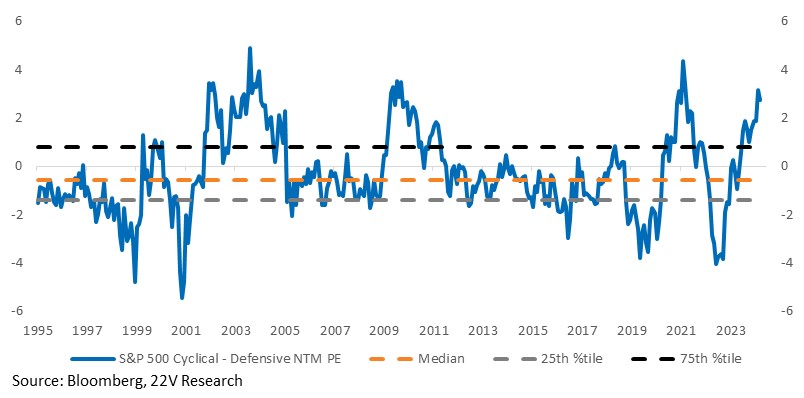
If the upcoming data misses to the downside, Defensives could gap higher too. The NTM PE spread relative to Cyclicals is extreme (in favor of Cyclicals). Utilities in particular are 1) beaten up (technical term) and 2) rate sensitive.
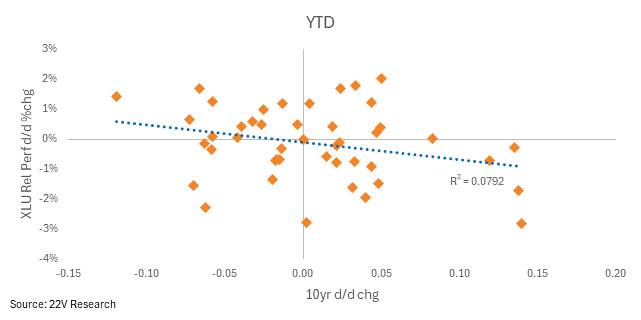
We get that there’s a debate around why 10yr yields move, and that matters. Utilities do great when recession risk increases. But more rate cuts without a recession may be a different story. Keep in mind, Utilities NTM PE is in its 39th percentile. Compared to the rest of the market, it is 17th %tile. Below, we plot out YTD d/d relative returns against 10yr d/d bp changes. This year, Utilities have been going up when 10yr yields have had outlier moves down, and Utilities have been going down when 10yr yields have had outlier moves up. We’re comfortable betting that continues.
Since it’s a bet on volatile data, owning the XLU outright is not our favorite way of playing it. Options are a better fit here. We would target expiration shortly after JOLTS on 3/6, Payrolls/AHE 3/8, CPI 3/12, Retail Sales & PPI 3/14. the 3/15 expiration has a dramatic skew towards the downside, which sets up nicely for buying XLU calls. The 4/19 expiration date (the next date with any liquidity) has a more expensive vol structure for calls. Outright XLU calls are inexpensive and an easy play. For an XLU relative performance play, check out an XLU risk reversal (buy XLU 03/15/23 C64 and sell XLU US 03/15/24 P62) paired with a SPY collar (sell SPY US 03/15/24 C516 Equity and buy SPY US 03/15/24 P499 Equity). The idea is XLU will gain more or drop less than the SPY.


