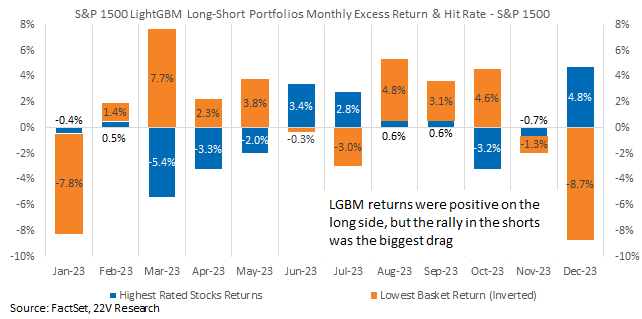
Our machine-learning-based long-short portfolio posted its 8th consecutive annual gain in 2023, returning +4.2% under a dollar neutral construction. The Long side gained 21.8% on the year while our short basket returned 17.5%. The model has posted 21.5% annualized returns with the short side underperforming the S&P 1500 every year and the long side outperforming in all years except 2023. With 7 stocks contributing half the S&P index returns, our non-idio focused strategy could not keep up.
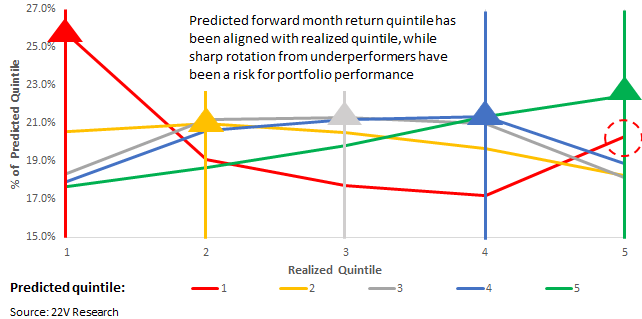
To judge the efficacy of the model, we compared our quintiled rankings with actual monthly quintile returns since inception. The model predictions consistently aligned with actual quintiled returns, especially for the top and bottom quintiles of our rankings. This is confirming that combining macro, fundamental, and sentiment measures in an unsupervised manner is an effective way of parsing broad stock universes into winners and losers.
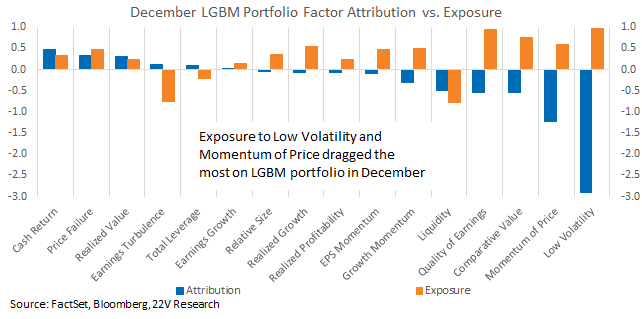
In December, our LGBM longs were positive, but the short side surged higher as investors aggressively rotated into market laggards. Factor allocations were a drag on the long-short portfolio in December, especially Low Volatility and Momentum of Price. The portfolio was positively exposed to risk-off factors and unprepared for the strong risk-on rally. Positive exposure to Value factors contributed the most to its return over the past month.
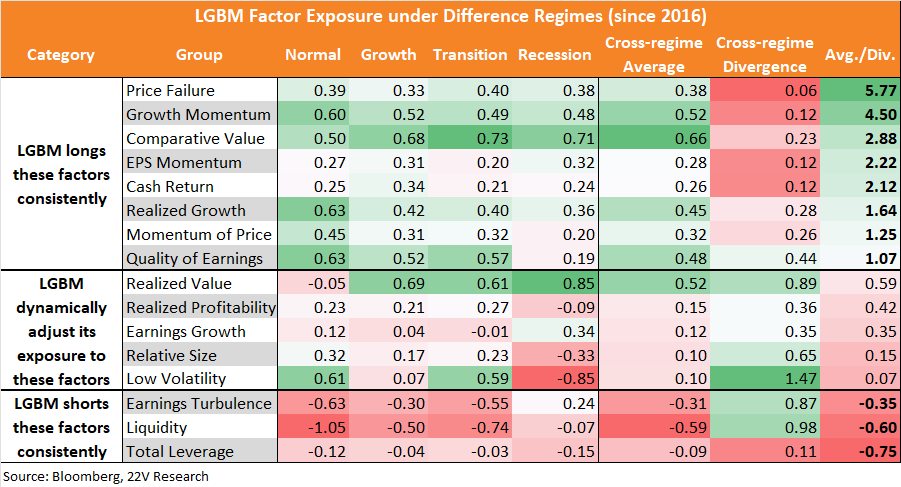
In the table below we lay out the model factor allocations under different macro regimes. Across regimes, the LGBM portfolio has consistently recommended positive exposure to fundamental factors and Price Failure, which are large contributors to long-term S&P 1500 returns based on our return sensitivity analysis. While the consistent underweighted factors such as Earnings Turbulence, Liquidity, and Total Leverage had low sensitives.

In the current macro backdrop, which is a mix of Normal and Growth regimes, the model dynamically allocates to fundamental factors tied to historical trends (realized growth and value, size). The more growth accelerates, the less attractive risk-off factors will become.
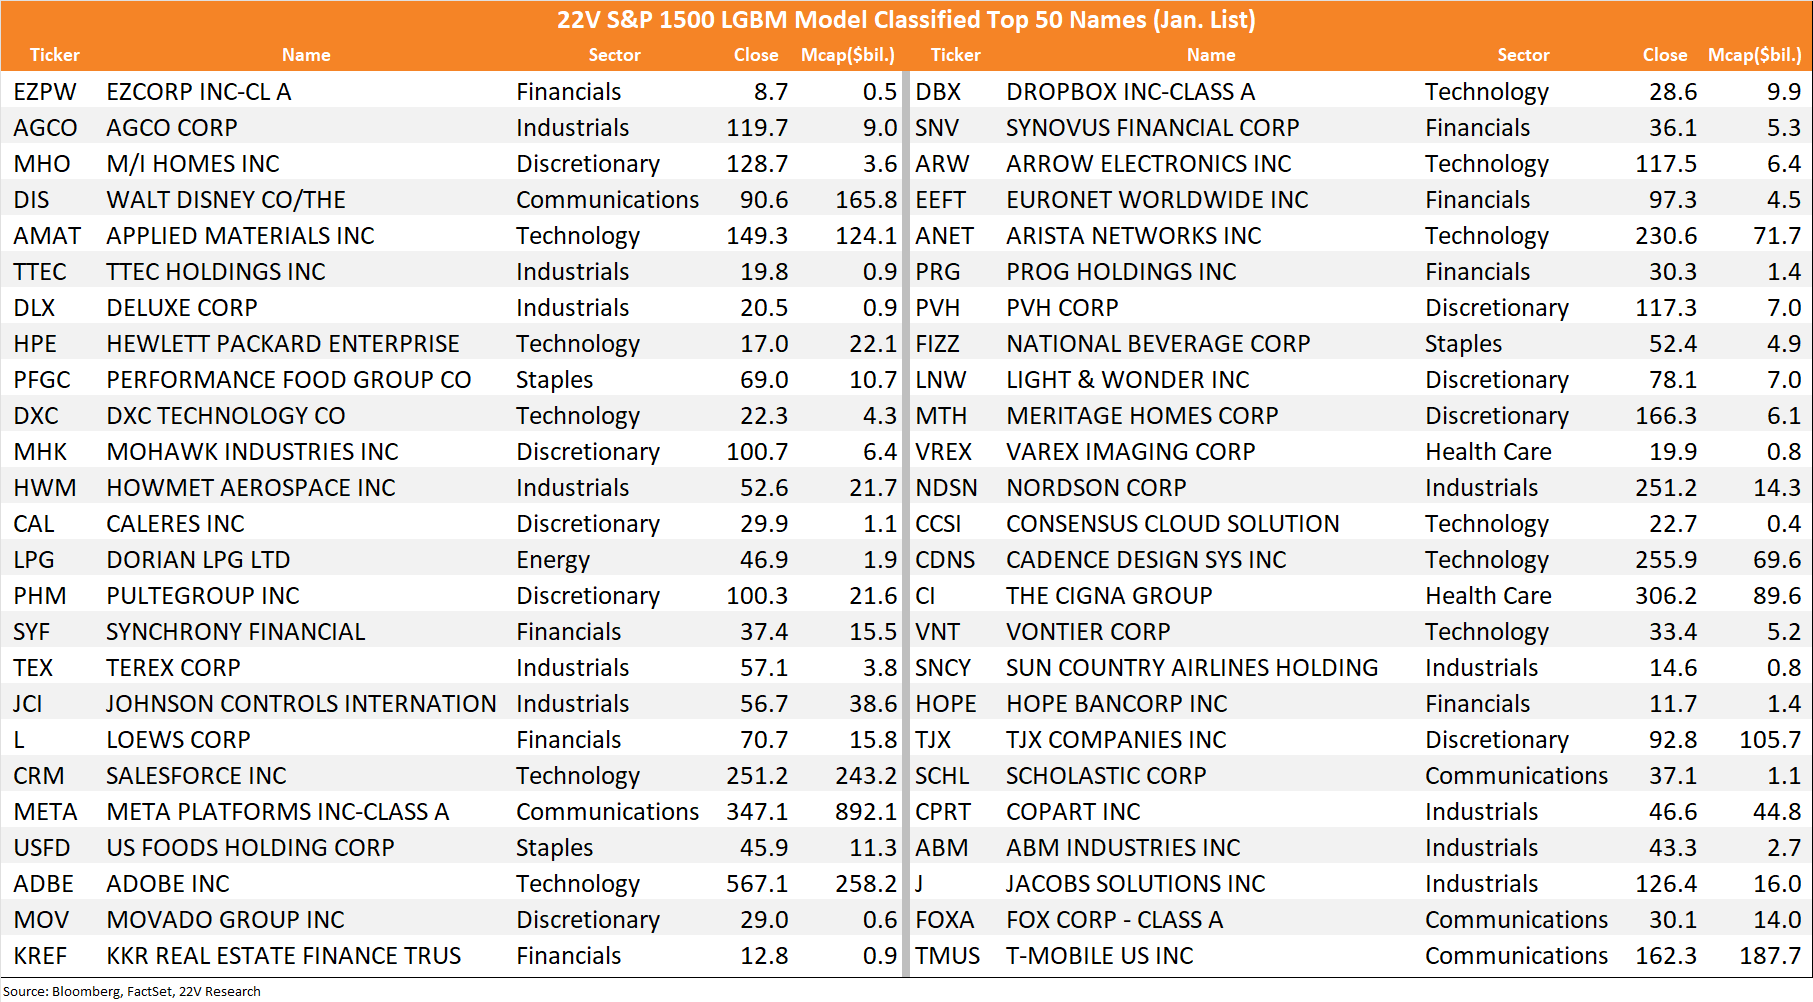
At the end of the report, we list the S&P 1500 names ranking top 50 based on the model selection for January. A full list of S&P 1500 ranking is available by emailing us.
LGBM Portfolio Preferences Under the Current Regime: As macro uncertainty dropped and the macro backdrop moved away firmly away from Recession, our machine learning LGBM portfolio posted another annual gain. The model was up 4.2% confirming its usefulness in generating dollar neutral returns using macro, fundamental, and sentiment inputs. The portfolio is designed to reduce idio risk to near zero, so the longs failed to keep up with a market where 50% of returns were tied to 7 stocks. Our longs gained 21.8% in 2023 and outperformed the S&P 1500 during the December rally. The short side was a drag though, outperforming the market and our longs. The bottom line is that the model was not positioned for the extreme rotation into market laggards.
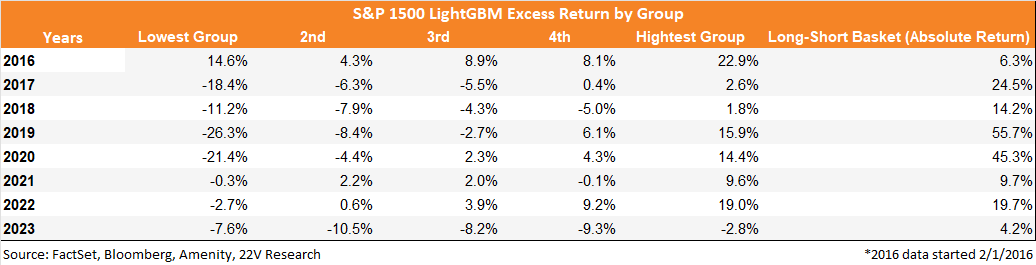
During the model’s out-of-sample period, our LGBM portfolio has posted 8 years of positive l-s returns with an annualized gain of 21.5%. At a high level, that confirms the effectiveness of the model’s long-run stock picking. The bottom quintile portfolio underperformed the S&P 1500 consistently and the top quintile portfolio outperformed in 7 of the last 8 years, with 2023 the exception.
Taking a more granular look, we compared the model’s predicted return quintiles with their actual monthly quintile return ranking over the long term. The model has successfully ranked stocks, accurately classifying more than 25% of top performing stocks and ~22% of the worst performers. Less than 18% of the bottom ranked stocks end up being in the top quintile of performers. One risk comes from reversals of highly rated stocks. This is a consistent problem with pure quantitate models and something we will be working to minimize throughout 2024.
December Returns and January Allocation: Factor exposure was a large drag on the LGBM portfolio in December, reducing returns by -4.6%. The model went into December overweight risk-off factors, which significantly underperformed as investors continued to price in the Fed pivot/soft landing scenario. Contributing to returns was the model’s over allocation to Value, which was the largest contributor to returns in December.
As our factor sensitivity analysis (HERE) shows fundamental factors and Price Failure have been the largest contributors to S&P 1500 returns over the long term. LGBM portfolio is consistently long these factors regardless of the macro regimes. Risk factors, on the other hand, are consistently shorted. That is also consistent with long-term sensitivity analysis, which shows risk factors adding roughly no contribution to long-term index performance. Pure style factors, Size, and Earnings Growth are the factors that see the biggest allocation shifts between macro regimes. Low Vol also falls into that group, which makes sense given its aggressive negative returns during Recession periods and high returns during Transitions and Normal periods.
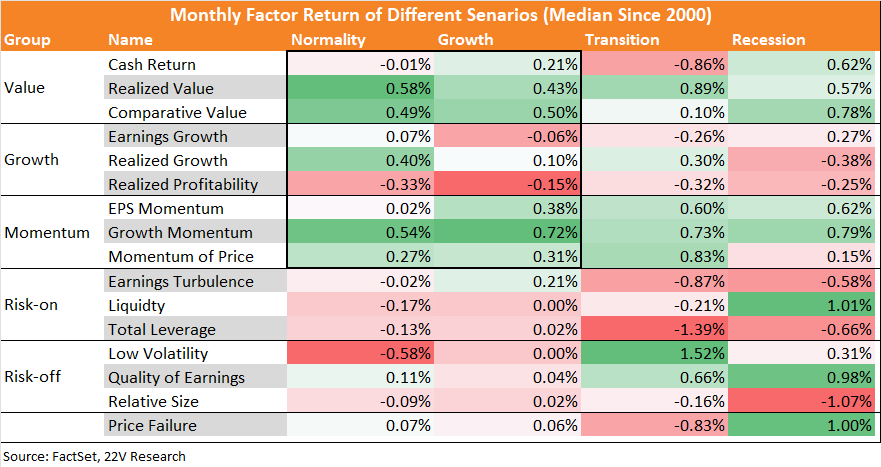
In Normal and Growth backdrops, which is where we are today (HERE), Value and Momentum factors tend to perform best. Momentum is unusually tied to risk-off today, which is a near-term headwind for the factor. The LGBM enters 2024 still overweight risk-off factors, which has served it well recently, but will be a drag if the better than forecast reporting season we expect plays out (HERE). As the Normal/Growth regime deepens, the model should shift away from risk-off exposures.
Below, we list the top 50 S&P 1500 according to the model. A full list of S&P 1500 ranking is available by emailing us.