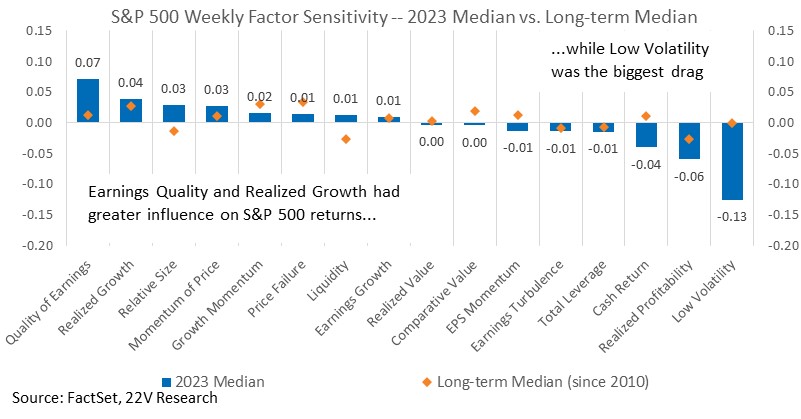
At a high level, the S&P rallied 23% in 2023 as recession risk faded, EPS growth beat expectations, and slowing inflation allowed financial conditions to ease without pushback from the Fed. For a more granular understanding, we look at S&P factor sensitivity. In 2023, the S&P was most positively influenced by Quality, Growth, and Size. The index was most negatively sensitive to Low Vol, Realized Profitability, and Cash Return. In other words, when the market was rising, Quality, Growth, and Size were drivers. Low Vol gained when the market was weak.

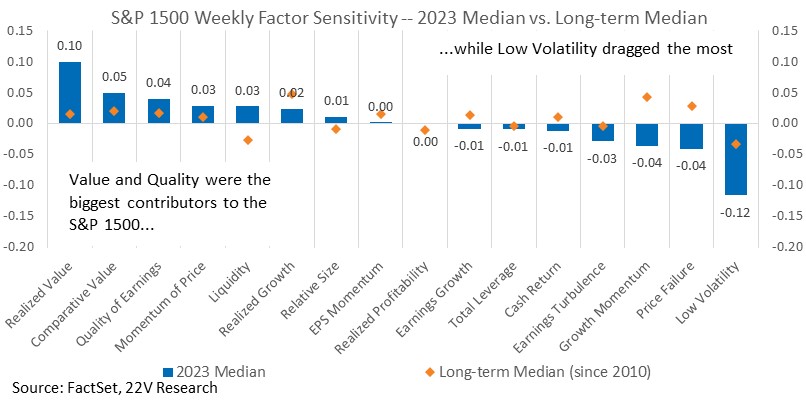
The broader index was also negatively associated with Low Vol, but noticeably more sensitive to Value factors. There are a few conclusions to draw from this analysis. First, fundamental factors were consistently positive contributors to both S&P 500 and 1500 returns. Second, Risk factors were a drag on returns for both indices. The other important point is that when smaller caps were working, Value was a differentiating factor. Looking forward, increasing soft landing odds suggest 1) fundamental factors will continue to drive stocks, and 2) when screening for smaller caps names, Value + Quality is an attractive starting point.
Economic activity continues to slow, financial conditions are unlikely to ease meaningfully from here, and yield curves are range bound until later in 1Q. A clearer path for real growth and a steepening of curves could set up a Value rotation, but the GARP approach continues to make sense, particularly within the S&P 500, given the policy constraints on growth.
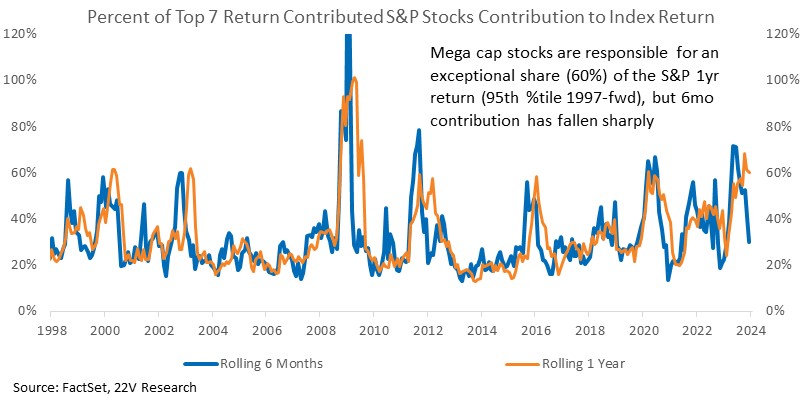
Finding Value, Growth, or Quality names has become more difficult over the course of 2023 as the index became heavily exposed to Size and Mo. Mega caps contributed 60% of the S&P’s return last year, but most of that contribution was in the first half of the year. Size contributions have been fading (more on that below) as declining macro uncertainty makes the defensive growth characteristics of the mega caps less attractive. The bottom line is investors looking for Quality, Value, and Growth exposure should focus on specific industries and small caps rather than the S&P.
S&P Return Drivers in 2023 and Early 2024 Expectations: 2023 left the S&P 500 up 24% and the S&P 1500 just slightly behind at +23%. At a high level, stocks rallied because recession risk faded, the feared crash in EPS never materialized, and slowing inflation allowed financial conditions to ease without pushback from the Fed. For a more granular understanding, we look at S&P factor sensitivity, a measure of how sensitive the S&P was to factor movements. In 2023, the S&P was most positively influenced by Quality, Growth, and Size. The index was most negatively sensitive to Low Vol, Realized Profitability, and Cash Return. In other words, when the market was rising, Quality, Growth, and Size were drivers. Low Vol gained when the market was weak.
The broader index was also negatively associated with Low Vol, but noticeably more sensitive to Value factors. There are a few conclusions to draw from this analysis. First, fundamental factors were consistently positive contributors to both S&P 500 and 1500 returns. Second, Risk factors were a drag on returns for both indices. The other important point is that when smaller caps were working, Value was a differentiating factor. Looking forward, increasing soft landing odds suggest 1) fundamental factors will continue to drive stocks, and 2) when screening for smaller caps names, Value + Quality is an attractive starting point.
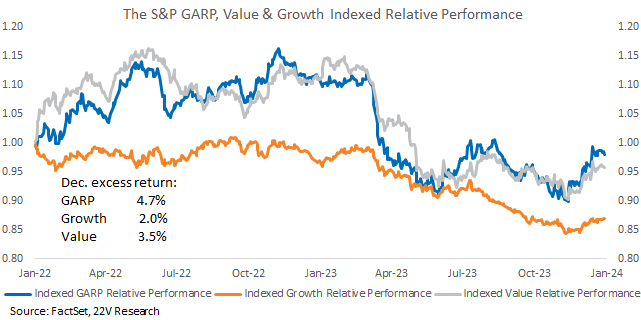
At the S&P 500 level and for now, we continue to favor blending Value and Growth in a GARP approach to screening. Economic activity continues to slow, financial conditions are unlikely to ease meaningfully from here, and yield curves are range bound until later in 1Q. A clearer path for real growth and a steepening of curves could set up a Value rotation, but the GARP approach continues to make sense given the policy constraints on growth.
A style focused market is a headwind for the S&P 500. Finding Value and Quality names has become more difficult over the course of 2023 as the index has become heavily exposed to Size and Mo. Quality exposure of the S&P has increased modestly while Value exposure has decreased. The bottom line is investors looking for Quality, Value, and Growth exposure should focus on specific industries and small caps rather than the S&P.
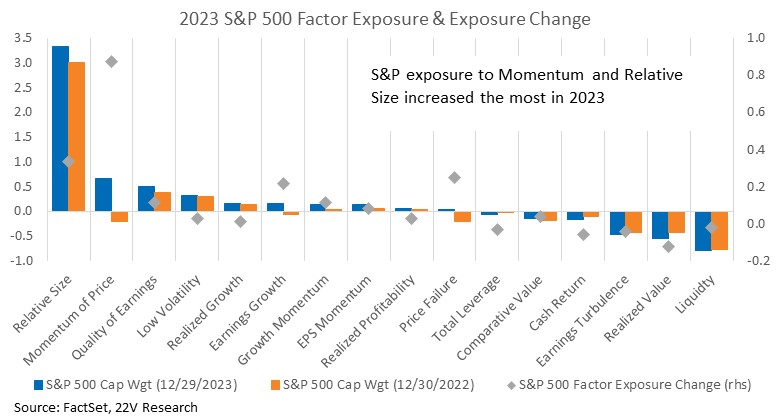
Exposure changes can be explained by the extremely high mega cap return contribution in 2023. Mega caps contributed 60% of the S&P’s return last year, though most of that contribution was in the first half of the year. Size contributions are fading as declining macro uncertainty makes the defensive growth characteristics of the mega caps less attractive. We continue to favor small caps.
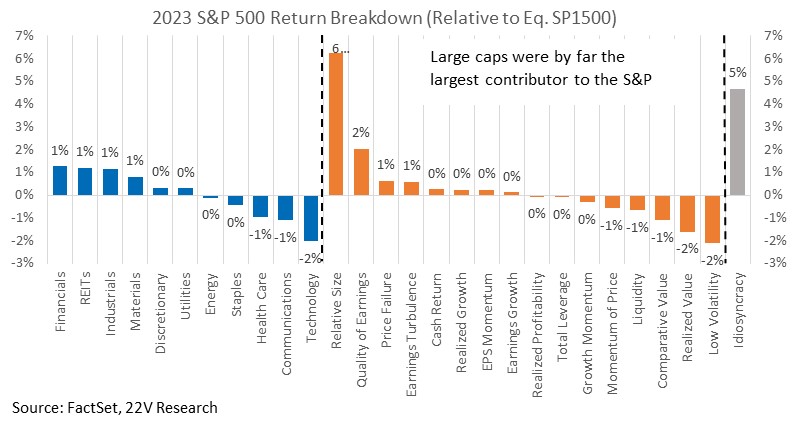
Applying the equal weighted S&P 1500 as the benchmark, S&P 500 excess returns over the past year have been driven by Relative Size and stock specific characteristics. That is roughly aligned with the outperformance of mega caps. Low Volatility and Value were the biggest drags on the index. That is an important point. Value was not an effective screening tool within the S&P, but as the sensitivity analysis above showed, when the average stock was performing well, Value was a positive contributor. When positioning for a further catchup trades Value remains an effective tool. Also important is that Tech/Comms were negative contributors to the S&P’s relative return. Mega caps within those sectors were MAJOR contributors, but many of the smaller caps were a drag. Those remain interesting places to look for catchup trades.
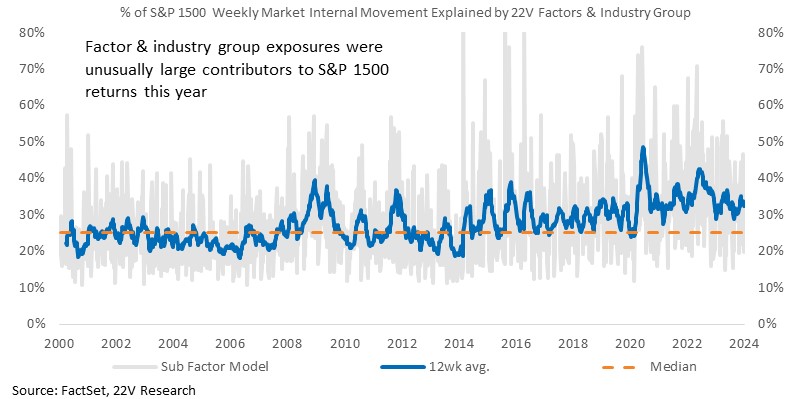
One last point when thinking about screening in early 2024. Over the past year, factor and industry group exposures explained around 33% of S&P 1500 returns, which is much higher than normal. With headline market gains likely more restrained over the next few months/quarters, but macro uncertainty much lower, we expect factor and industry contributions to index returns to remain high.