DAILY STRATEGY: Main Point – Over the last two months investors have shifted to paying up for certainty of cash returns while paring back their willingness to pay for future expected cash returns related to AI investments. At least for now.
As we noted yesterday though, investors are increasingly looking for signals that validate AI demand trends and EPS growth estimates for 2028 and beyond (HERE). Semis, Tech Hardware and Industrials, the industry groups most associated with the AI buildout, have all traded poorly. Global Memory names seem to be discounting a deceleration in earnings beyond 2028, likely related to an expected increase in memory supply (HERE). Other AI levered industry groups are experiencing different versions of the same 2028 and beyond questions (HERE).
The industry groups driving the Cash Return factor (mostly in Financials) don’t have the same 2028 supply related earnings cliff RISKS. Financials have high cash returns today. In contrast, the volatility of the price momentum factor, which has significant AI idio exposure, is near its 96th %tile historically.
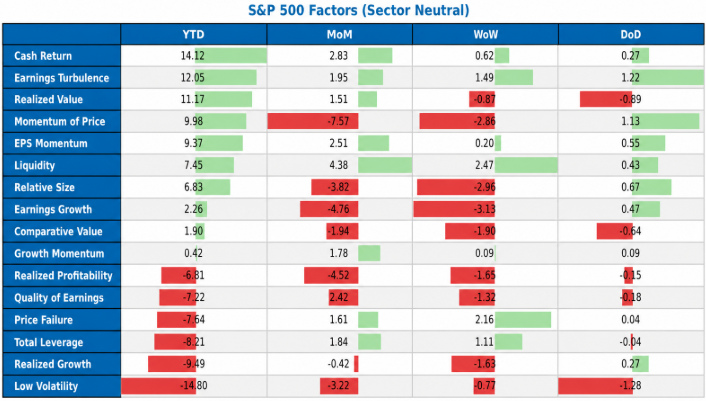
We are not negative on the AI buildout baskets, just identifying the current reality. Price Momentum is now the 4th best performing factor (long/short) YTD. It was the top performer just a few weeks ago. Cash return, Earnings Risk and Realized Value are all outperforming Price Momentum now. The Quant team highlighted the drivers of the cash return factor performance yesterday (HERE). Financials, a sector where 65% of names have cash return yields above 10yr yields, have been the largest contributor to Cash Return gains. Over the last two months investors have shifted to paying up for certainty of cash returns.
In addition to the 2028 and beyond questions above, unusually strong 2Q Earnings did NOT help Price Momentum or the AI buildout names. Semis, Tech Hardware and Industrials, posted excellent 2Q26 headline earnings. Beat rates were 96% for semis, 93% for tech hardware, and 87% for industrials. The strong earnings results were barely enough (or not enough) to drive the names higher, while misses or “just in-line” results got hit unusually hard. Industrials sector performance has been terrible recently (-5% MoM and -3.4% YTD), which is a risk we flagged in a Quant report a number of weeks ago (HERE).
From a macro point of view, a sharp decline in 10yr yields would encourage investors to pay up for future expected earnings related to the AI buildout. Helping the Price Momentum Factors. However, our macro forecast does NOT support much lower 10yr yields. Another dovish inflation and labor market reading in September could encourage lower yields. That might change our macro view. For now, an unemployment rate at 4.1%, nominal GDP at +6% and an expanding deficit should keep 10yr yields in the 4.5%-4.7% range with an upside bias. Idio should be a larger driver of the AI buildout and Price Momentum returns.
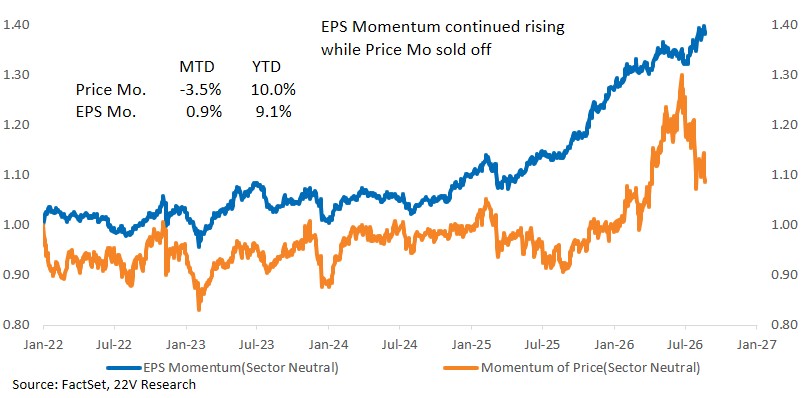
Focus On Earnings Momentum vs AI Buildout or Price Momentum Baskets. We remain long EPS Momentum vs Price Momentum* (+23.8% since 6/21 original call – MS22EVPM Index on bbg). EPS Momentum’s industry exposure has been comparatively stable and more diversified, with Communications, especially Telecom playing a larger role. Since investors are focused on Earnings and Cash returns today, Earnings Momentum should continue to outperform.
*Earnings Momentum: Measures consensus EPS estimate change of over past 8 weeks and 4 weeks, and the difference of estimate EPS and actual EPS. The goal is to measure the trend and changes of estimated EPS.
Price Momentum: The factor is based on stock prices to measure the rolling 1-year trend of stock prices. The score is lagged 20 trading days to avoid conflict with short term period.
Charts…
What investors seem to be paying for from a factor point of view. Cash return is the top performing long short factor and the EPS momentum baskets have benefited more recently. As Price Momentum has faltered.
Source: 22V Research, FactSet
MTD EPS Momentum has continued to outpace Price Momentum. Investors seem to be paying up for high cash return and earnings momentum today.
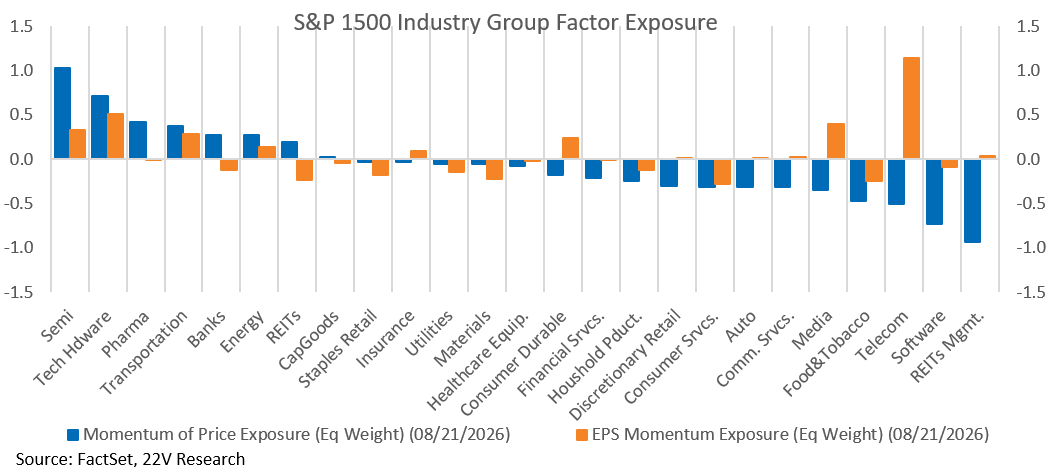
EPS Momentum is more exposed to telecom, media, and consumer durables. Price momentum is more exposed to Semis, Tech Hardware, and Transports.
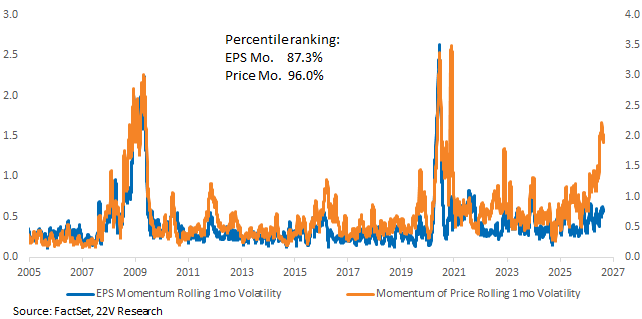
The 1m rolling volatility remains elevated in price momentum relative to its history.
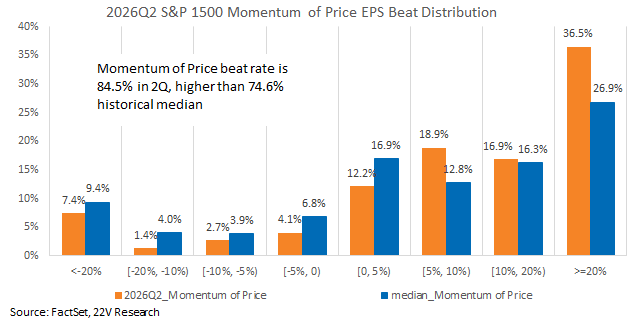
The strong EPS beat rate for the Price Momentum factor in 2Q26 hasn’t helped much.
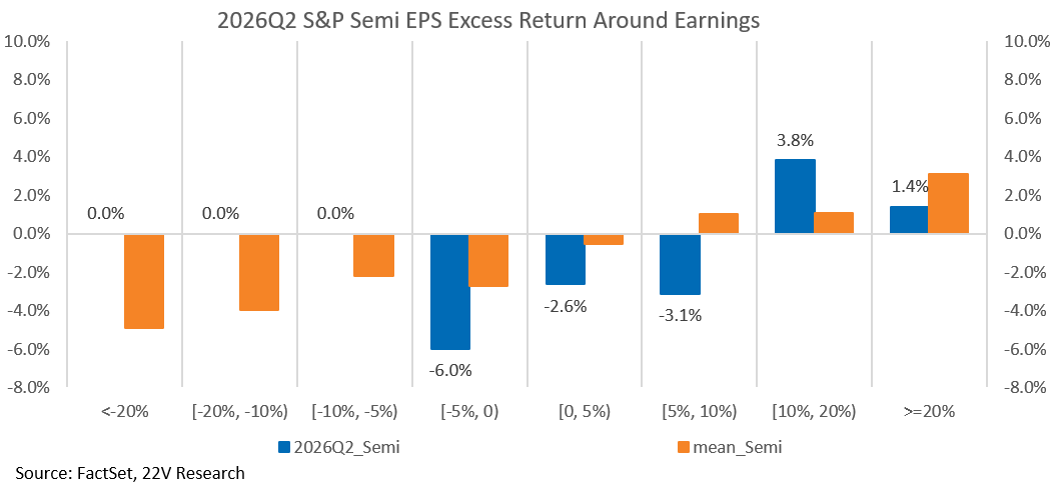
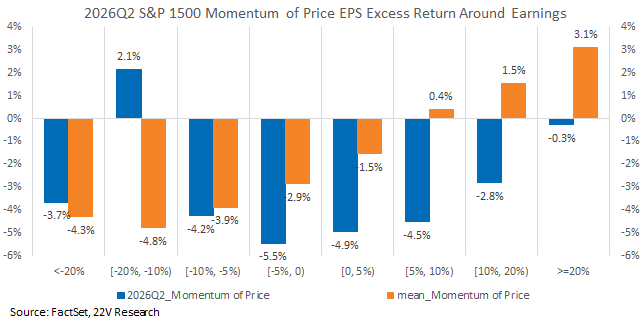
Despite unusually high beat rates for the price momentum factor, the forward returns were dismal.
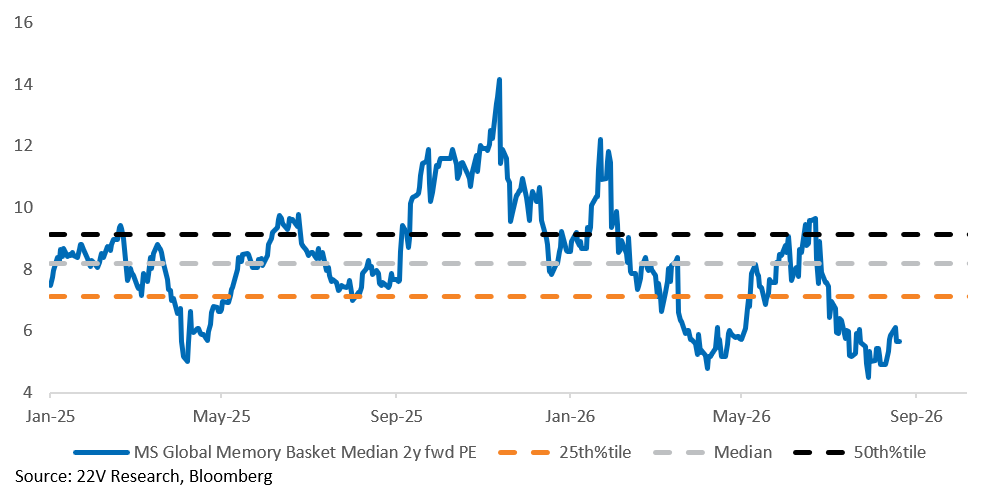
The two-year forward PE spread of the global memory basket has moved below its 25th %tile.
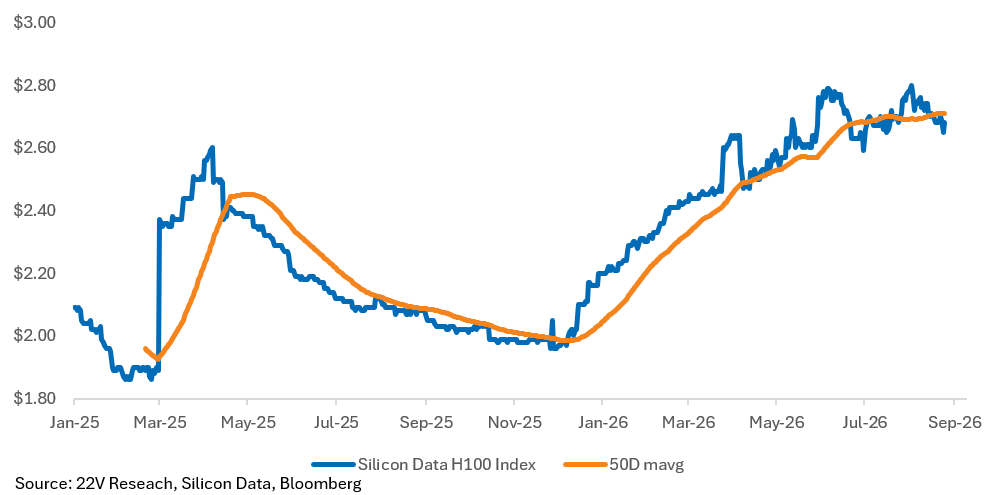
The H100 GPU rental index has started to roll over. These indexes (there is more than one. Below is the Silicon Data H100 index) are used as a proxy for AI-compute supply/demand balance. We will get pushback on using this chart. i.e. more supply at very high rental rate levels is a very good thing for the AI buildout names. We only point out as many investors follow it now and the rollover is likely influencing sentiment.
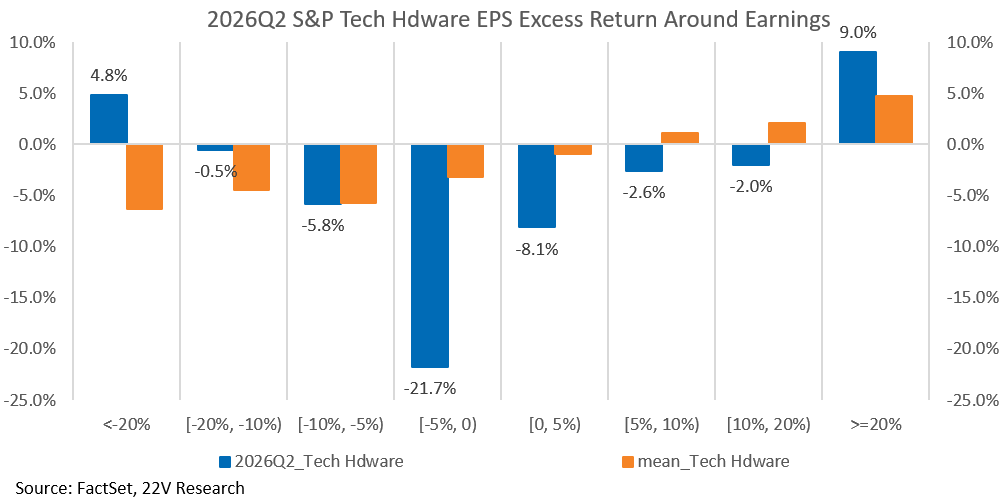
Tech Hardware delivered a strong 2Q26 reporting season, with both EPS and sales beat rates running more than 20 points above their historical medians. However, that result still fell short. Only the most extreme beats earned positive post-earnings excess returns, while in-line EPS beats were severely punished
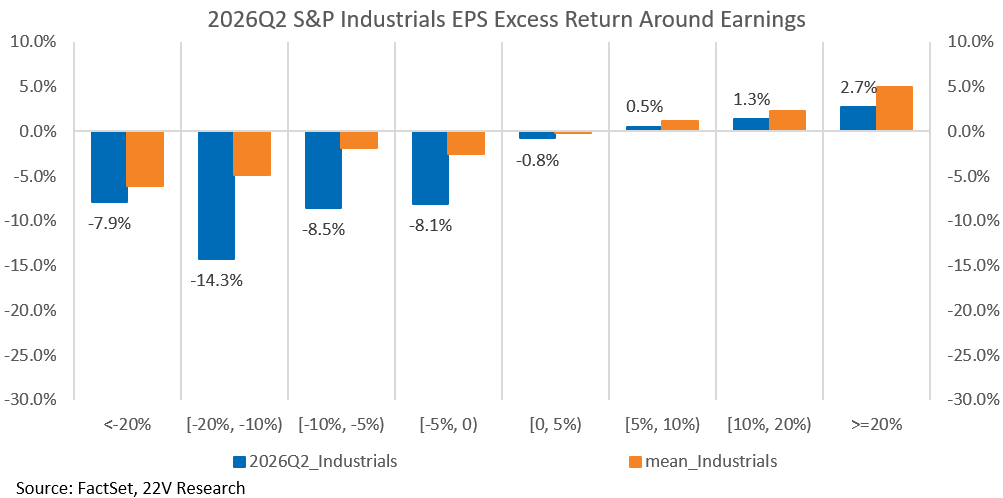
Within the S&P 1500, Industrials posted an 86.7% EPS beat rate in 2Q26, the third best of the GICS sectors. The beat rate is much better than its historical median, with the spread the second highest of all sectors. On both a relative and an absolute basis, Industrials delivered good earnings in 2Q26.Every tranche of EPS misses posted underperformance of 8% or worse, reflecting an unusually strict bar being applied to the sector. In addition, beat names generated a lower excess return than usual as well.
Same problem for semis…96% beat. Skew was lower returns.