Back Quantitative

Quant Market in Numbers: Strong Financials Cash Return for Income Investors

Published on August 25, 2026

Download the PDF Report

By

Dennis DeBusschere

Sophia Wang

Kevin Brocks

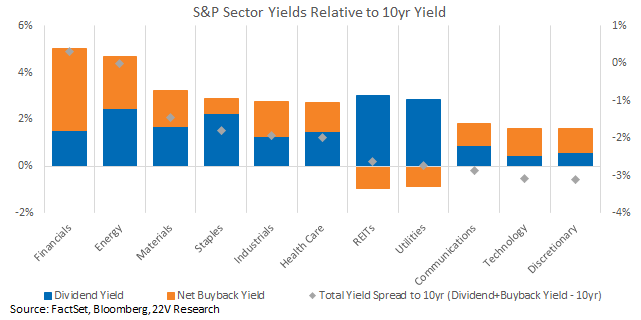
Financials stand out as an increasingly attractive source of cash return yield as the broader S&P 500 cash return weakens. Index cash yield declined in 2Q, reflecting lower net buybacks and an earnings mix increasingly skewed toward Hyperscalers (HERE). At the same time, higher 10-year Treasury yields have raised the hurdle for equities competing for income-oriented capital.

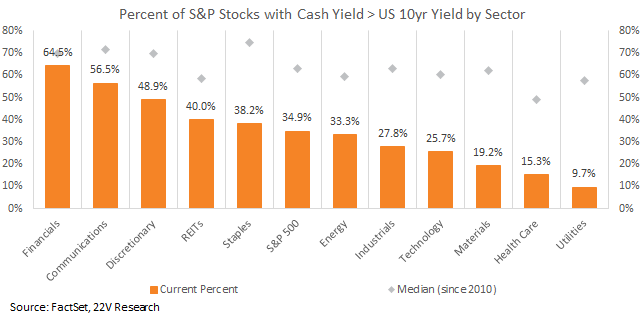
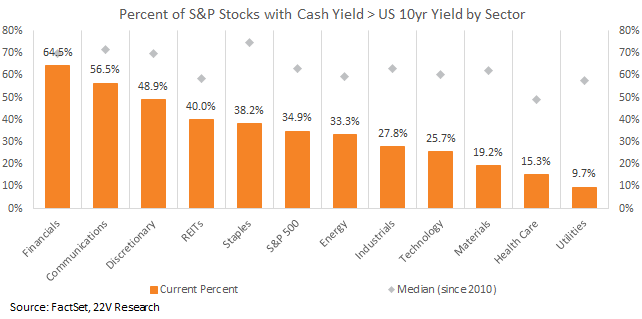
Against this backdrop, Financials remain differentiated. The sector currently has the highest cash return yield in the S&P 500 and is one of only two sectors with a yield above the 10-year Treasury, supported by particularly strong net buybacks. This strength is also broad-based: 64.5% of S&P 500 Financials have cash return yields above the 10-year yield, roughly twice the share in the overall index. Financials’ cash return metrics have also remained relatively stable versus their long-term history.
This strength is reflected in factor performance. Cash Return has been the best-performing S&P 500 factor this year, gaining 13.8% YTD, with Financials the largest contributor as well as the largest constituents. Within Financials, high Cash Return stocks have outperformed low Cash Return stocks by 15.7% YTD, reflecting that high cash return names within Financials not only generate strong cash return, but also reward investors with capital appreciation.

Meanwhile, Financials sector correlation has fallen toward its historical lows, suggesting greater importance of stock-specific fundamentals. Though increasing volatility and a flattening yield curve is a risk for Financials overall, Financials with high cash return yields and strong Cash Return characteristics remain attractive.

At the end of the report we list S&P 500 Financials cash return yield and Cash Return score for reference.

Strong Financials Cash Return for Income Investors: The index cash return ratio has dropped in 2Q, partially as a result of net buyback moving lower and earnings being increasingly skewed towards Hyperscalers (HERE). At the same time, rising 10yr yields lower the attractiveness of equities for income investors. Financials remain attractive for its high cash return yield, especially the strong net buybacks into this year. Currently, Financials has the highest cash return yield of all S&P 500 sectors and is one of two sectors with a cash return yield exceeding the 10yr yield.
A graph of blue and orange bars

Description automatically generated

The cash return distribution within Financials is broad based with 64.5% of S&P Financials posting a total return yields above the 10yr Treasury. That is roughly 2 times the reading for the S&P index. The cash return has been more stable for Financials than other sectors and its return spread to its typical level is also the lowest.
The Cash Return factor, constructed using yield, payout ratio and growth, has been the best performer within the S&P this year, gaining 13.8% YTD. The factor return breakdown shows Financials have been the major driver of its gains this year, which is in line with strong cash return yield for the sector.
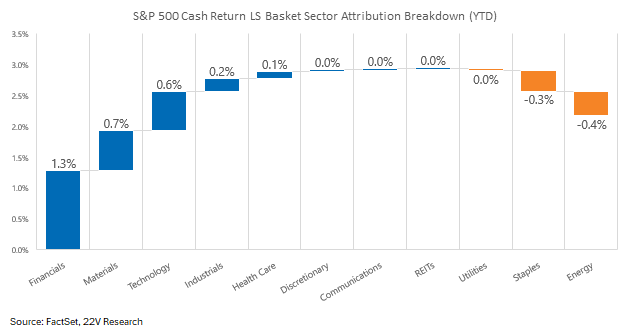
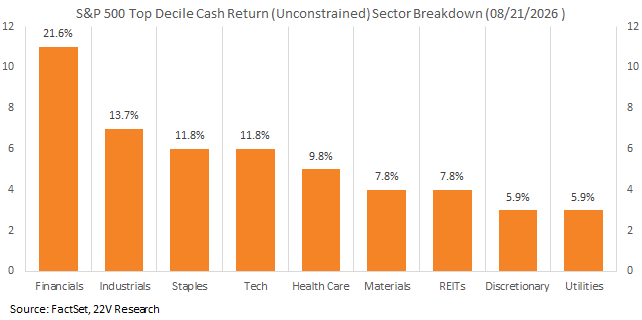
The sector weight within S&P 500 top decile Cash Return basket has the highest contribution from Financials as well.
A graph of a number of orange bars

Description automatically generated with medium confidence

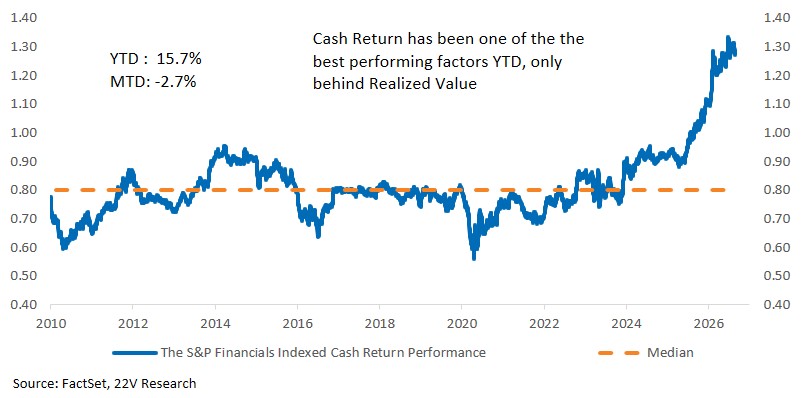
Within S&P Financials, going long long high Cash Return names and short low Cash Return names has generated a 15.7% YTD returns. So, even within a high cash returns sector, investors have shown a preference for the cash return factor.
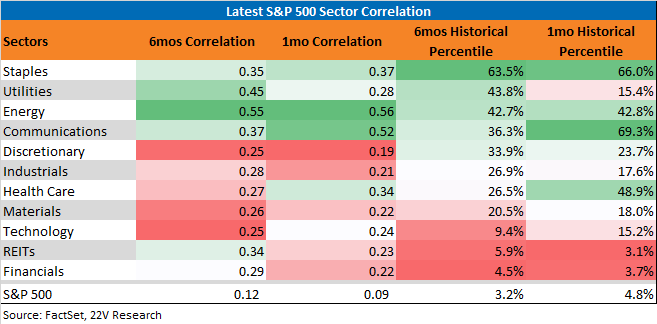
Currently, the correlations within Financials have dropped to an unusually lowl level. Absolute correlation is also low relative to other sectors, leaving stock returns Pmore impacted by single stock fundamentals than sector performance. Those with high Cash Return and strong fundamentals should have more tailwind within the sector.
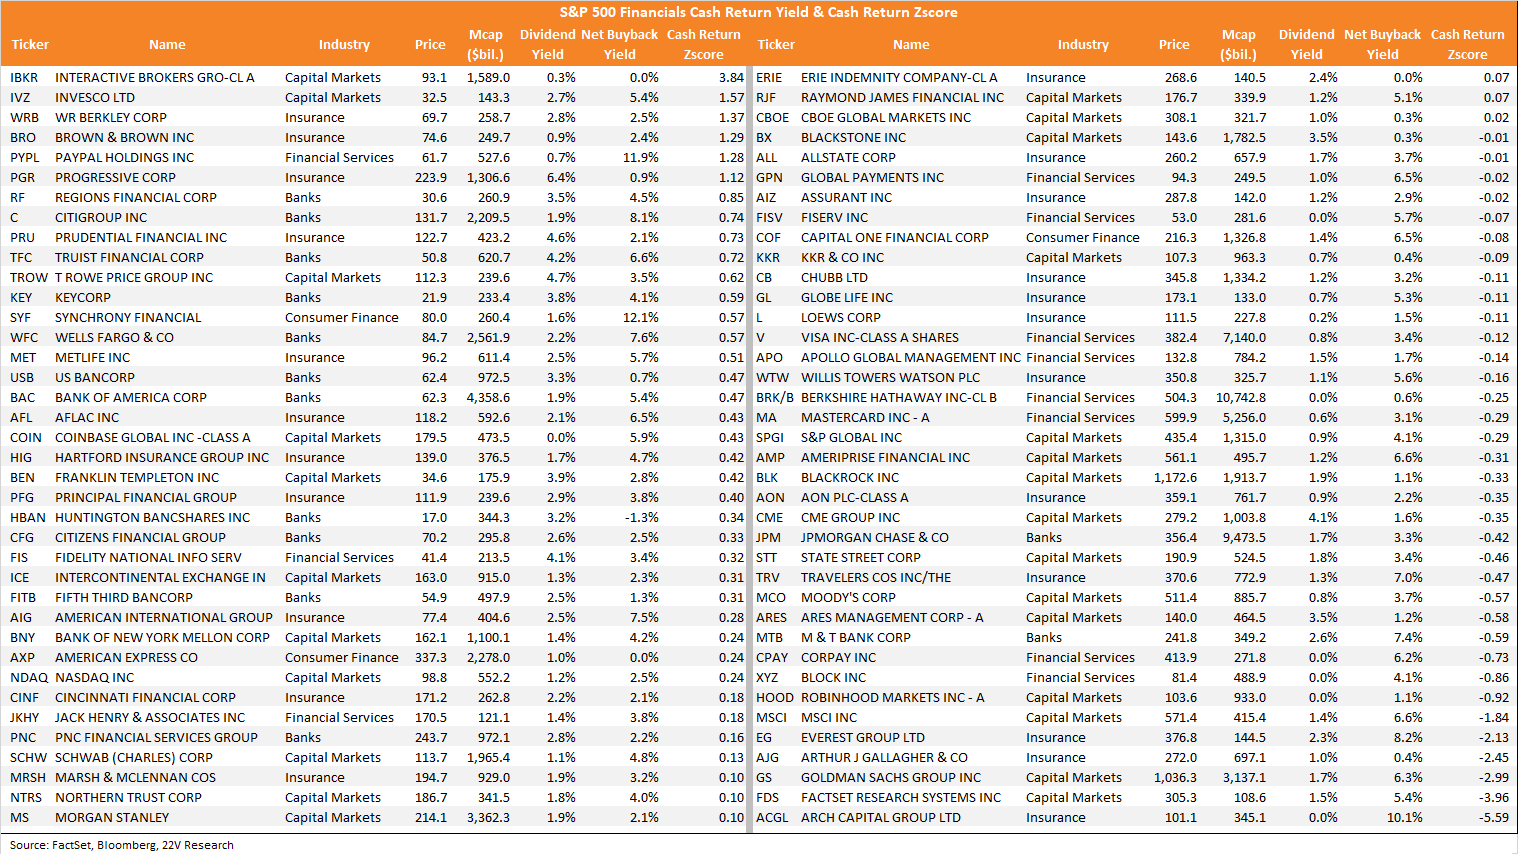
Below we list the S&P 500 Financials with their dividend yield, net buyback yield and Cash Return Z-score. Names with strong cash return yield and high Cash Return factor reading should be more attractive for Financials investors and income investors.
DISCLOSURES AND DISCLAIMERS

Analyst Certification

The analyst, 22V Research Group, primarily responsible for the preparation of this research report attests to the following: (1) that the views and opinions rendered in this research report reflect his or her personal views about the subject companies or issuers; and (2) that no part of the research analyst’s compensation was, is, or will be directly related to the specific recommendations or views in this research report.

Analyst Certifications and Independence of Research.

Each of the 22V Research analysts whose names appear on the front page of this report hereby certify that all the views expressed in this Report accurately reflect our personal views about any and all of the subject securities or issuers and that no part of our compensation was, is, or will be, directly or indirectly, related to the specific recommendations or views of in this Report.

22V Research (the “Company”) is an independent research provider. The Company is not a member of the FINRA or the SIPC and is not a registered broker dealer or investment adviser. 22V Research has no other regulated or unregulated business activities which conflict with its provision of independent research.

22V Research, LLC is a professional services and independent publication organization. 22V Research, LLC is not a securities broker-dealer, not a member of the Financial Industry Regulatory Authority (FINRA), not a registered investment advisor (RIA) and not a member of SIPC.

Securities transactions, when offered, are offered by 22V Securities, LLC through LPS Capital, LLC. Certain employees of 22V Securities, LLC are dually registered as securities representatives of LPS Capital, LLC or Analyst Hub Securities, LLC. 22V Securities, LPS Capital and Analyst Hub Securities are members FINRA, SIPC.

https://brokercheck.finra.org/

Current Ratings Definition.

SECTOR OUTPERFORM: An “outperform” rating anticipates the company will outperform the S&P Regional Banking Index (peer group).

SECTOR PERFORM: A “market perform” rating anticipates the company will perform in line with the S&P Regional Banking Index (peer group).

SECTOR UNDERPERFORM: An “underperform” rating anticipates the company will underperform the S&P Regional Banking Index (peer group).

Limitation Of Research And Information.

This Report has been prepared for distribution to only qualified institutional or professional clients of 22V Research Group. The contents of this Report represent the views, opinions, and analyses of its authors. The information contained herein does not constitute financial, legal, tax or any other advice. All third-party data presented herein were obtained from publicly available sources which are believed to be reliable; however, the Company makes no warranty, express or implied, concerning the accuracy or completeness of such information. In no event shall the Company be responsible or liable for the correctness of, or update to, any such material or for any damage or lost opportunities resulting from use of this data. Nothing contained in this Report or any distribution by the Company should be construed as any offer to sell, or any solicitation of an offer to buy, any security or investment. Any research or other material received should not be construed as individualized investment advice. Investment decisions should be made as part of an overall portfolio strategy and you should consult with a professional financial advisor, legal and tax advisor prior to making any investment decision. 22V Research Group shall not be liable for any direct or indirect, incidental or consequential loss or damage (including loss of profits, revenue or goodwill) arising from any investment decisions based on information or research obtained from 22V Research Group.

Reproduction And Distribution Strictly Prohibited.

No user of this Report may reproduce, modify, copy, distribute, sell, resell, transmit, transfer, license, assign or publish the Report itself or any information contained therein. Notwithstanding the foregoing, clients with access to working models are permitted to alter or modify the information contained therein, provided that it is solely for such client’s own use. This Report is not intended to be available or distributed for any purpose that would be deemed unlawful or otherwise prohibited by any local, state, national or international laws or regulations or would otherwise subject the Company to registration or regulation of any kind within such jurisdiction.

Copyrights, Trademarks, Intellectual Property.

22V Research Group, and any logos or marks included in this Report are proprietary materials. The use of such terms and logos and marks without the express written consent of 22V Research Group is strictly prohibited. The copyright in the pages or in the screens of the Report, and in the information and material therein, is proprietary material owned by 22V Research Group unless otherwise indicated. The unauthorized use of any material on this Report may violate numerous statutes, regulations and laws, including, but not limited to, copyright, trademark, trade secret or patent laws.
