Back Quantitative

Quant Market in Numbers: Improving Fundamentals the Major Driver of Market Gains

Published on July 2, 2026

Download the PDF Report

By

Dennis DeBusschere

Sophia Wang

Kevin Brocks

FYI Model Adjustment Notice: Beginning July 2026, the Commodity index input CRB RIND Index has been replaced with the SPGSNETR Index due to data discontinuation. The revised model maintains 91% historical classification agreement with the prior model, with all prior Transition and Recession classifications in place.

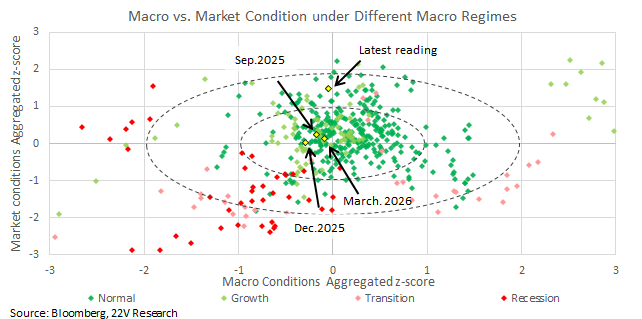
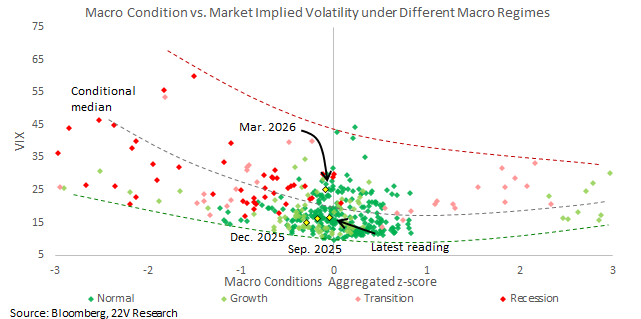
Concerns over a prolonged Fed tightening cycle have increased, but our macro regime model continues to classify the current environment as a Normal expansion, with both macro and market conditions well within their historical ranges. Although implied equity vol has increased as investors reassess the path of inflation and Fed policy, the deterioration reflects greater uncertainty rather than a meaningful weakening of economic data.
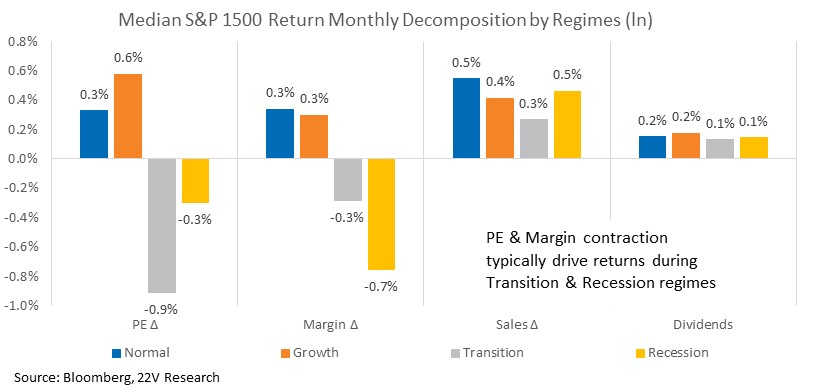
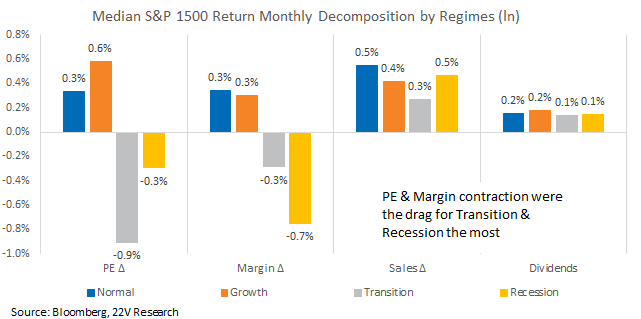
As we mentioned (HERE), the S&P has generally delivered positive returns throughout the duration of sustained Normal regimes. During these periods, sales growth has been the primary driver of S&P 1500 returns, supplemented by steady margin expansion, while valuation multiples have remained relatively stable. The current cycle continues to follow this pattern. By contrast, Transition and Recession regimes have historically been marked by contracting margins and significant multiple compression. Under the current Normal expansion, sales and margins should continue to expand during the upcoming 2Q reporting season, and economic trends favor stronger than expected for SPS and EPS readings.

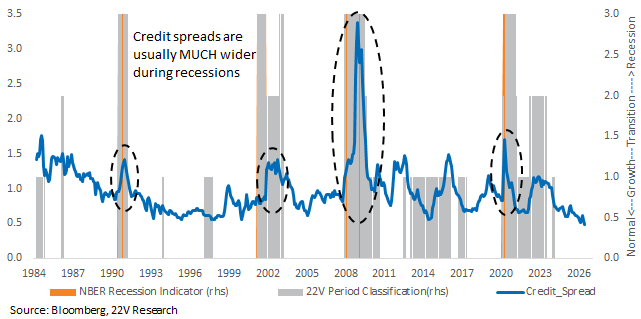
Currently, almost all macro variables are around normal levels, except for credit spreads. Moody’s BAA-AAA spreads are near their tightest level in more than four decades, suggesting limited room for further compression. While spreads could gradually normalize as policy uncertainty persists, it is unusual to see sustained sharp credit spread widening during Normal expansions periods.

Overall, the combination of stable macro conditions, healthy corporate fundamentals, and low recession risk continue to support a constructive outlook for equities despite elevated near-term volatility.

Improving Fundamentals the Major Driver of Market Gains: Concerns about a possible Fed tightening cycle are weighing on risk assets, but the underlying macro backdrop has remained largely unchanged. Both market and macro conditions suggest a continued Normal economic expansion. Recent market performance has been driven primarily by the AI investment theme, pushing the latest market conditions reading toward the upper end of the historical Normal distribution and further away from the ranges typically observed during Transition or Recession regimes.
A diagram of a market condition

Description automatically generated

Though macro conditions remain stable, uncertainty has increased, reflected in higher implied equity volatility. Based on Strategy team’s view (HERE), investors are discounting the possibility of a rate hike in 2026 because core inflation trends remain too strong. The policy path remains data dependent, and current policy remains supportive of growth. The uncertainty in markets is due to the increased risk that policy could turn restrictive.
A graph showing a number of different types of stocks

Description automatically generated with medium confidence

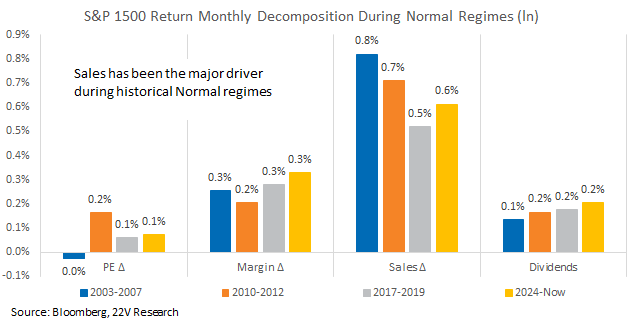
As we mentioned (HERE), equities tend to perform well throughout Normal economic expansions. The driver of index gains during Normal expansions has been improving corporate fundamentals, particularly sales growth, while margin expansion provided additional support. The current cycle, which started in 2024 continues to fall into that historical pattern with sales and margin changes the main contributors to gains. That is in line with strong earnings expectation this year. Consensus estimates of S&P EPS for CY26 are $343, +14.5% y/y.
A graph of sales and sales

AI-generated content may be incorrect.

By comparison, margins drop during historical Transition and Recession periods and multiples tend to contract. Currently, we continue to see expanded sales and margins, particularly among AI-related companies, which is inconsistent with a near term Recession.
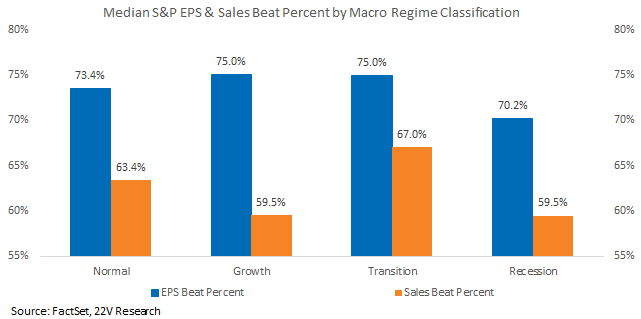
With 2Q earnings season about to kick off in two weeks, we should expect the earnings and sales to again beat expectations by a significant margin with most names beating their estimates in the current Normal expansion backdrop.
A graph of sales and sales

AI-generated content may be incorrect.

Credit Spreads Remain Outlier Good: Almost all the macro variables are within their normal ranges, with credit spread (measured as spread of Moody’s Corporate BAA – AAA) is the only outlier. Spreads are currently at their tightest level since at least 1984. The extreme tightness of spreads and the strong uptick in capex suggests spreads should widen from here. However, it is rare for spreads to widen materially and persistently during economic expansions. With objective recession odds low, spreads should remain well behaved.
A graph of a graph with blue lines and white text

AI-generated content may be incorrect.

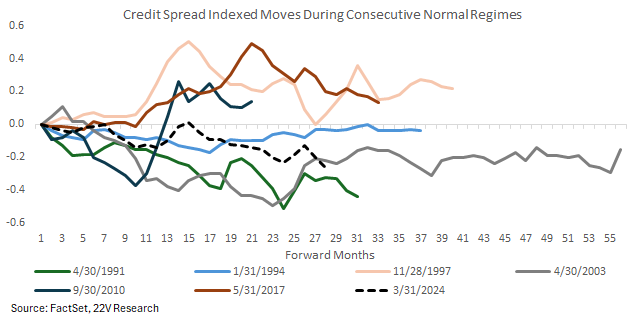
Credit spread moves during historical Normal cycles have been varied directionally, but have generally remained range-bound, with relatively few episodes of sustained or abrupt widening. This historical behavior suggests that even if credit spreads begin to normalize from today’s unusually tight levels, the adjustment is more likely to be gradual than indicative of an imminent economic downturn.
DISCLOSURES AND DISCLAIMERS

Analyst Certification

The analyst, 22V Research Group, primarily responsible for the preparation of this research report attests to the following: (1) that the views and opinions rendered in this research report reflect his or her personal views about the subject companies or issuers; and (2) that no part of the research analyst’s compensation was, is, or will be directly related to the specific recommendations or views in this research report.

Analyst Certifications and Independence of Research.

Each of the 22V Research analysts whose names appear on the front page of this report hereby certify that all the views expressed in this Report accurately reflect our personal views about any and all of the subject securities or issuers and that no part of our compensation was, is, or will be, directly or indirectly, related to the specific recommendations or views of in this Report.

22V Research (the “Company”) is an independent research provider. The Company is not a member of the FINRA or the SIPC and is not a registered broker dealer or investment adviser. 22V Research has no other regulated or unregulated business activities which conflict with its provision of independent research.

22V Research, LLC is a professional services and independent publication organization. 22V Research, LLC is not a securities broker-dealer, not a member of the Financial Industry Regulatory Authority (FINRA), not a registered investment advisor (RIA) and not a member of SIPC.

Securities transactions, when offered, are offered by 22V Securities, LLC through LPS Capital, LLC. Certain employees of 22V Securities, LLC are dually registered as securities representatives of LPS Capital, LLC or Analyst Hub Securities, LLC. 22V Securities, LPS Capital and Analyst Hub Securities are members FINRA, SIPC.

https://brokercheck.finra.org/

Current Ratings Definition.

SECTOR OUTPERFORM: An “outperform” rating anticipates the company will outperform the S&P Regional Banking Index (peer group).

SECTOR PERFORM: A “market perform” rating anticipates the company will perform in line with the S&P Regional Banking Index (peer group).

SECTOR UNDERPERFORM: An “underperform” rating anticipates the company will underperform the S&P Regional Banking Index (peer group).

Limitation Of Research And Information.

This Report has been prepared for distribution to only qualified institutional or professional clients of 22V Research Group. The contents of this Report represent the views, opinions, and analyses of its authors. The information contained herein does not constitute financial, legal, tax or any other advice. All third-party data presented herein were obtained from publicly available sources which are believed to be reliable; however, the Company makes no warranty, express or implied, concerning the accuracy or completeness of such information. In no event shall the Company be responsible or liable for the correctness of, or update to, any such material or for any damage or lost opportunities resulting from use of this data. Nothing contained in this Report or any distribution by the Company should be construed as any offer to sell, or any solicitation of an offer to buy, any security or investment. Any research or other material received should not be construed as individualized investment advice. Investment decisions should be made as part of an overall portfolio strategy and you should consult with a professional financial advisor, legal and tax advisor prior to making any investment decision. 22V Research Group shall not be liable for any direct or indirect, incidental or consequential loss or damage (including loss of profits, revenue or goodwill) arising from any investment decisions based on information or research obtained from 22V Research Group.

Reproduction And Distribution Strictly Prohibited.

No user of this Report may reproduce, modify, copy, distribute, sell, resell, transmit, transfer, license, assign or publish the Report itself or any information contained therein. Notwithstanding the foregoing, clients with access to working models are permitted to alter or modify the information contained therein, provided that it is solely for such client’s own use. This Report is not intended to be available or distributed for any purpose that would be deemed unlawful or otherwise prohibited by any local, state, national or international laws or regulations or would otherwise subject the Company to registration or regulation of any kind within such jurisdiction.

Copyrights, Trademarks, Intellectual Property.

22V Research Group, and any logos or marks included in this Report are proprietary materials. The use of such terms and logos and marks without the express written consent of 22V Research Group is strictly prohibited. The copyright in the pages or in the screens of the Report, and in the information and material therein, is proprietary material owned by 22V Research Group unless otherwise indicated. The unauthorized use of any material on this Report may violate numerous statutes, regulations and laws, including, but not limited to, copyright, trademark, trade secret or patent laws.
