July Employment Report Shows Hard Data More Aligned with the Post-Liberation Day Feel
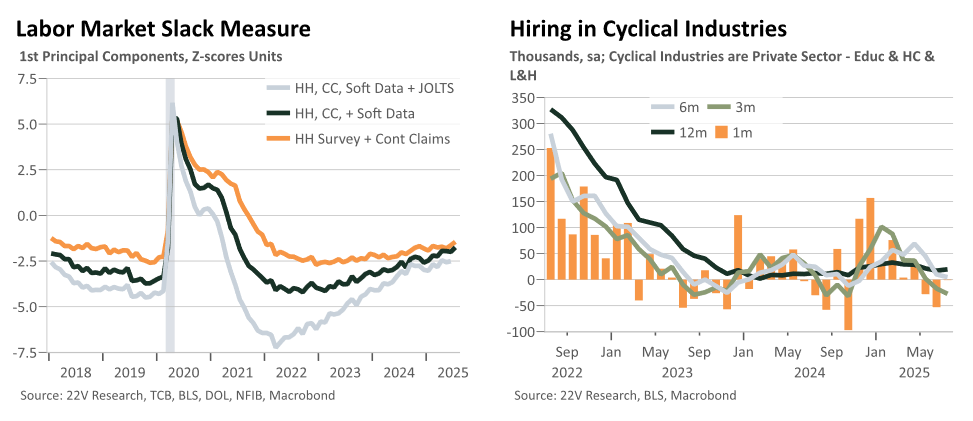
- The 73k print for July was not all that bad on its own but the massive downward revisions to May and June stole the show, with 3m avg payroll gains at only 35k now. The unemployment rate jumped from 4.11% to 4.248%. Other internals were mixed. Broadly measured slack edged higher on the month to a new cycle high.
- A frozen labor market, with employers unwilling to fire or hire much, leads to solid enough outcomes for those still employed and quite harsh ones if not.
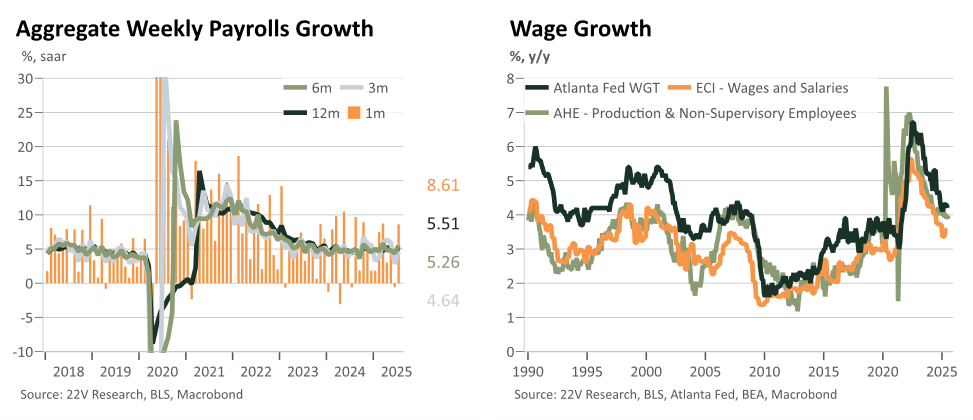
- Take home payroll growth and wage growth continue to remain solid and, along with fairly steady to improving jobless claims, are a key measure of support for the medium-term.
- It is unclear how the July data will hold up, but it currently seems that most measures of labor activity (cyclical NFP, claims, tax receipts) took a leg down from mid-April to early-June before improving a bit.
- Much of the outlook for the back half of the year depends on if AI’s ongoing buildout and increased certainty on tariffs, even if costly, results in a move away from this posture and continued low layoffs and robust income growth trends support spending in the face of the hit from tariffs.
- Rates’ reaction today, and modest reaction to the solid to slightly hawkish events earlier in the week, suggest that combination of recessionary-like concerns and assumed reaction function skew of the next Fed chair dominate inflationary views. Whether this survives contact with the push higher in inflation over the next few months remains to be seen.
Since Liberation Day: total payrolls have grown only 104k the last 3 months, jobless claims are either as or slightly better than expected, card spending data was volatile initially but has grown steadily at a solid pace (something earnings reports from banks and card processors confirmed), aggregate income growth measures continue to chug around 5% or above, real activity is broadly slowing as immigration dents labor supply and tariff’s drag bites, the soft data has rebounded from its lows but is still in the doldrums, and effective tariff rates keep creeping higher. Quite a mixed picture. The base case of continued narrow growth and sluggish overall activity through the back half remains, with uncertainty fading but tariffs biting more.
I would not extrapolate this to anything like what the normal definition of the term means, but the data today does make me wonder a bit if a meaningless, i.e. with no nonlinearities in markets or cyclical sectors or appreciable jumps in slack, but broad-enough NBER style ‘recession’ could take place given some trends in the real data and labor dynamics(real income trends and, weirdly under the circumstances, industrial production both lean against this technical possibility). Far from base case but worth pondering a bit (a possibility I raised back in mid-June here).
With the m/m data and crosscurrents noisier than normal, and the confidence in any particular modeling approach or lean on the signal from any specific data also weaker than normal, the ability to confidently project forward any specific outcome is substantially reduced. The echoes of last summer’s weakness before stability (something that this years’ higher frequency data also echo so far), also lean against overextrapolation of the m/m data today.
NFP growth since Liberation Day (the last 3 months) has averaged only 35k a month and will likely be negative once eventual benchmark revisions take place in early 2026. There is little inclination to trust initial month prints of NFP at this point given recent revisions, but it seems consistent with the soft data that cyclical NFP was weakest in May and June. The breadth of payrolls growth is now at historically weak levels when outside of a recession. These things are not necessarily inconsistent with the sluggishness of the labor supply-side and the continued steady growth of health care employment over time. Indeed, narrow breath is likely required given those two trends if some continued underlying disinflation is to occur.
Given that the unemployment rate has been roughly flat over the past few months (despite the move higher today), this suggests that breakeven NFP growth is very likely below 100k now and taking into account eventual benchmark revisions may be as low as 30k over the last 6m.
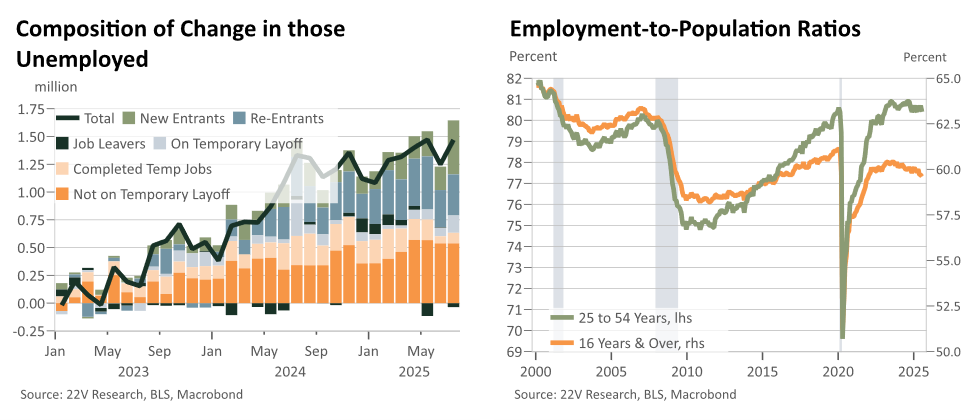
The household survey was also soft, even if the changes there tend to appropriately be buffered by the focus on the rates rather than levels there. The unemployment rate’s move higher takes it to a new cycle high at the unrounded level. The internals of the HH survey were mixed with some margins of the labor market continuing to soften. The share of workers on permanent layoff has actually declined slightly the past few months and prime-age employment to population rate, not qualitatively dissimilarly from the unemployment rate, remains in its range over the past year.
The cause for cautious optimism (anti-pessimism perhaps) does remain though and I think shouldn’t be too readily dismissed given the impacts of tariffs’ uncertainty on hiring propensities since Liberation Day. For one, nominal card spending trends remain strong with delinquencies stable to slightly improving (see more here). Wage growth remains perhaps too hot relative to inflation and lab market slack measures; not necessarily great news for the 2026+ inflation outlook but does provide cushion for households from the tariff inflation to come and support for consumption growth. Similarly, aggregate take home payrolls growth trends are running between 5-6% y/y, with a lot of noise in the short-term. Tax receipts from the Treasury Department tell a similar, if even more optimistic, story as well after a sluggish April and May (see more here).