Summary: It was a risk-on week. The S&P was +95bp, but small caps increased +3% and risk-on factors significantly outperformed risk-off factors. The 22V long high Vol vs short Low Vol swap, which is net neutral, was +2.6% WoW and the long Earnings Risk Factor vs Short Low Vol factor (MS22RISK Index on bbg) was +3%. That is also net neutral swap.
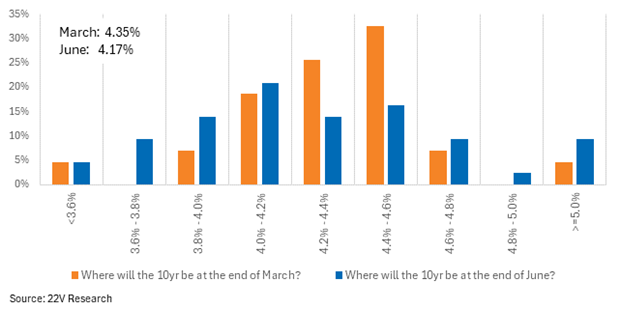
A few things have led to the inflection higher in risk-on factors over the past few weeks. First, 67% of the investors we surveyed yesterday think 10yr yields will end March higher (HERE) and 35% of those investors thought a +4.5% 10yr is possible. The yield set up has been a bit hawkish to start the year, but we haven’t had any hawkish surprises recently.
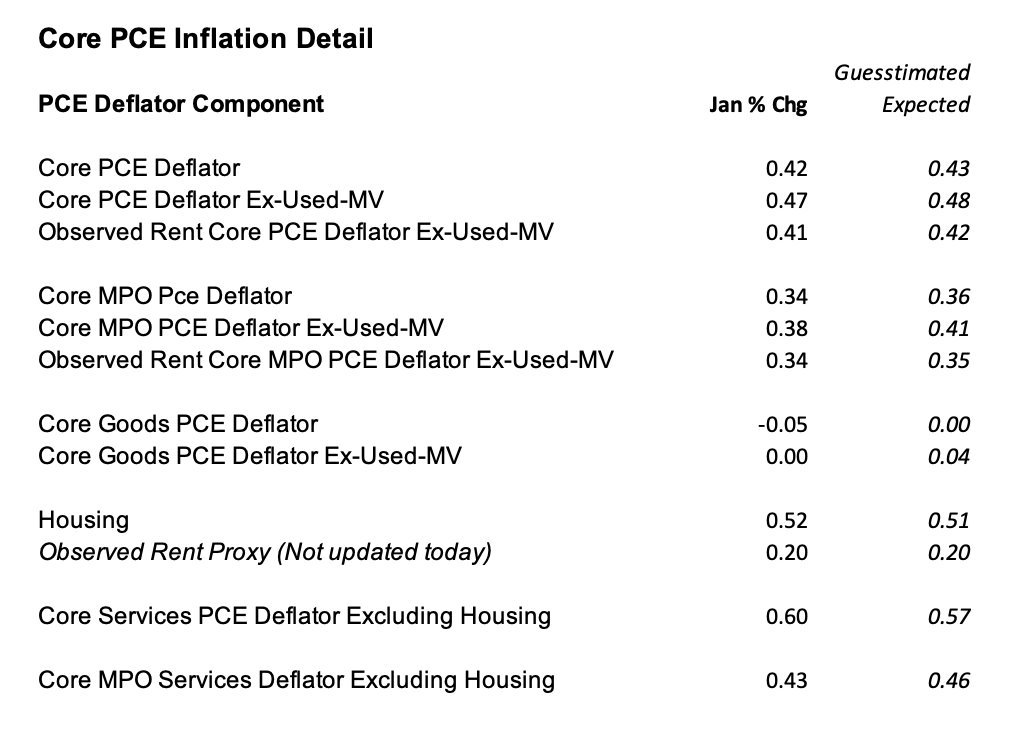
Second, core PCE data was not as bad as feared. Consensus called for a 60bps in the “Powell Supercore,” which we got and is high, but 11 bps of that was due to noisy portfolio management fees and 7 bps were due to non-market prices. Most economists are not extrapolating portfolio management fees and non-market price noise, hence the decline in rates following the PCE print.
Third, as Gerard pointed out on the Friday webinar (HERE), “the real consumer spending data to January suggests that real spending is likely to rise at a rate between 2% and 2.5% during the first quarter. That is consistent with broader GDP growth again above consensus, but by a narrower margin than in the past several months.” On Friday the Atlanta FedGDPNow Cast for 1Q24 GDP growth declined to 2.1% from 3%. The weak ISM and construction spending data were the drivers of the decline. 10yr yields declined sharply Friday after the ISM and yields accelerated to the downside after the Atlanta Fed GDP release.
Bottom Line: The 22V view is inflation data will remain ‘good enough’, allowing the Fed to begin cutting in 2024. The number of cuts will be driven by activity data. We have been harping on this point all year. 6+ cuts was not going to happen in a 2-2.5% GDP growth backdrop (see 2024 Outlook here). Our call has consistently been 3-4 cuts with 2-2.5% Real GDP growth and that is a positive for risk assets. The greater risk has been that too strong economic growth and inflation could lead to zero cuts. We maintain this view.
What Would Cause A HAWKISH Fed Reaction: Peter Williams pointed (HERE) that if the Fed were to assume a 2024 growth forecast of 2.75%ish or above, policy could become outright hawkish, rather than less dovish. 2.75% would be +100bps above their current view of long-run potential. At the start of last week, Atlanta Fed 1Q GDPNow was tracking at 3.2%. That declined to 2.1% by Friday.
Tactical: We have pressed our risk-on sector and factor view tactically over the past few weeks. Payroll on 3/8 and CPI on 3/12 present obvious short-term risks. We don’t see a reason to take off that trade for now but would shift IF the data are obviously too hot. Assuming readings are around consensus, Gerard’s view that we should NOT press for even a moderate short on the short end of the yield curve makes sense. The market and the Fed are basically inline on the number of rate cuts and there appears little reason for the Fed to be more hawkish than they have been.
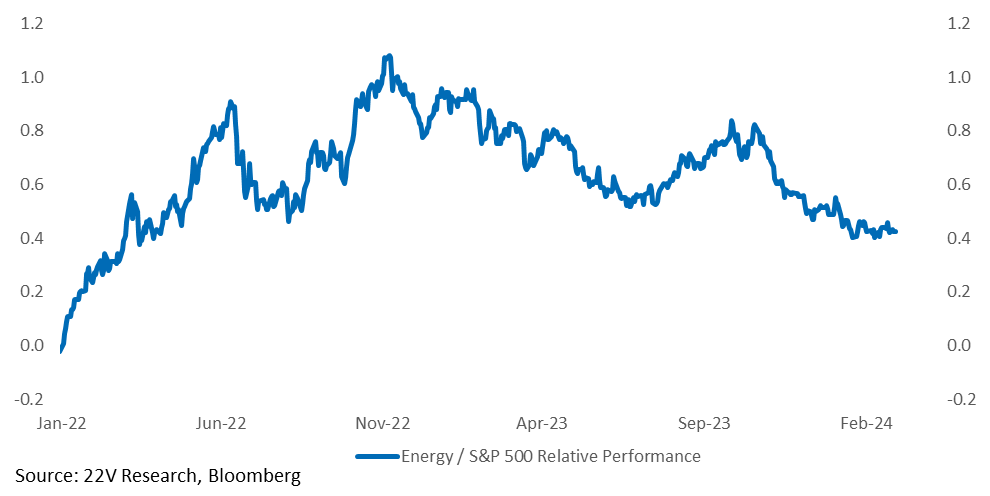
Energy: Cyclicals are significantly outperforming Defensives, but one Cyclical that has lagged is Energy. In a normal economic expansion, which we are in now, all Cyclicals benefit over time. Energy has been a Cyclical laggard and some catch should be expected. See the Energy Stocks John Roque likes in the full report.
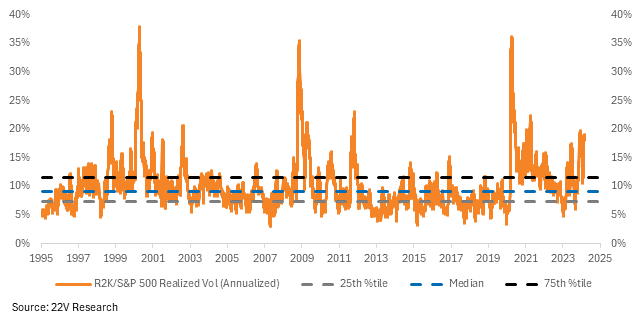
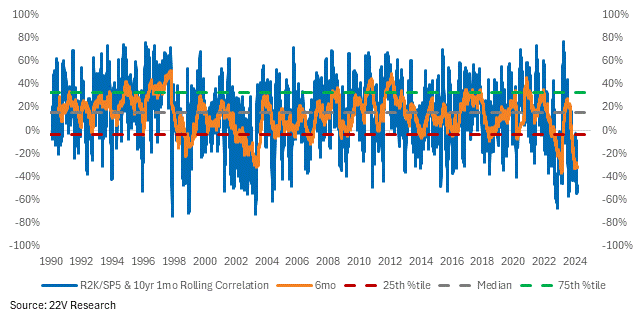
The annualized realized volatility of the Russell vs S&P is in its 95th percentile. If payrolls and CPI do not deliver major surprises, small cap vol should continue to move much lower relative to large caps. The same logic applies to risk-on factor vol.
Risk/10yr and Dividend Paying Stock Long Entry Point: There is some risk residual seasonality that impacted the January CPI data carry over to February. That adds upside risk to consensus on CPI. The time to get long rates, if you believe the seasonality argument, is later in March after the Feb CPI. Not before. Again, we are neutral rates now and Peter Williams likes the 4.5%-4.7% range for an outright long in bonds. High yielding Defensives stocks and the 22V sustainable dividend basket (MS22DIV Index) is an interesting long the 10yr reaches the 4.5%-4.7% range.
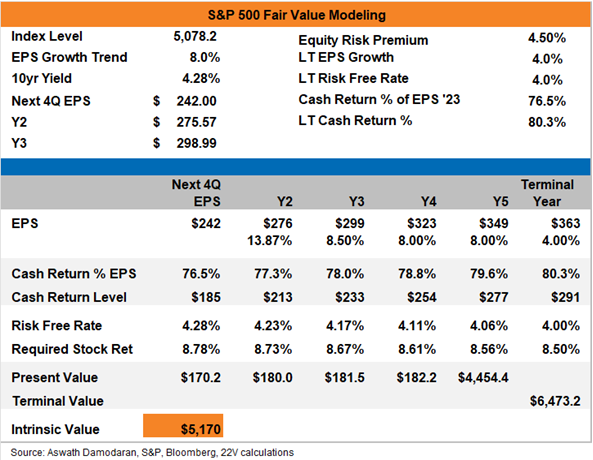
S&P Fair Value Update: Assuming the current 4.5% ERP estimate (which is reasonable unless FCI meaningfully tightens) and cash return levels continue, S&P fair value, applying Professor Damodaran’s discounted cash return equity risk premium methodology (HERE), is currently 5170, which not far from Friday’s close. Not very exciting from a forward return perspective. This is why we are focused on market internals and a broadening out of winners. GARP is our favorite factor.
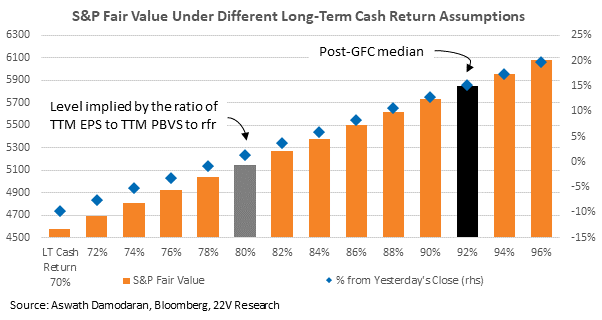
The Upside Fair Value Risk: Current cash return (dividend + buyback relative to the S&P TTM net income and cash flow) is currently 76.5%. That is what we use in our fair value calculation. That is below the long term median of 80% and well below the post-GFC median of 90%. If the monopolistic characteristics of the top quintile of S&P names (the ones that contribute the most to buybacks) continue, cash returns as a % of net income and cash flow are likely headed higher. FYI, if we assume the post-GFC median cash return of 90%, S&P fair value is significantly higher (5900). We are not saying that will happen, but directionally, higher on buybacks as a % of net income is more likely than lower.
Charts and commentary below…
Indicators: 67% of the investors we surveyed last week think 10yr yields will end March higher (HERE). The median expectation for the 10yr yield at the end of March is 4.35%, and the median for the end of June is 4.17%. 30% think the 10yr yield could reach the 4.4%-4.6% range by the end of March.
The January price data clearly reinforced the case for the Fed to go slowly. But yesterday’s PCE deflator and detail were not incremental to that. If anything, the key details were marginally to the light side of expectations held at 8:29 AM last Friday.
Source: BEA, FH calculations including chaining
Data are actual to January.
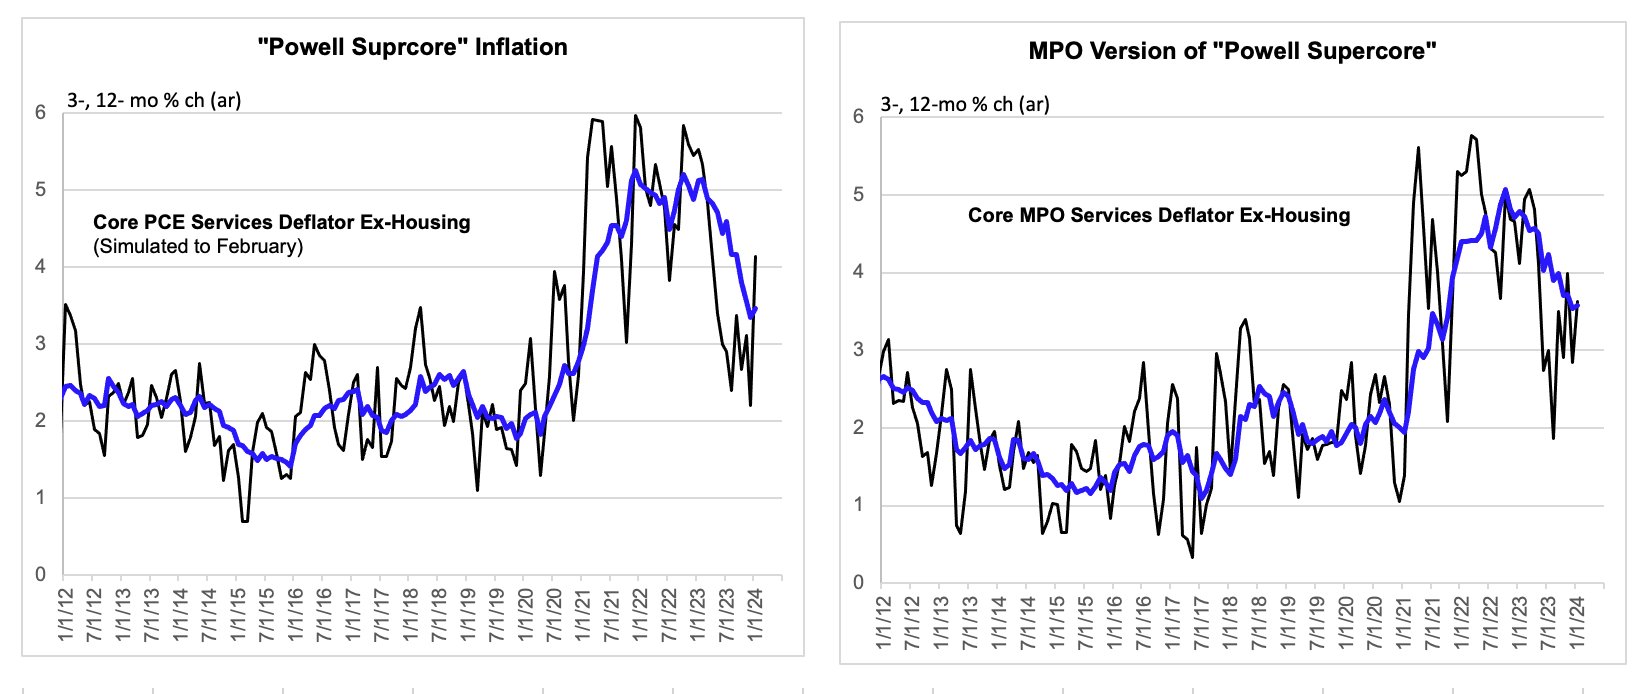
The conventional measure of the so-called “Powell Supercore” was up 60 bps in January, but 11 bps of that was due to noisy portfolio management fees and another 7 were due to other non-market prices. The Market Price Only (MPO) version of the Supercore was up 43 bps, which is firm, but actually slightly light relative to what people were (implicitly) expecting at 8:29AM ET last Friday.
Source: BEA, FH calculations including chaining
Data are actual to January.
There were two interesting developments on the real growth side this week. First, revised GDP data show that inventory investment during Q4 was running at about a normal rate, having previously been reported as somewhat elevated. This eliminates what had looked like a very minor prospective headwind. The inventory story is now neutral. Second, core (ex-auto) real consumption was flat during January and leaves real PCE growth for the quarter apparently tracking at 2 – 2 ½% (ar).
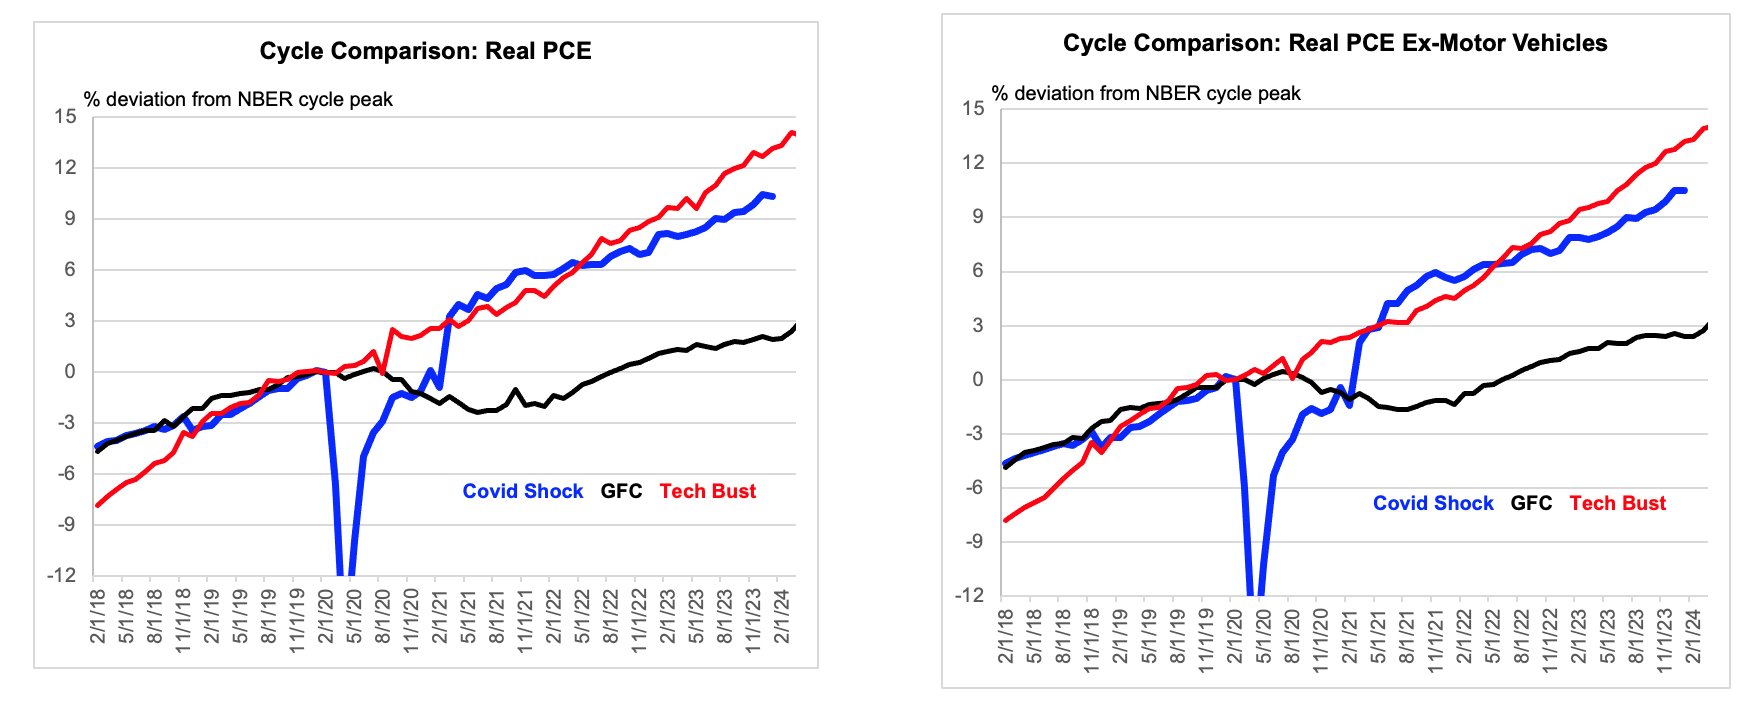
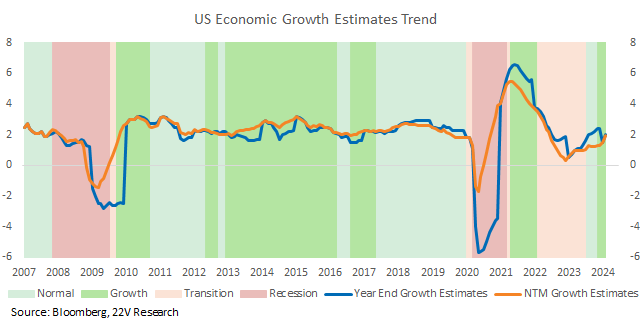
Source: NBER, 22V Research
Regime classification remains highly sensitive to yields (HERE) and so recent yield vol is weighing on the growth backdrop. The offsetting force is broad financial conditions, which have remained steady, helped lower by further compression of credit spreads. Both the Atlanta Fed GDPNow and consensus NTM GDP growth expectations have moved higher recently. That is consistent with historical Growth regimes and is a tailwind for risk assets and risk-on factors.
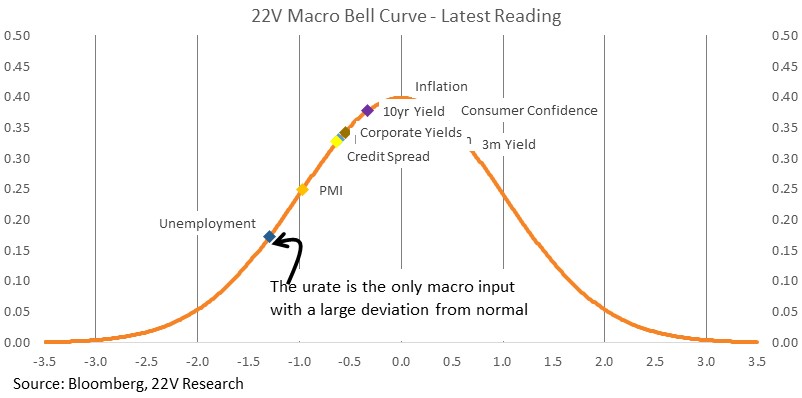
Most macro indicators have moved back into their normal ranges relative to history (within 1std), including inflation when measured by core PCE (the Fed’s focus). Unemployment remains VERY low relative to history. That is not a problem UNLESS we start seeing increased AHE, inflation. The bottom line is higher yields are a headwind, but unless financial conditions tightened from here, risk-on, Cyclical, GARP, leadership remains our base case.
The annualized realized volatility of the Russell vs S&P is in its 95th percentile. If payrolls and CPI do not deliver large surprises, small cap vol should continue to move lower relative to large cap. The same logic applies to risk-on factor vol.
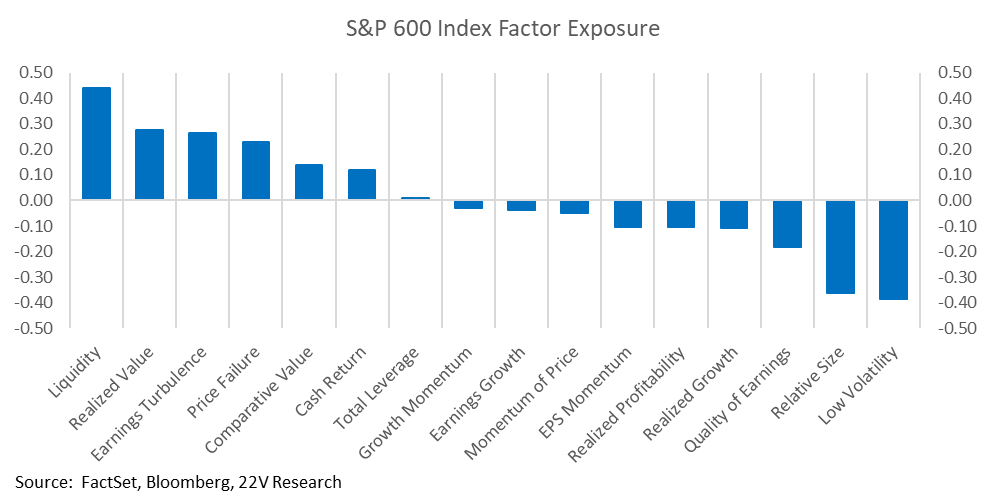
Small cap factor exposures demonstrate the index is heavily skewed toward risk-on factors. The index is positively exposed to Liquidity and Earnings Turbulence, and negatively exposed to Profitability, Quality, and Low Vol. As we’ve been writing (HERE), small caps as an index are extremely sensitive to anything that shifts how long the economic expansion can continue.
Investors are starting to believe smaller cap companies “can live” with higher rates (which is been the case so far), would start to change the deeply negative relationship between 10yr yields and small cap relative performance.
Energy: Cyclicals are significantly outperforming Defensives, but one Cyclical that has lagged is Energy. In a normal economic expansion, which we are in now, you should expect all Cyclicals to benefit over time. Energy has been a Cyclical laggard, and some catch should be expected.
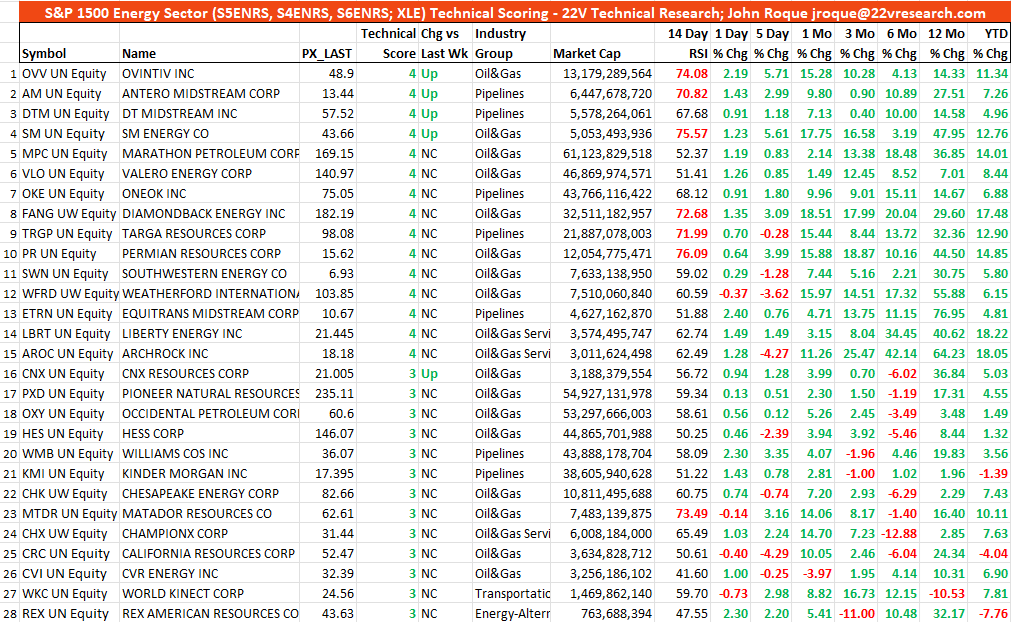
John Roque highlighted the top 28 Energy stocks within the S&P 1500 Energy sector Yesterday (S&P 500 + S&P 400 + S&P 600). According to John, “within this list (39% of the S&P 1500 Energy Sector), please notice the 5 stocks that are benefitting from a pickup in their Scores: OVV, AM, DTM, SM, and CNX. Without engaging in hyperbole, these 5 are in good buy/add spots.” The rest of the list shows the energy stocks with positive Technical scores.
Source: Bloomberg, 22V Research
Fair Value Update: Applying Professor Damodaran’s equity risk premium calculation methodology (HERE), which regards current index value as discounted future cash return, current S&P ERP is around 4.5%. We would expect the ERP to remain around current levels if the economic backdrop is more like the pre GFC period, vs the post GFC period. The post GFC period was defined by private sector deleveraging, consistent disinflation risk and unusually high ERP’s.
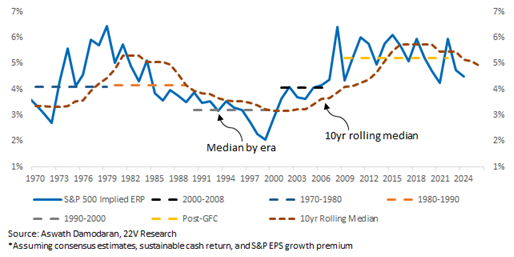
Assuming the 4.5% ERP estimate and current expected cash returns remain around current levels, the fair value for the S&P, using the discounted cash return methodology, is currently 5170, which is less than 2% higher than the close price yesterday. As we pointed out last week, investor sentiment is above the 75th %tile relative to the breadth of data, suggesting lower than normal forward returns for the S&P on a 1/3/6 month basis. Our fair Value framework and elevated sentiment relative to economic data is consistent with our call that the S&P is likely to be range bound near term.
The Upside Risk to Fair Value: The current cash return (dividend + buyback relative to the S&P TTM net income and cash flow) is currently 76.5%. That is below the long term median of 80% and well below the post GFC median of 90%. If the monopolistic characteristics of the top quintile of S&P 500 names (the ones that most contribute to buybacks) are going to remain for much longer, cash returns as a % of net income and cash flow is likely headed higher. Buybacks are already increasing. FYI, if we assume the post GFC median cash return of 90%, S&P fair value is significantly higher (5900). We are not saying that will happen, but directionally, higher on buybacks as a % of net income seems much more likely than lower.
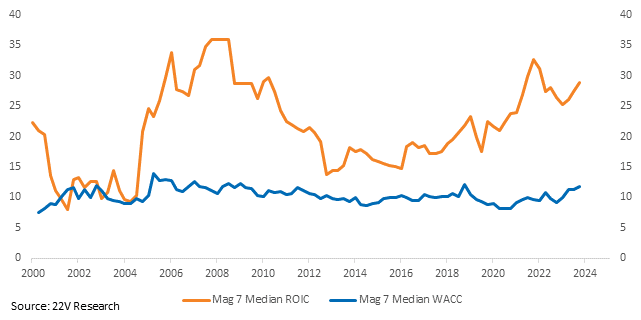
Monopolies and platform effects may potentially keep cash return ratios elevated. Mature companies’ return on invested capital is supposed to gravitate toward their cost of capital. That assumption may not hold for monopolistic companies with network affects. Check out the ROIC vs. WACC of the Mag 7 below. FYI Ben Thompson does great work on why network effects are so powerful – check out his stuff HERE. Worthwhile reading.
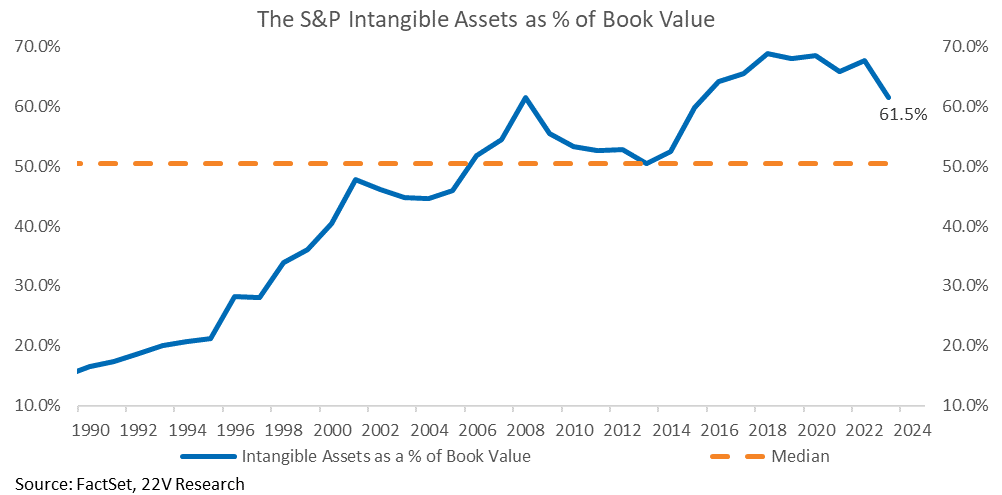
A drawback of the formula we use is that BVPS doesn’t include intangibles, and intangibles as a percent of book value have been increasing for the S&P.
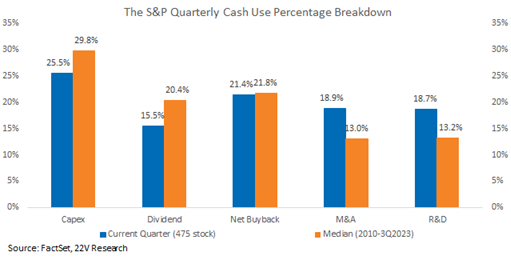
As noted last week (HERE), buybacks fell in 1H23 as earnings contracted and macro uncertainty peaked. In the second half, buybacks rebounded. S&P EPS is expected to expand 9-10% in 2024, setting the stage for a rebound in buybacks. Upward surprises on revenue, margins, and EPS + easing of economic tail risks suggest buybacks will continue to move higher throughout 2024.
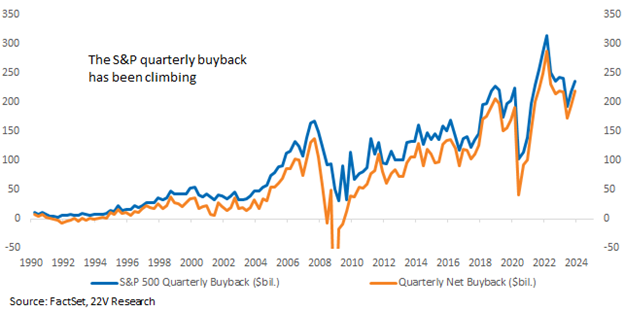
Buybacks are still a preferred use of capital, even with R&D and M&A expanding in 4Q. ROIC vs WACC tells us the Mag 7 is likely to keep generating large amounts of cash, and use-of-cash data indicates returning some of that cash to shareholders is still popular. That has the potential to raise fair value significantly.