Weekly: As has been the case for a few months, the biggest risk to the no-recession call remains inflation staying too high, forcing the Fed to tighten Financial Conditions further. A narrative that builds off that concept, that growth is too strong and will require further tightening of financial conditions, has started to form.
The New York Fed Weekly Economic Index (WEI), our favorite high-frequency indicator of underlying demand, increased again last week. Housing data has clearly bottomed. And as Gerard noted last week, personal consumption growth is running 2-2.5% and “For the Fed, 2% trend real PCE growth looks a bit too high. This argues forcefully that the nearby option for the Fed is to tighten, not ease, beyond July, although September should be a pause. And with less force it suggests a rate cut by the end of this year or very early next year is unlikely. Related, the odds slightly favor financial conditions needing to snug a bit further from here…”
The above has two clear implications. First, nearby recession risk is VERY low. The U.S. is not in a recession today and is increasingly unlikely to fall into one this year. We put 8-12mo out recession odds around 40%. Second, with macro influence still very high and implied volatility very low, which has allowed PEs to expand significantly, uncertainty around the outlook for financial conditions will make further market level gains harder to come by. Internal dispersion remains a better place to look for gains.
Global macro and fundamental trends help set expectations around what internals are likely to lead. Meaningful economic stimulus out of China remains a low-probability event. Economic activity in Europe is hampered by still high inflation. U.S. consumer demand remains strong, but growth is limited to a level that keeps inflation from firming. Too much growth would lead to the tightening of conditions.
That backdrop means Cyclicals are still more attractive than Defensives, BUT Deep Cyclical leadership is less likely near term. Valuations and earnings sentiment trends within Deep Cyclicals mean the group is still attractive longer term, but a clear path toward lower inflation and better real growth is needed for sustained Deep Cyclical leadership.
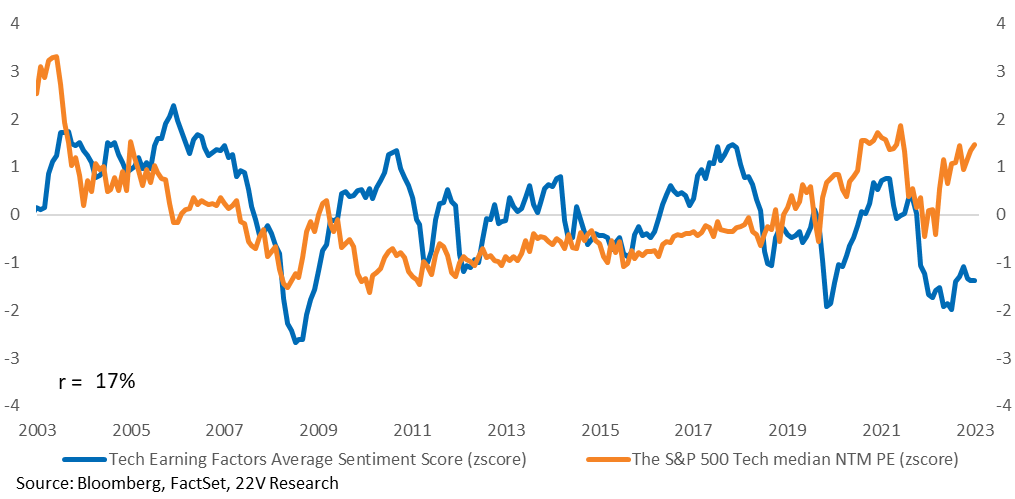
The widening spread between Tech valuations and earnings sentiment trends suggests the sector is at risk as mega caps within Tech report EPS next week. Tech is attractive longer term given its high-quality growth characteristics, so we would not short the space. But the potential for weak earnings/guidance from mega caps is another reason to favor the average stock over large caps. That is especially true during reporting season.
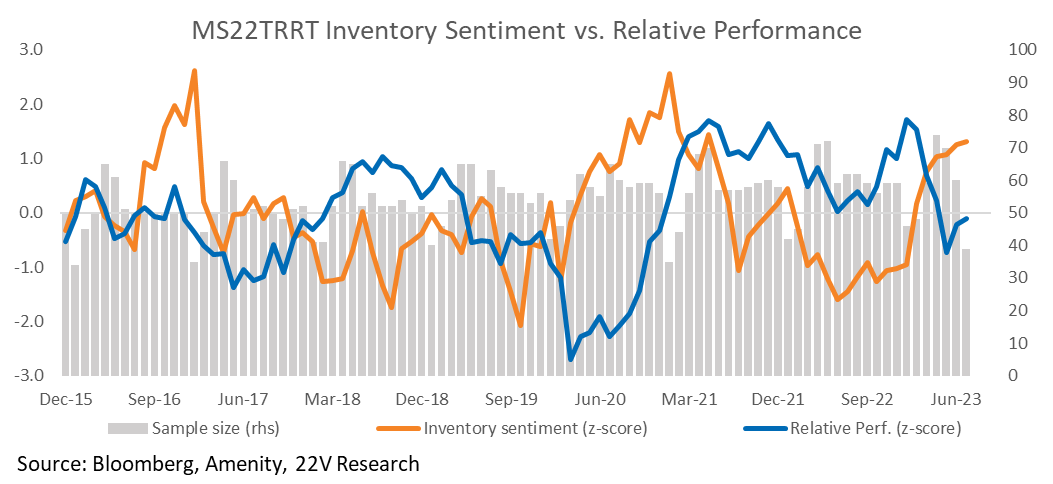
As Gerard mentioned on Tuesday, real Personal Consumption Expenditure Growth (PCE) growth looks to be too strong for the Fed (HERE). Bottom line, the conditions are still in place for the destocking reversal trade – the group is relatively inexpensive, inventory sentiment (we measure this using the Amenity Natural Language Processing tool) has outpaced equity performance, and economic expectations were poor – but this is an idiosyncratic trade, not a long-term theme.
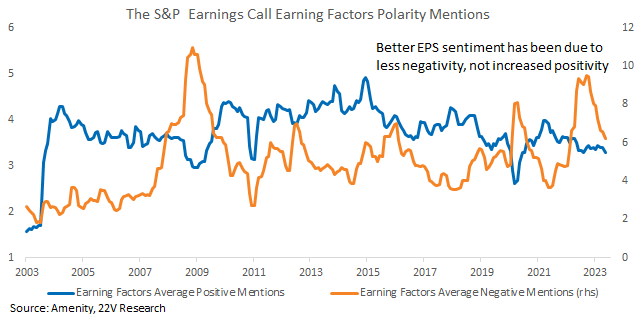
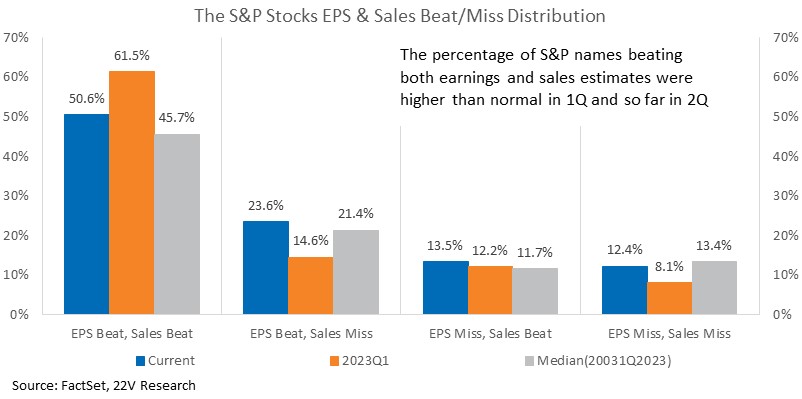
It is early on in reporting, but 2Q EPS trends and sentiment backup a cautious stance toward markets. more names than normal have beat both earnings and sales estimates and fewer than normal have missed sales and EPS. At the same time, earnings sentiment has weakened a bit, due to decreasing positive comments by company management. Margin sentiment has declined some as well. Companies are beating very negative expectations with less negative numbers.
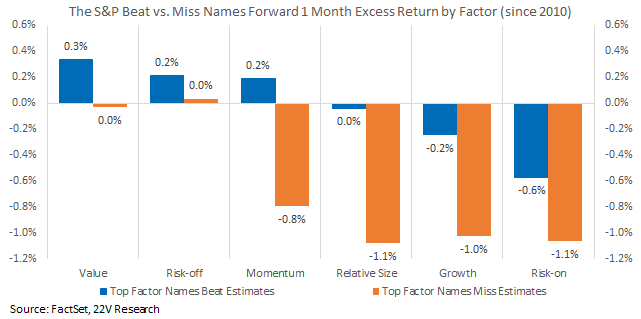
In factor terms, Value, Risk-off, and Momentum stocks that beat estimates tend to hold on to those gains. Risk-on and to a lesser extent Growth and large caps, tend to see negative returns to misses AND beats longer term. We continue to stress the importance of avoiding misses over searching for beats. That is generally a good rule and is even more important in a backdrop of weak earnings and uncertainty over the economic outlook.
Charts & Commentary below…
Recession Risk by the Numbers: One of the most interest rate sensitive sectors, housing (NAHB was higher MoM last week), has already stabilized and is a support for GDP growth (mechanically, given the massive housing drag last year). If the breadth of data in the most interest rate sector is improving, it is tough to depend on lagged impacts from tightening to justify bearish views.
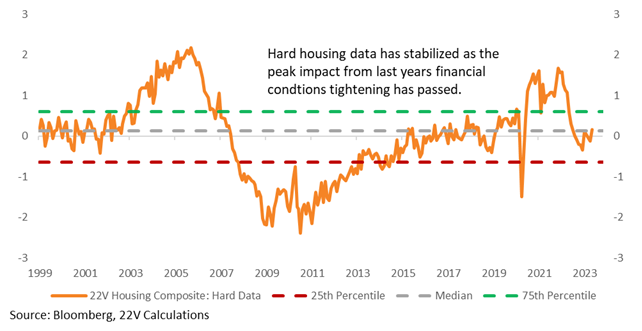
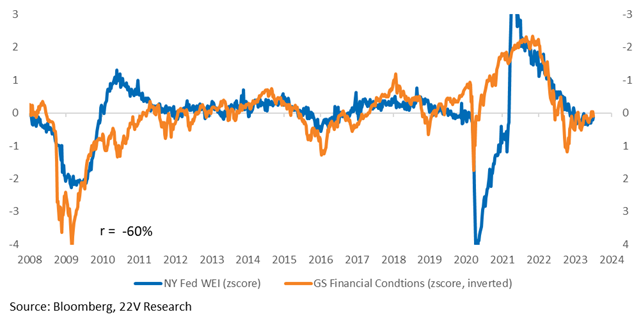
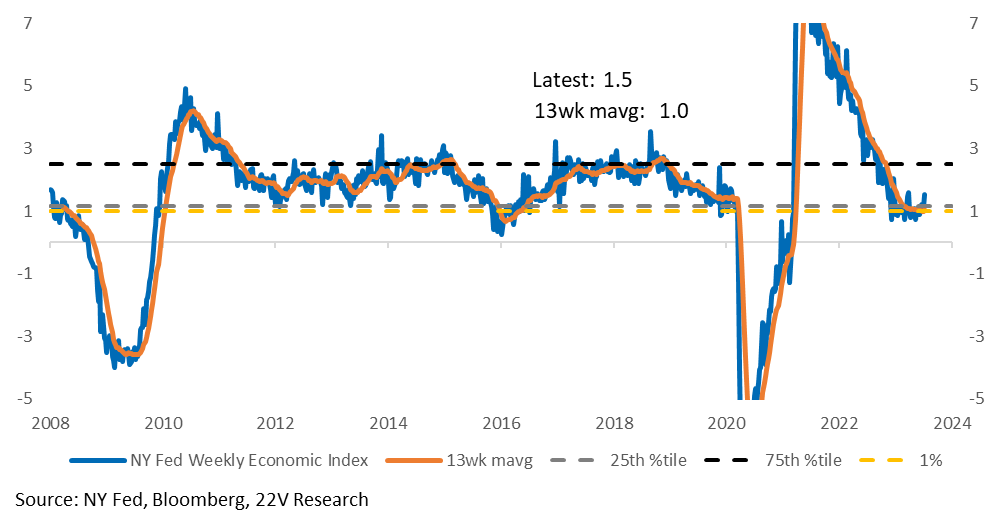
The recession question (we put 40% odds of a recession 8-12 months out) is about what the Fed might have to do going forward (tighten financial conditions if wages stay at too high and demand growth reaccelerates). It is not about the lagged impact of policy tightening. The current level of financial conditions suggests economic growth (we use the New York Fed Weekly economic index below vs FCI) should be stable around current levels.
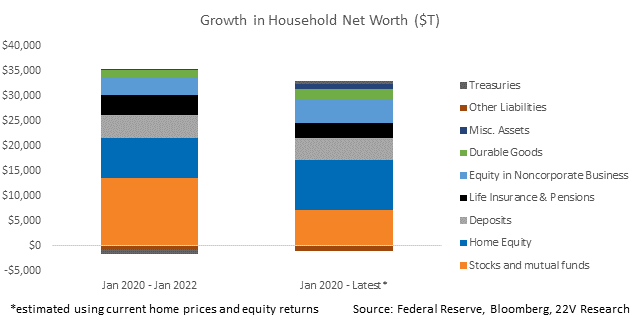
The real labor income proxy = real wages * hours worked * number of jobs, currently growing above 2% thanks to job growth and now fading inflation (HERE). Household net worth is still up ~$35T since pre-covid, despite a hit to equities during the bear market. Both economy-wide metrics suggest the consumer is okay. Maybe too okay.
As Gerard noted last week, personal consumption growth is running 2-2.5%, and “For the Fed, 2% trend real PCE growth looks a bit too high. This argues forcefully that the nearby option for the Fed is to tighten, not ease, beyond July, although September should be a pause. And with less force it suggests a rate cut by the end of this year or very early next year is unlikely. Related, the odds slightly favor financial conditions needing to snug a bit further from here, particularly what seems like a recent ease, if I am simulating that new Fed metric correctly. (Still trying to get the kinks out there.)”
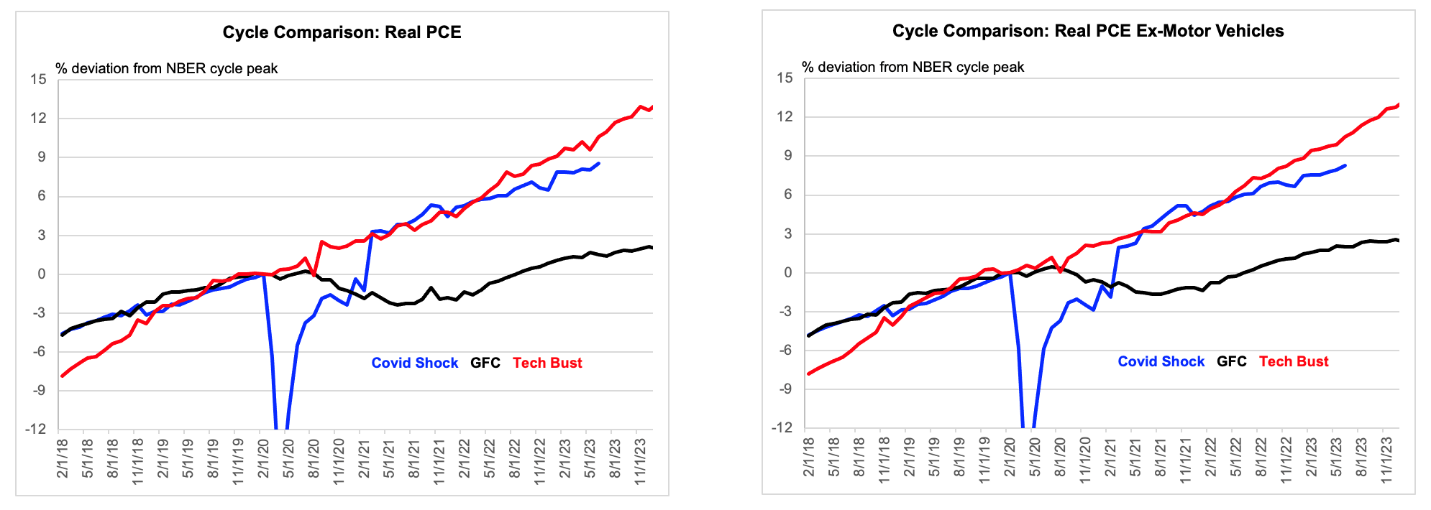
Source: BEA, NBER, FH calculations and estimates
Data are chained, actual to May, and estimated for June.
The New York Fed Weekly Economic Index (WEI), our favorite high frequency indicator of underlying demand, increased again last week. That has helped spark a hawkish theme where improving economic growth will lead to tighter financial conditions and broad market weakness.
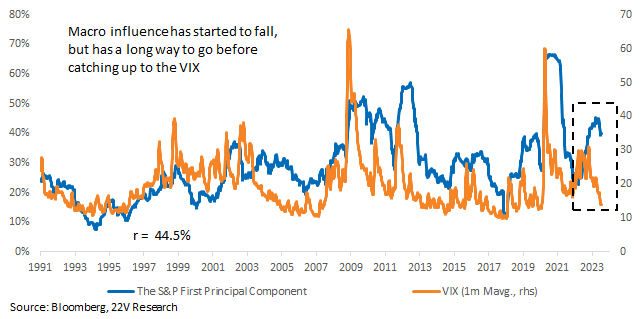
Macro influence remains high and implied volatility very low (closed Friday at 13.6), so a market pullback is a risk IF financial conditions tighten meaningfully. That is not our base case and recent disinflation gives the Fed more room to be cautious on tightening financial conditions, but increased risk of further financial condition tightening is enough to retrain headline gains.
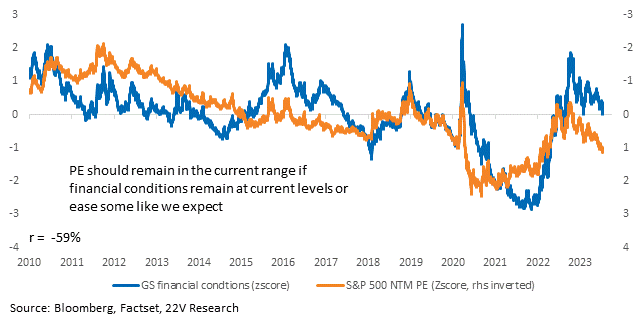
Internals Still Offer More Opportunity than Market Direction: Market valuations are driven by changes in financial conditions or volatility more than anything else on a short-term basis. That is why leaning on valuation mean reversion, at the market level, is REALLY DIFFICULT. Internals offer more and easier places to look for divergences.
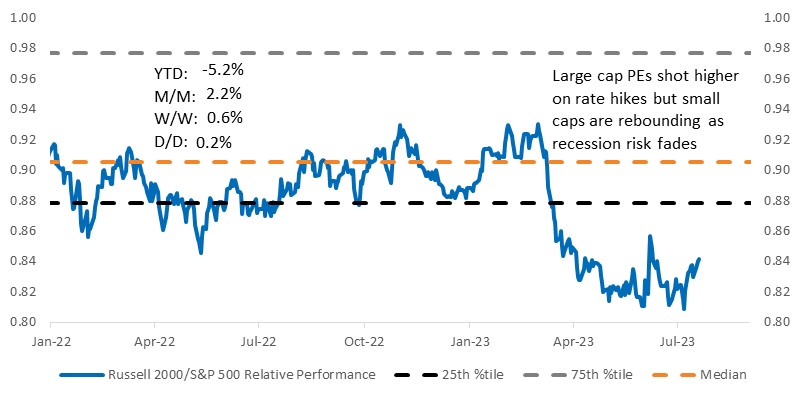
Tech PEs have taken off while earnings sentiment has deteriorated. We wouldn’t short Tech; we prefer the sector on a longer-term outlook because it is Quality Growth in an economic backdrop of below-trend demand growth coupled with strong idiosyncratic themes (idio is a focus now that correlations are breaking down, more HERE). But earnings may be a near-term headwind and we continue to favor the average stock over mega caps. Recently, small caps have been outperforming.
Broad economic data, management sentiment, and profitability trends over the past few quarters all suggest the economy has absorbed rate hikes without collapsing. Recession risk remains elevated but is 1) lower than it was a few quarters ago, and 2) deep recession risk is MUCH lower. Expect the average stock, risk-on factors, and Cyclicals to continue to lead unless inflation remains too high (causing the Fed to re-tighten financial conditions).
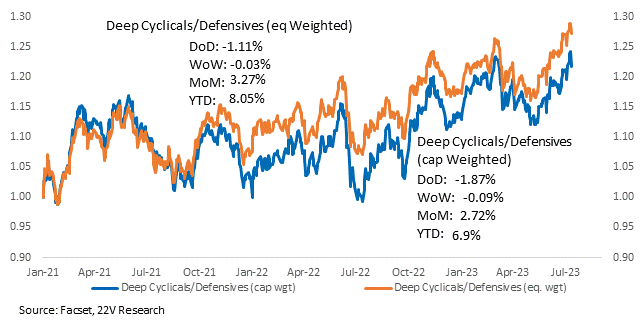
We no longer favor Deep Cyclicals. It was a good month for Deep Cyclicals, but as we noted in last week (HERE), lower US inflation and Weak China data make being in deep Cyclicals (Energy, Materials, Industrials) vs. Early Cyclicals (Tech, Discretionary, Communications) tougher. 22V’s China Research head, Michael Hirson, said we should expect only modestly increased stimulus post the weak China data. To be clear, WE ARE NOT SUGGESTING going short Deep Cyclicals vs Early Cyclicals. They are both likely to work vs Defensives.
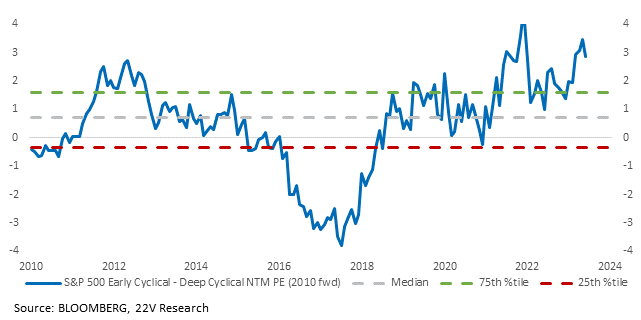
Deep Cyclicals still trade at a deep discount to Early Cyclicals, so we will be looking for opportunities to go long Deep Cyclicals in the future. Valuation is a condition NOT a timing tool. Given the extreme PE spread between Early and Deep Cyclicals, another round of data that lowers tail risk would be enough to push Deep Cyclicals higher. A clear path toward lower inflation and firming growth will likely be needed to close the gap entirely.
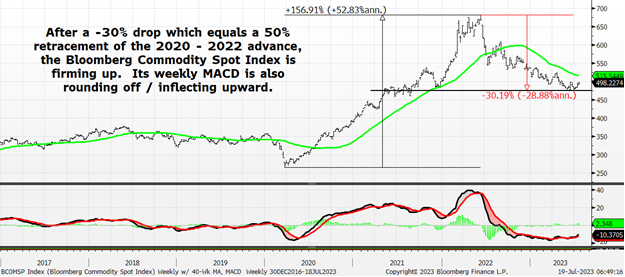
The CRB RIND commodity index, which declined 30% from its peak, is up +2.6% since the end of May. That –30% decline is a 50% retracement of its 2020-2022 advance. John Roque thinks the RIND might be at an inflation point. The technical action in the CRB RIND is interesting, to us, in the context of VERY WELL KNOWN China headwinds. An improving NY fed weekly economic index has generally been associated with a higher CRB RIND.
As Gerard mentioned on Tuesday, real Personal Consumption Expenditure Growth (PCE) growth looks to be tracking in the 2-2.5% range (HERE). Bottom line, the conditions are still in place for the destocking reversal trade – the group is relatively inexpensive, inventory sentiment (we measure this using the Amenity Natural Language Processing tool) has outpaced equity performance, and economic expectations were poor – but this is an idiosyncratic trade, not a long-term theme.
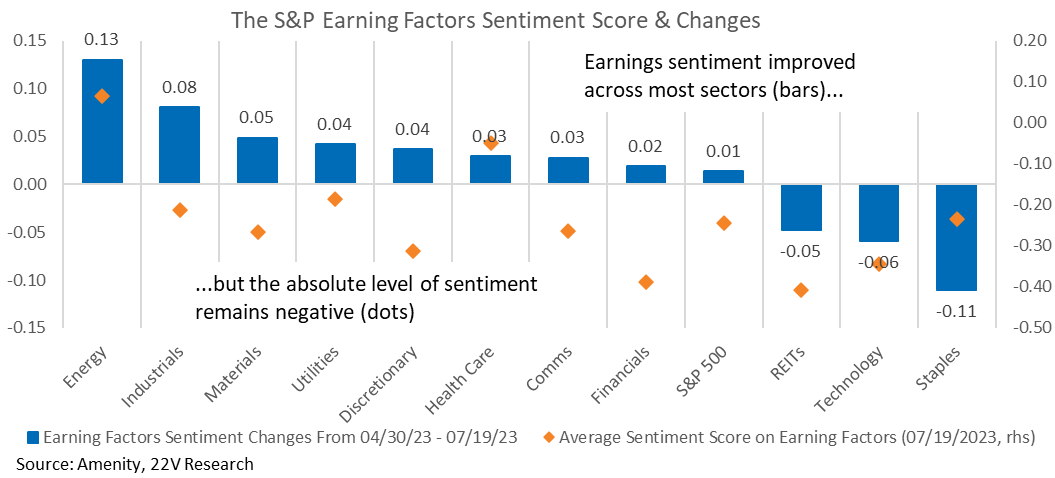
Health Care (the entire sector) has the second-highest earnings sentiment score. Discretionary earnings sentiment is much worse on an absolute level, but has improved, which is the narrative the market has seemed to embrace as recession expectations are again pushed out. Tech’s sentiment has gotten worse q/q.
Earnings Season Update – Broad Beats and Signs of a Still Strong Consumer: Compared to the start of the earnings season (report HERE), negative earnings commentary from managers has continued to fall. Positive comments about earnings have fallen some as well. That is an important point. The first burst of improving net sentiment was a function of declining negativity. The modest decline in positive mentions early in reporting and the stable level in 1Q is a reminder that earnings are weak on an absolute basis. Companies are beating very negative expectations with less negative numbers.
So far in 2Q reporting, more names than normal have beat both earnings and sales estimates and fewer than normal have missed on sales and EPS. For reference, at the end of 1Q reporting, more than 61% of names beat sales AND EPS estimates.
Historically, earnings drift varies across factors. Value, Risk-off, and Momentum stocks that beat estimates tend to hold on to those gains. Risk-on and to a lesser extent Growth and large caps, tend to see negative returns to misses AND beats longer term. These are aggregate returns. Individual names that beat can and do gain over extended periods. The point we are making is that identifying earnings beats tends to be less rewarding than avoiding misses.
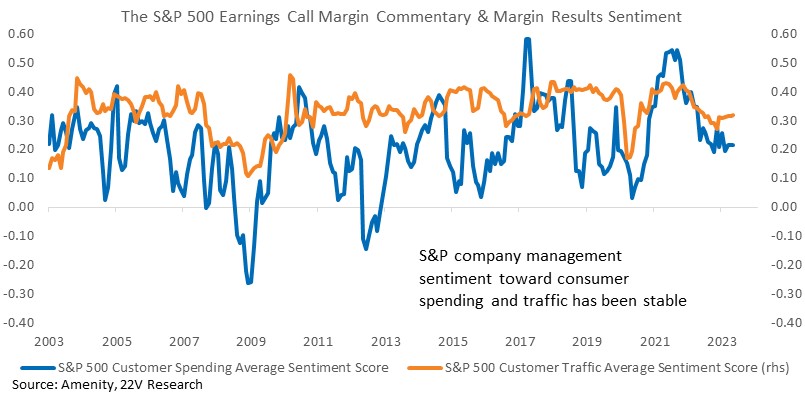
Conflicting anecdotal evidence (which we will get throughout EPS season) is why we rely on aggregated and objective sentiment metrics. Management sentiment toward consumer traffic and spending, measured using the Amenity natural language processor, is well off its 2022 high but has been stable for the past few quarters. That reading is consistent with the still healthy level of consumer spending, low unemployment, earnings, etc.
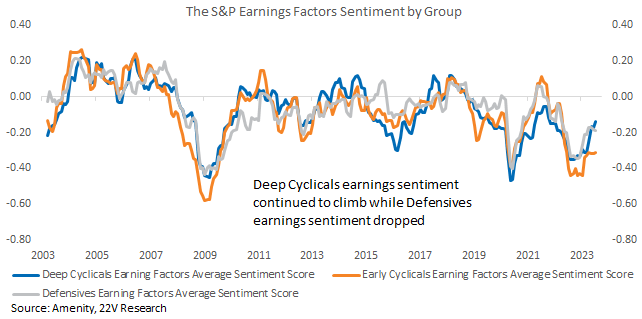
Breaking sentiment down by groups, earnings sentiment for Deep Cyclicals has increased the most since last quarter, which is in sharp contrast to their negative growth revisions highlighted earlier. Sentiment for Defensives has dropped since May, aligning with their recent underperformance, acting as a drag on overall index sentiment. Early Cyclicals sentiment remains relatively flat, up slightly from last quarter. Firming economic growth and lower recession risk favors Cyclicals in general over Defensives and sentiment trends back up that trend.