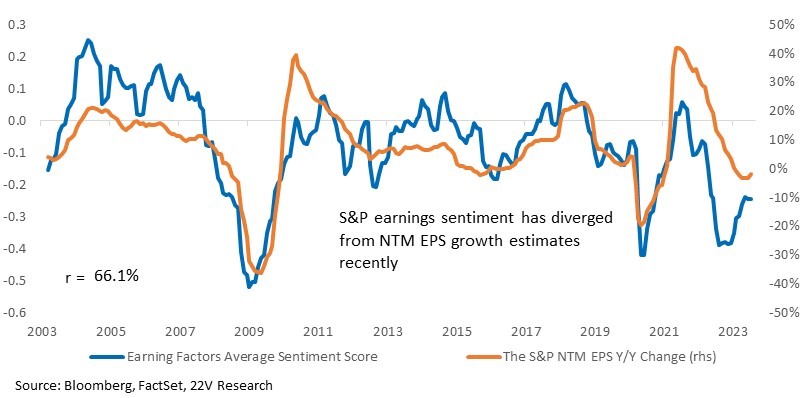
This Friday, major banks will kick off the acceleration of 2Q earnings reporting season. 2Q earnings revision have been trending lower than normal into the start of reporting. At the same time, NTM earnings expectations continue to rebound from their recent low. Lower than normal revisions in a backdrop of generally firming growth, increasing the odds of a high beat rate in 2Q.
The recovery of earnings sentiment expressed by the management during 1Q earnings calls improved early on in reporting but stalled as reporting closed. into June. How sentiment evolves during 2Q reporting will be an important signal about the expected path of NTM revisions. So far, NTM EPS y/y changes have diverged from earnings sentiment changes into July, moving higher even as sentiment stalls. Given the positive correlation between them, forward convergence is likely, but sentiment leads, so the direction of that convergence remains uncertain.
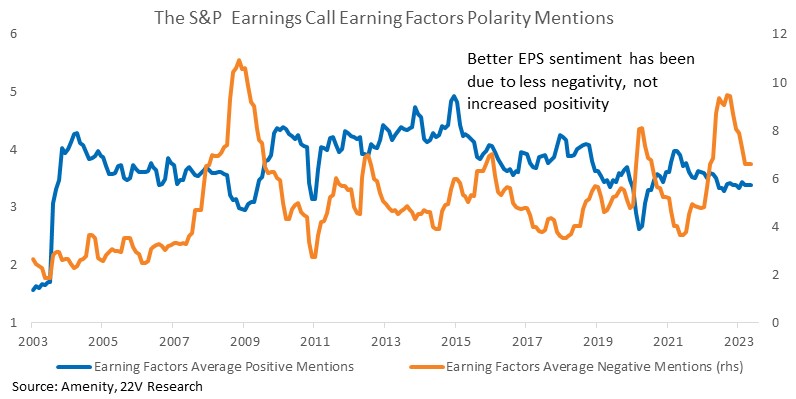
It is important to keep in mind what has driven the improvement in earnings sentiment. Net sentiment (pos-neg/pos+neg+1) collapsed in 2022 because negativity increased. Management is NOT becoming bullish on the earnings outlook and the level of positive sentiment is still low. EPS growth is and will remain slow but management sees less risk of a large earnings drawdown.
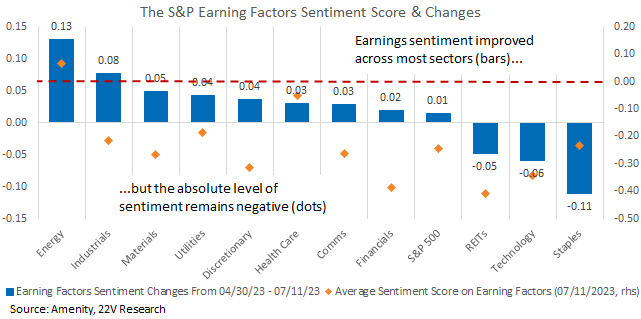
At the sector level, the earnings sentiment of Deep Cyclicals improved the most since the end of 1Q reporting at the expense of Staples, Tech, and REITs. Absolute earnings sentiment remains net negative for almost all sectors with the exception of Energy. Deep Cyclicals have been rebounding and sentiment trends suggest that trend will remain in place near-term
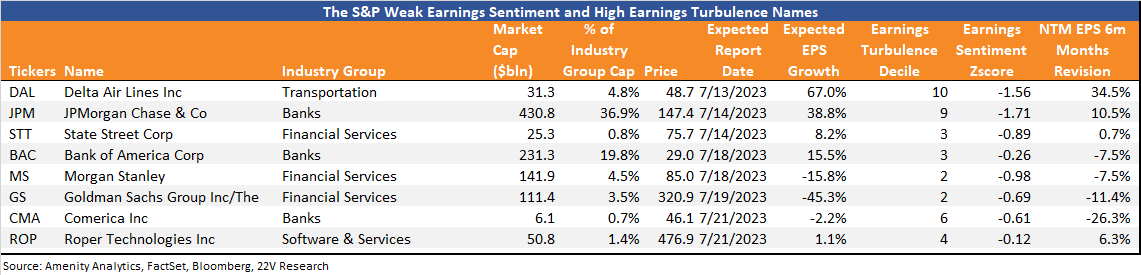
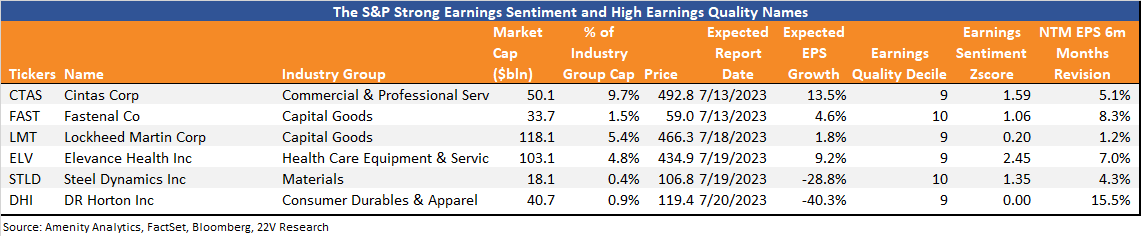
At the end of this report we highlight the names reporting through the end of next week that fall into our long and short reporting season baskets. The long side contains stocks with high quality scores and positive earnings sentiment. The short side are those with higher earnings risk and negative sentiment. As usual, we will be updating these baskets throughout earnings season. Or a complete ranking, please ask us.
Sentiment into 2Q Points to Another Good Earning Season: This Friday, major banks will kick off the acceleration of 2Q earnings reporting season. As mentioned in a Strategy report this week (HERE), 2Q earnings revision has been trending lower ahead of the earnings season, even as investors are expecting lower odds of recession risk. Revisions into reporting are almost always negative, but the degree has been larger than normal into 2Q. At the same time, NTM earnings expectations continue to rebound from their recent low, consistent with the general improvement in economic activity and sentiment. Lower revision ahead of earnings season sets a lower bar for earnings in a backdrop of generally firming growth, increasing the odds of a higher than normal beat rate this season.
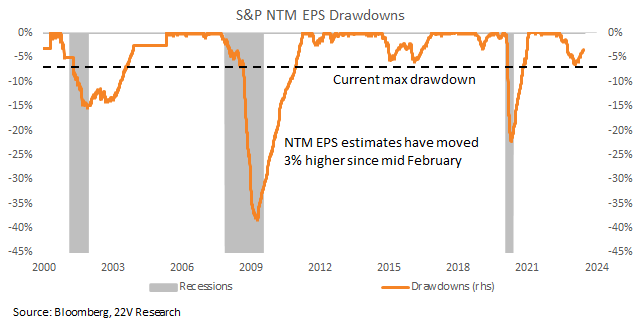
The recovery of earnings sentiment expressed by the management during 1Q earnings calls improved early on in reporting but stalled as reporting closed. into June. How sentiment evolves during 2Q reporting will be an important signal about the expected path of NTM revisions. So far, NTM EPS y/y changes have diverged from earnings sentiment changes into July, moving higher even as sentiment stalls. Given the positive correlation between them, forward convergence is likely, but sentiment leads, so the direction of that convergence remains uncertain.
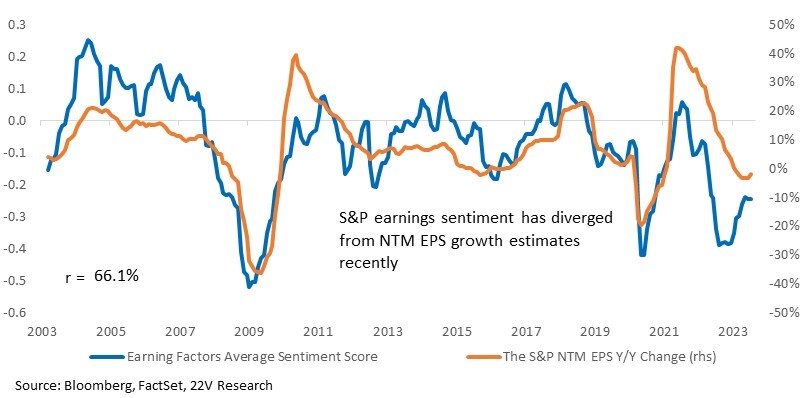
It is important to keep in mind what has driven the improvement in earnings sentiment. Net sentiment (pos-neg/pos+neg+1) collapsed in 2022 because negativity increased. Positive comments about earnings were stable. The improvement in sentiment since early 2023 has been a result of reduced negativity. Management is NOT becoming bullish on the earnings outlook and the level of positive sentiment is still low relative to the past 20 years. But as with the overall economy, left tail risk has been reduced. EPS growth is and will remain slow but management sees les risk of a large earnings drawdown.
At the sector level, the earnings sentiment of Deep Cyclicals improved the most since the end of 1Q reporting at the expense of Staples, Tech, and REITs. Absolute earnings sentiment remains net negative for almost all sectors with the exception of Energy. Deep Cyclicals have been rebounding and sentiment trends suggest that trend will remain in place near-term.
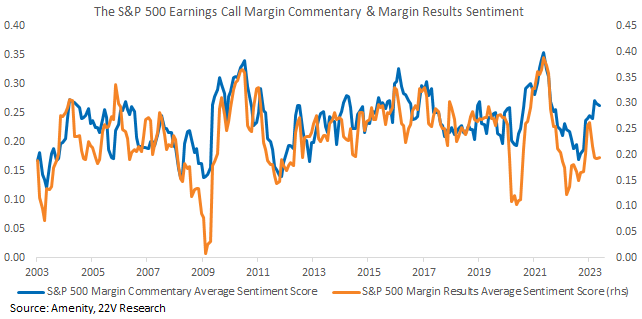
Margin sentiment also stalled since June. Currently, forward looking margin sentiment/margin commentary remains around its 75th %tile, while sentiment towards actual margin has fallen to its 25th %tile, leaving an unusually wide divergence between the two. Management is growing less concerned about medium/longer-term profitability, but are still concerned about near-term margins. Index margins expanded modestly in 1Q, which was a surprise, but that should not be extrapolated out. Profitability will remain under pressure.
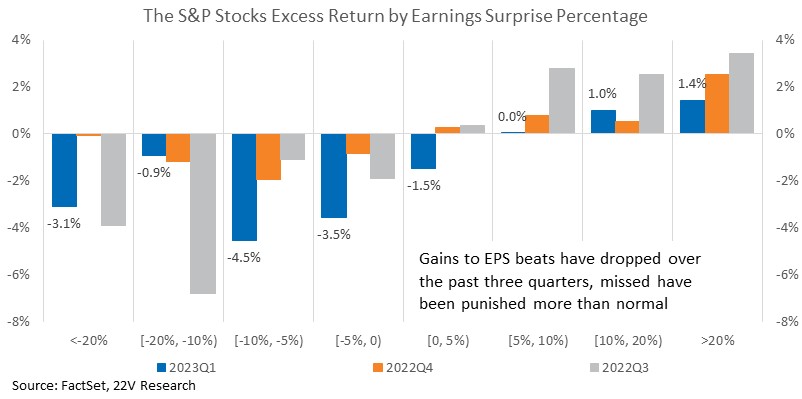
Higher Beat Rates & Importance of Avoiding Misses: Over the past three quarters, the percentage of companies beating estimate has been trending higher, and the beat rate accelerated in 1Q. Rewards to earnings beats have declined at the same time, and the declines of companies that miss earnings have been trending higher. As we expect more beats than normal again this quarter, the focus should be on minimizing misses rather than trying to find beats.
Filtering for high Quality of Earnings names with positive earnings sentiment has been an effective way to sperate likely EPS beats from misses. The percentage of beats within that basket was 5pp higher than that of the overall S&P, and 13% higher in 1Q. 92% of the names in the basket beat estimate. On the misses side, high Earnings Turbulence names with negative earnings sentiment scores posted lower beat percentages for most earnings seasons. The percentage of earnings beats within that basket was -11pp lower than the overall S&P in 1Q.
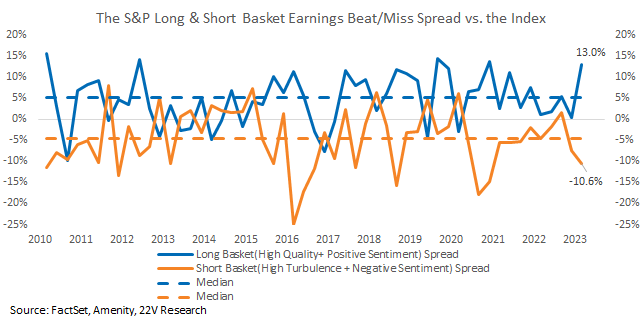
75 S&P names are going to report their earnings this and next week. The names falling in the long basket, which have both top quintile Quality of Earnings and positive sentiment score, publishing through the end of next week are listed below.
The short basket of names publishing this and next week is made up of names with high Earnings Turbulence (risk) and negative earnings sentiment scores. Those names are listed below.