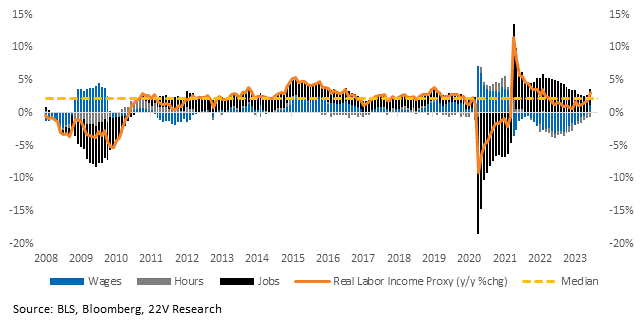
Weekly: Starting our Weekly report with the same line, last week’s data confirmed that 1) a recession is not near, and 2) the risk of the economy slipping into recession in the next three months has declined further. The biggest risk to the no-recession call has been inflation staying too high and forcing the Fed to tighten Financial Conditions further. Inflation risk declined last week and here is what JPM said about the economy. The “US economy continues to be resilient. Consumer balance sheet remains healthy.” That is consistent with macro data, like the increase of the real labor income proxy in the most recent employment data.
Inflation Implications: As Gerard noted in our Weekly Webinar (HERE), “Inflation is not the only factor in the macro-outlook, but it is arguably the most important one. And the steep deceleration of goods and services price inflation in the past few – and especially the past couple – months gives the Fed a bit more luxury to pay attention to both sides of the mandate (full employment and inflation). Whereas they have recently been focused exclusively on risk managing away from inflation, now they can start to pay more attention to avoiding recession. So, I take down my odds of recession beyond the very short term (12 months forward) from slightly below even to 40%. I hope you will forgive that false precision. The odds of the economy dipping into recession in the very short term have been very low and remain so. For the Fed, they will raise rates on July 28, in part because they expressed a clear preference for doing that at the last FOMC meeting. But they should be very inclined to pause – not just skip, pause – at the September meeting. More to the point, they will signal this at the July meeting. In May, they telegraphed that the likely skip in June would be followed by a hike. In contrast, the pause in July will not be followed by a similar signal about September.”
If Gerard is correct, and he has been right, financial conditions should remain stable or ease a bit. That typically favors risk-on factors, small caps, and Cyclicals relative to Defensives. We remain long risk-on factors. It will be difficult to be short Momentum factors or Growth as the Fed backs off. That gives us less conviction on Deep Cyclicals (Energy, Materials, Industrials) vs Early Cyclicals (Tech, Discretionary, Communications). WE ARE NOT SUGGESTING going short Deep Cyclicals vs Early Cyclicals. They are both likely to work vs Defensives. It is just tougher to be long Deep and short Early.
Wages could end up staying too high and be a problem (keeping inflation too high), but that is likely a 4Q issue if it becomes one (see charts below).
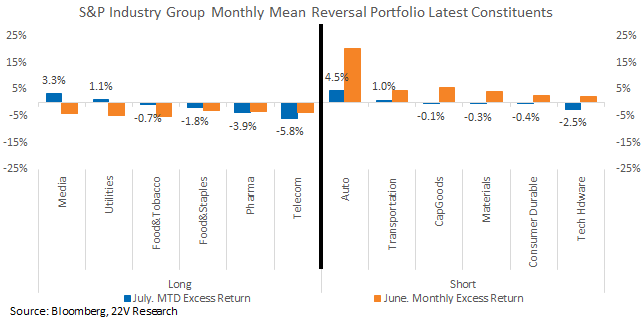
Mean Reversion Update – Mean Reversion Should Start to Fade: Industry group means reversion has been intense over the past year as the economy has remained in a “Transition” phase (HERE). Transition phases are prone to higher correlations and mean reversion. Something we have pointed out consistently to help investors navigate mean reversion from a risk management standpoint. In short, whatever has led the previous month has tended to reverse. So, why are we still recommending risk-on factors and industry groups? In short, from a quantitative point of view, the data and market backdrop is getting closer to “normal” and further away from “recession”. It looks increasingly likely that we will move from transition to normal. If that is the case, mean reversion should be less intense. We are not officially out of a Transition backdrop, and the path out is likely to take some time, so mean reversion could still have some influence (see last Thursday and Friday market internals, which were risk-off across the board).
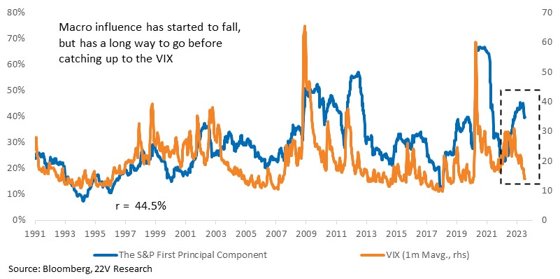
Also, over the past few quarters, the VIX has fallen rapidly while macro vol/influence has remained high. That spread is narrowing now, which suggests less mean reversion.
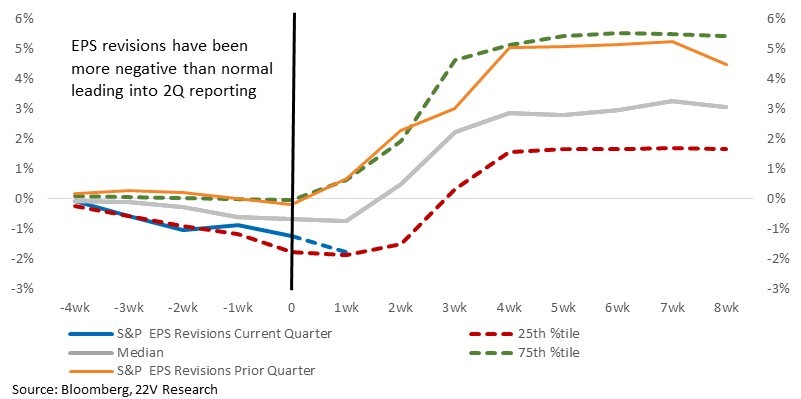
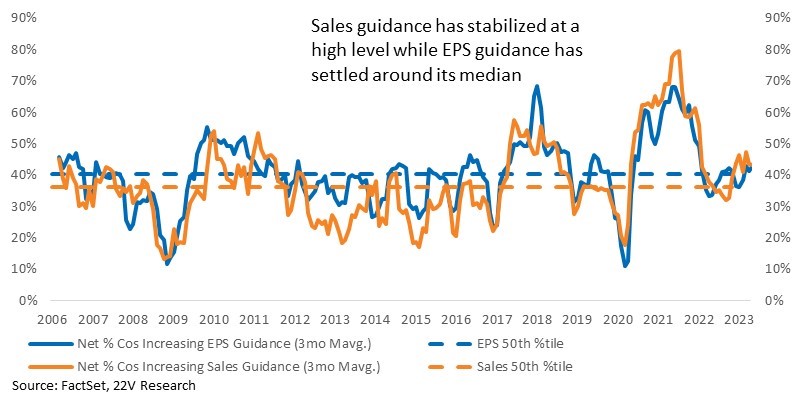
Earnings Prep: Leading into 2Q reporting, estimates have been revised down more than normal, but still within the typical range of revisions. When estimates are low but not extreme, revisions tend to end the season 1) modestly higher, and 2) positive. Specifically, historical revisions suggest EPS will end +2.5% from here ($54, $215 a.r.). Guidance has NOT tracked the decline in revisions. Like overall sentiment, net positive corporate guidance has stabilized, at 1) a high level for sales and 2) the median level for EPS.
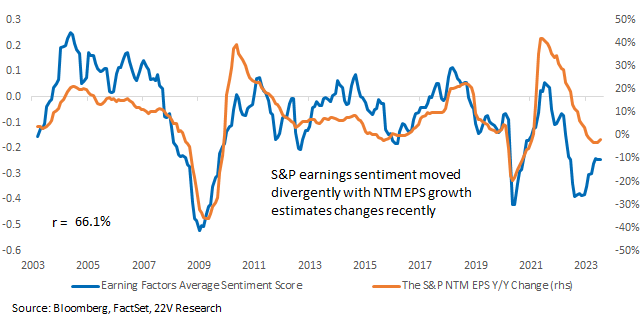
Major Earnings Question: NTM EPS y/y changes have diverged from earnings sentiment changes into July, moving higher even as sentiment stalls. Given the positive correlation between them, we expect the two to converge. The longer-term question is how.
Charts & Commentary below, that back up the comments made above…
Wages & Payroll: “Inflation is not the only factor in the macro outlook, but it is arguably the most important one. And the steep deceleration of goods and services price inflation in the past few – and especially couple – months gives the Fed a bit more luxury to pay attention to both sides of the mandate (full employment and inflation). Whereas they have recently been focused exclusively on risk management away from inflation, now they can start to pay more attention to avoiding recession.”
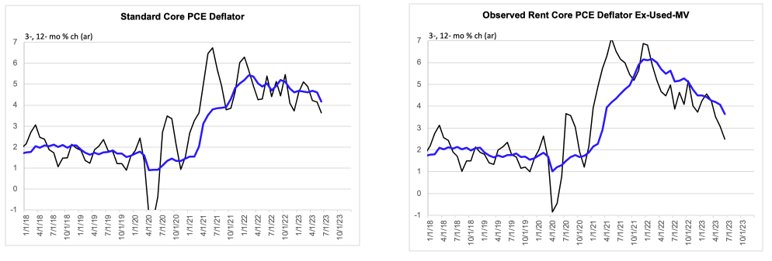
Source: BAE, 22V Research
Per JPM on the US economy: “US economy continues to be resilient. Consumer balance sheet remains healthy.” This is consistent with the macro data, like the increase of the real labor income proxy (below). Recession risk has been pushed out.”
The Atlanta Fed wage growth tracker 1) does not have some of the issues that AHE does (sector and rank mix shift) and 2) tracks the ECI better, which is the wage growth metric the Fed watches, but is quarterly. The Atlanta Fed wage growth tracker printed on the softer side for June, falling from 6.4% to 6.1%. That’s a positive for risk short-term, but as Gerard pointed out (HERE), nominal wage growth is still 5%+. Moderating at 5%+ is not low enough to get inflation back to 2%. The labor market is probably still too tight. It would be a problem for risk assets later this year if wages stayed around current levels. CPI would stay at too high of a level.
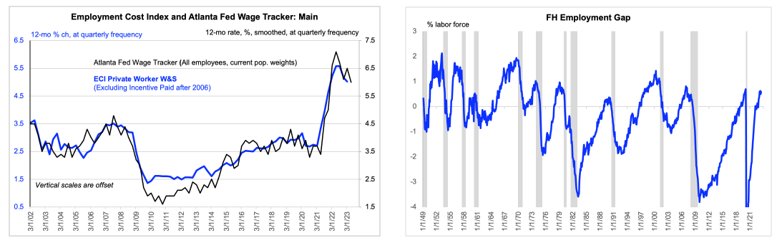
Source: Atlanta Fed, 22V Research
Mean Reversion: It is important to note for risk management that the economy is still in Transition, economic data is still volatile, and so mean reversion is still a risk.
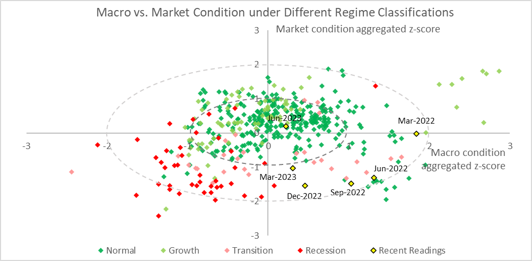
The above being said, the economic “Transition” has lasted since early-’22, the longest in the 40-yr history of our model. Initially, macro data moved to extreme levels (Mar-’22), then market data deteriorated while economic data normalized (Jun-Dec ’23). That was the point where a recession was close to a coin flip. From December to now, market conditions improved. Today, other than a few outliers, markets AND macro are more or less normal. The bottom line is that the economy is FAR from a recession, and markets reflect that. If soft landing odds are higher, the mean reversion should be less intense.
Source: Bloomberg, 22V Research
Macro volatility has been unusually elevated during the rate hiking cycle, and until earlier this year, equity vol was also elevated. Over the past few quarters, the VIX has fallen rapidly while macro vol/influence has remained high. That spread is starting to narrow, but stocks are still susceptible to macro shocks.
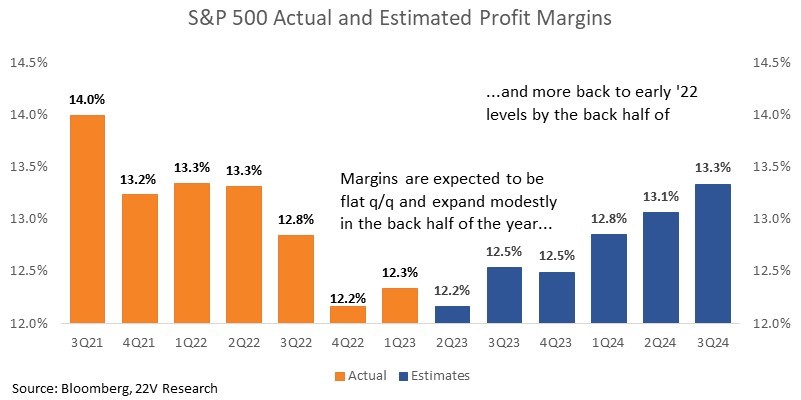
Earnings are the next swing factor. The absolute level of inflation remains high (core CPI 4.8% y/y), which has two implications related to earnings. 1) There is less downside risk to revenue growth and margins this quarter, and 2) because the Fed cannot allow growth to accelerate meaningfully, the medium-term EPS growth trend will remain under pressure. Recent gains in margins/earnings sentiment indicate another quarter of flat to modestly higher margins, likely keeping the risk-on trade intact short-term. However, profitability is expected to accelerate into the end of the year and take off in 2024. There is a growing risk of negative revisions to 2024 estimates, but we have plenty of time to discuss that.
Leading into 2Q reporting, estimates have been revised down more than normal, but still within the typical range of revisions. When estimates are low but not extreme, revisions tend to end the season 1) modestly higher, and 2) positive. Specifically, historical revisions suggest EPS will end +2.5% from here ($54, $215 a.r.).
Guidance has NOT tracked the decline in revisions. Like overall sentiment, net positive corporate guidance has stabilized, at 1) a high level for sales and 2) the median level for EPS.
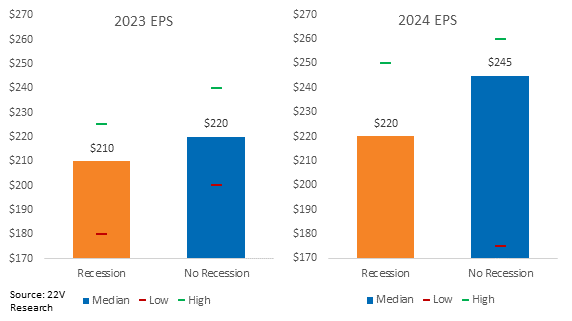
Revisions and guidance are not nearly weak enough to suggest the bottom is going to drop out. A $215 run rate would put 2023 EPS right in the middle of the recession/no recession estimates of the investors we surveyed (HERE). That means there is little tail risk this quarter, which is some support for risk-on. More market data is moving away from a deep recession outcome.
So far, NTM EPS y/y changes have diverged from earnings sentiment changes into July, moving higher even as sentiment stalls. Given the positive correlation between them, we expect the two to converge.
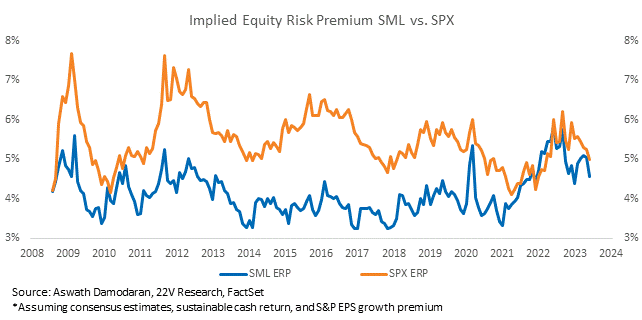
SMALL CAP FAIR VALUE: As we mentioned last week (HERE), we like small caps relative to large caps. Small caps have a more risk-on factor profile and benefit from a more optimistic economic narrative. The Russell has outperformed the S&P by +3.5pp while the yield curve has steepened +19bps over the past week.
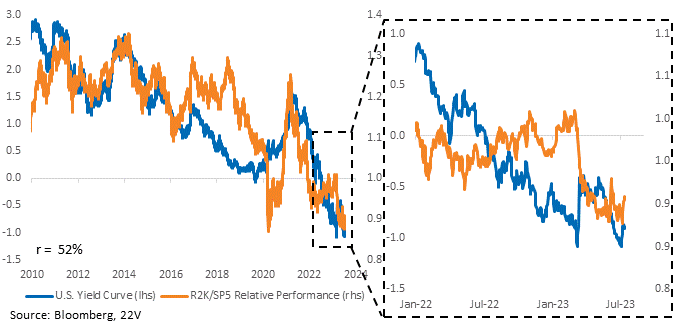
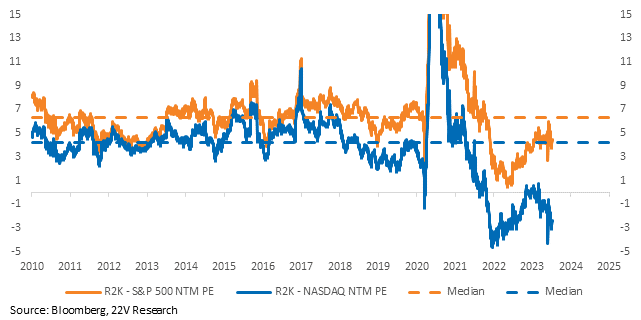
The performance and valuation gap between small and large caps after mega caps outperformed to start 2023 has gotten extreme, something we are wary of in a mean-reverting market. Small caps PEs have recovered some but are still below their medians relative to SPX and NDX. And performance spreads in 2023 had only been outdone by the tech bubble and COVID.
Small caps are attractive on an absolute basis under a no-recession scenario. Applying the same fair value framework to the S&P 600 that we use on the 500, fair value, with no recession, is ~1,300, or about +7% from here. FYI the fair value calculation we use is based on valuation guru Aswath Damodaran’s work (HERE). It’s a cash return model, akin to valuing a single stock with a DCF model. The calc is based on an expected earnings path, risk-free rate (10yr), cash return (historical comp), and equity risk premium (excess return investors are demanding for taking risk). We walk through the assumptions below…
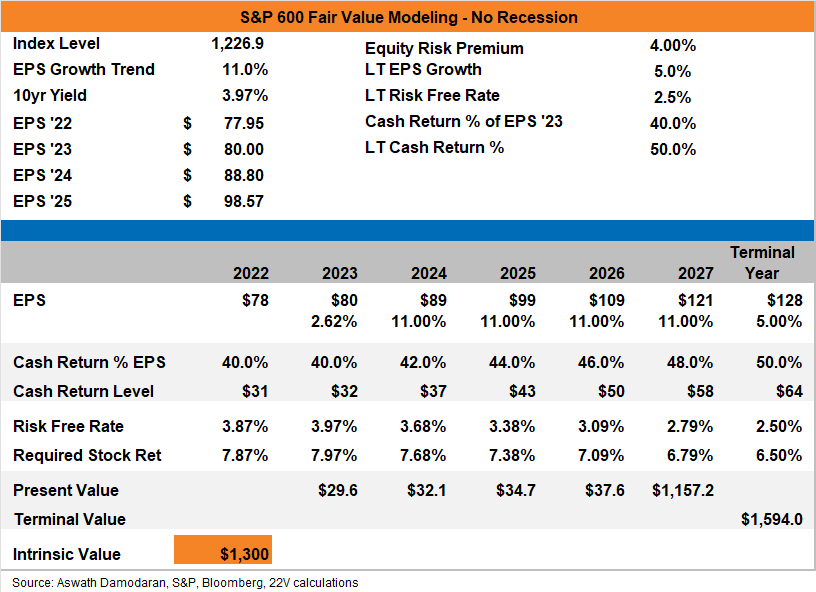
Assumptions:
ERP is the non-recession median.
EPS growth trend is the long-term median.
EPS estimates are consensus this year, trend growth rest of the way.
LT EPS growth falls towards the long-term risk-free rate. Since small cap earnings growth is usually better, we bump long-term eps to 5%.
LT cash return ratio is the long-term median.
Cash return this year is knocked down a bit because economic growth is stable but below trend.
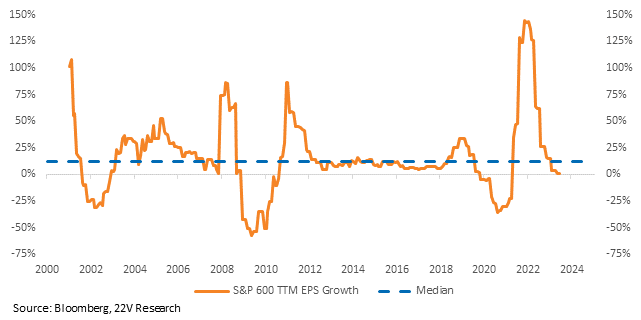
Small-cap earnings are extremely volatile, so we use the median growth rate assuming that that’ll be the result of whatever swing happens. Plus, there isn’t the same base effect to get +100% eps growth as can happen in recoveries.
FYI the ERP for small caps is usually lower than the S&P 500 because small caps return less cash than large caps. So, investors demand a lower cash return yield from small caps relative to the risk-free rate.