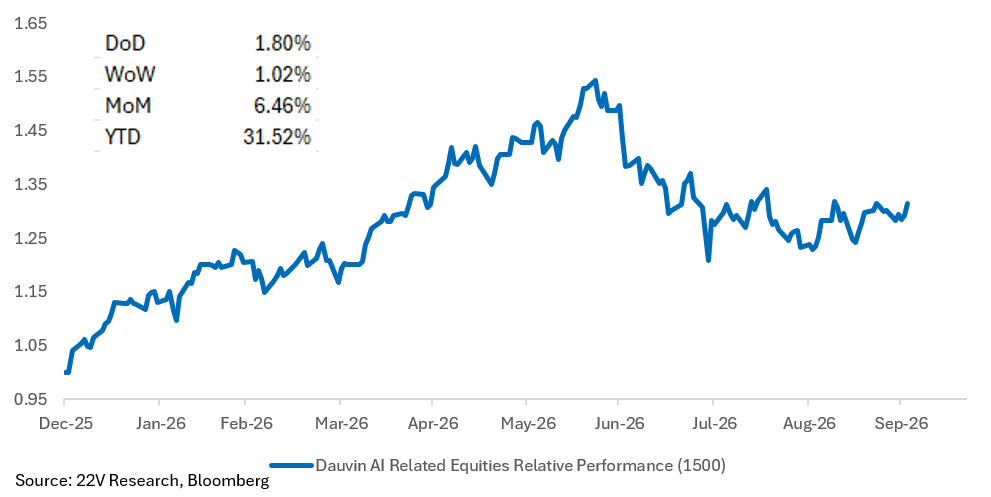
Weekly – The economic speed limit constraint and how that impacts 10yr yields, the Fed’s reaction function, factor performance and overall market trends remain the largest driver of our Strategy calls. This is the focus today. We hope this concept is landing, it is important. The other focus is a specific Call Into 3Q26 EPS Season. 22V Data & Infrastructure analyst Dauvin has curated list of 91 companies with significant exposure to AI capex (the breadth of these companies benefits from strong AI demand), grouped into 12 segments (HERE). These are names that have seen significant multiple compression since mid-year and in many cases rising earnings estimates. The Strategy team is long this basket now and think the names will outperform relative through 3Q26 EPS season.
The current economic speed limit is roughly ~2% because trend productivity growth is ~2% and the labor force contribution to GDP growth is close to zero (HERE). Economic growth is currently tracking well above the economic speed limit. Stronger activity and labor market data show up through more restrictive Fed path OR higher 10year yields. Not higher equity prices. This is happening, but with some (good) nuance last week.
Economic growth needs to slow for inflation to move back toward the Fed 2% target. The economy is at full employment, inflation is running above target, and the fiscal authority is dumping a ton of demand and “safe” assets into the economy. Last week was a good example of the capital markets figuring out ways to deliver some restraint (higher 10yr yields/USD). The CYCLE was a more important driver of 10yr yields than a few dovish Fed comments and a bit better than expected revision to Core PCE inflation.
Factors Outside the US – A flight to safety in US assets become more of a conversation last week as the French 10yr yield surged. Increasing Energy prices and rates impact the rest of world MUCH more than the U.S., which Gerard has covered this many times (HERE). A large foreign country moving into a stressed scenario would lower US 10yr yields and favor the USD. I.e. overwhelm the cycle for a period. We don’t have a view if that happens on a sustained basis (beyond a day). Just pointing that out.
As it has become obvious over the last two months that economic growth needs to slow, Price Momentum, EPS Momentum, the AI Buildout names, High AI Usage Service Companies (Software) have outperformed. We expect this to continue and like these names into 3Q26 EPS season. These groups are less susceptible to an economic slowdown and have unusually strong EPS growth trends.
Consumer and non-AI demand driven Cyclicals (Materials, Transports, Consumer durables, Industrials), whose earnings are more susceptible to an economic slowdown, have suffered relative. Value and liquidity factors continue to underperform for the same reason.
In short, understanding the speed limit constraint has served us well.
Good Speed Limit News Last Week (and something we can only update quarterly) – The unemployment rate has remained stable despite positive employment growth, and productivity looks likely to be revised up again alongside the GDP revisions (HERE, HERE). That makes a trend GDP outlook of 2.25% more probable than say 1.75%. So, it looks like the economy requires LESS slowing to keep inflation in check (2.25% vs 2%). A higher speed limit FAVORS a broader set of stocks, which is positive for market breadth LONGER TERM.
A higher speed limit helps explain the steepening of the yield curve, stable VIX, and BAA-AAA spreads at historic tights. Along with the more dovish than expected Core PCE revisions, a slightly higher speed limit fits with the Fed hiking 2-3 times, not the 4-5 times priced by the market. Fed Vice Chair Jefferson, NY fed President Williams, and Fed Governor Bowman pushed back on the 4-5 market-based estimate for Fed hikes.
FYI – higher trend GDP would put upward pressure on 10yr yields all things equal. Economic demand, at a time when core inflation is well above the Fed’s target, is a large driver of 10yr yields. See Bloomberg 10yr Decomp model below.
Modeling Approach and The Why Matters – We focus on WHY the 10yr yield moves and how that impacts broader financial conditions and the economy over time. We spend very little time on a particular level of 10yr yields being good or bad. The current 10yr yield is only “bad” or “good” to the extent it leads to a significant decline in economic growth expectations or markets. FYI – investors we surveyed (HERE) think 6% 10yr yield would lead to a market correction.
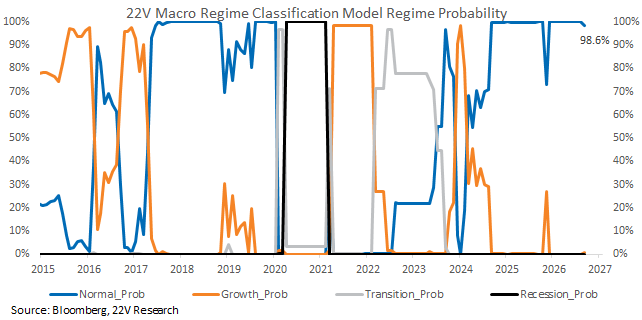
The recent surge in economic growth and improvement in the labor market, relative to expectations, has been the predominant driver of the recent Fed rate hike, future rate hike expectations and the 10yr. Broader financial conditions have tightened and should slow economic growth and inflation going forward. Our Macro Regime Classification (MRC) model (HERE) continues to indicate a stable Normal expansion. This regime has persisted for more than 2.5 years, with its probability changing only marginally despite surging yields and market volatility.
Marking To Market Some Data Trends – The sum of Personal Consumption Expenditures and fixed investment 2-quarter growth rate was revised from 2.8% to 3.2% last week. The revision itself is not such a big deal. What is striking is the absolute value. Near or above 3% is quite strong, especially if you think the non-core elements of GDP are just noise that will mean revert inevitably. Growth continues to surprise investors to the upside and this helped drive 10yr yields HIGHER on the week.
Despite the weakness in wage growth from the payroll report, the labor income proxy, which includes average weekly hours, stayed in the 4.2% nominal range. There is enough labor income growth to keep the outlook for real personal consumption expenditure growth solid. The point being, the dovish wage portion of the payroll report was not enough to change the spending outlook. Also, the increase in the employment to population ratio (labor participation increasing) is typically an economic growth positive indicator. And the household survey of employment came in at +406k. An 82nd %tile reading going back to 1990. The payroll report was growth positive is the bottom line. That explains the steeper yield curve on day.
Gerard puts the underlying LONGER term trend in real personal consumption expenditure growth at about 2%, by eyeballing a trend line through the level of ex-auto real personal consumption expenditure growth. The speed limit would become much less of a binding constraint if real spending growth headed toward 2%. Our benign slowdown call essentially rests on the current level of financial conditions driving a further deterioration of housing and auto data and some downshift in consumer and corporate spending behavior. We are not going to get a slowdown from the investment side (AI capex), it needs to happen on the consumer side.
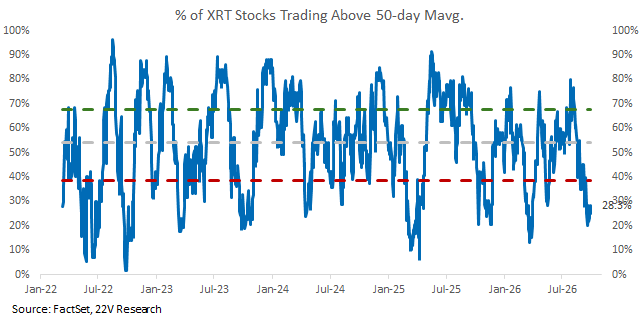
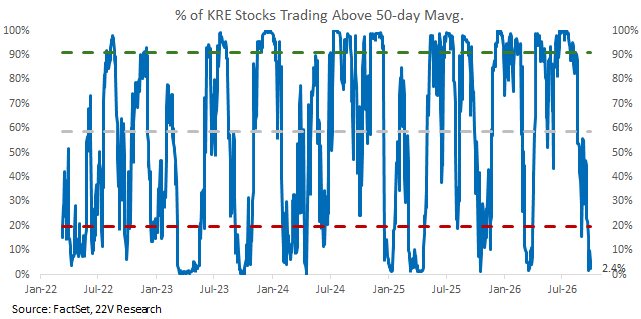
Timing, Tactical Thoughts and Risks – We have taken our shorts off Retail, Transports and Banks into Earnings – Fed governors are pushing back on 4-5 rate hikes and Retail, Transports and Banks are deeply oversold. A deeply oversold condition with 10yr yields at 5.3% (the high end of our 10yr range) is not a place to press shorts in the Non-AI demand related Cyclicals.
Being LONG small caps, retail stocks, transports and industrials will be interesting AFTER some slowing in economic growth, particularly consumer spending. We think that should be evident by early 2027. Roughly 3 months following the first mid-cycle rate hike has supported small caps (details below) and riskier factors historically.
Longer Term – It’s counterintuitive, but a NON-RECESSIONARY increase in the unemployment rate would be CONSTRUCTIVE for equities. The unemployment rate increased in 2025 while S&P 500 multiples expanded. The unemployment rate is moving lower in 2026 and PEs are contracting. FYI, if the unemployment rate were to increase, the speed limit for economic growth would increase. Gerard and I cover this more in a video HERE. The unemployment rate increased a touch last week. That is good.
Charts and indicators below…
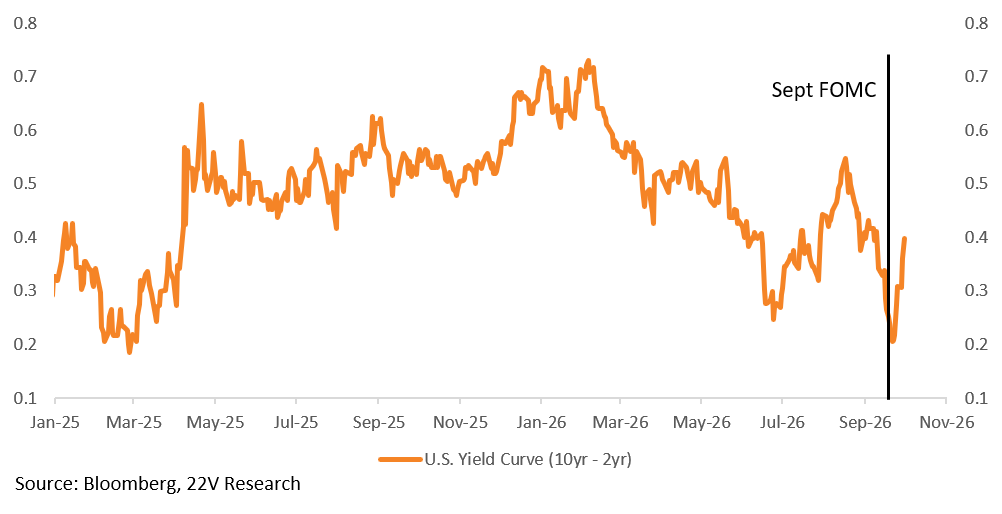
Yield Curve: The steepening of the curve reinforces our view that STRONG economic growth is the main driver of rates and helps explain why the VIX is at 16 and credit spreads are stable despite the 10yr surge. The yield curve is STEEPER now than it was before the last Fed meeting.
CREDIT SPREADS: BAA and AAA yields have both risen, but the spread between them remains very low and well on the tight side relative to history. Stronger growth is driving rates higher.
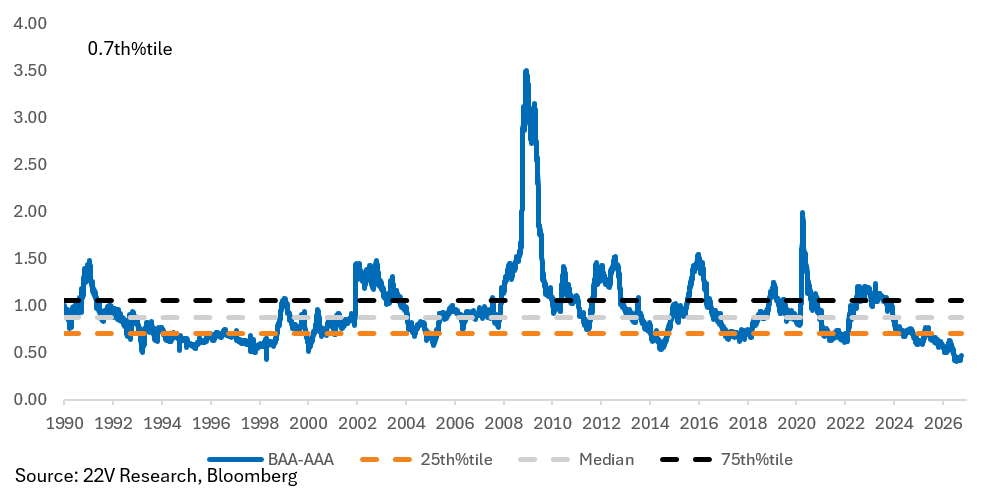
Credit spreads moving wider tends to increase recession probabilities the most. The odds of moving outside of a normal economic regime would increase. That would typically be associated with higher VIX/lower equities.
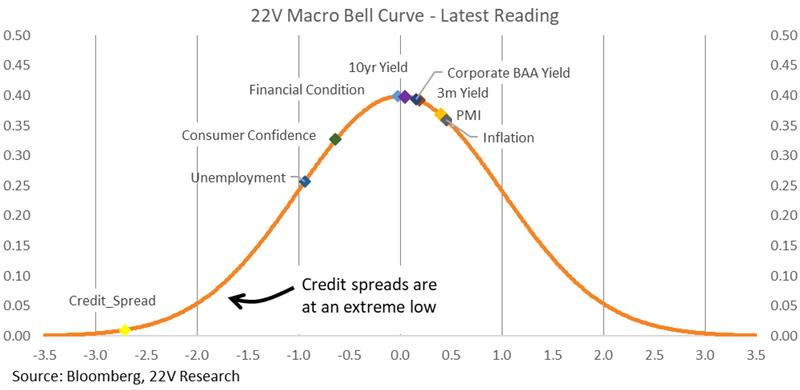
The macro regime model continues to show normal expansion probabilities as unusually high despite the rise in 10-year yields, because all other macro variables — and critically, credit spreads — have remained stable. The probability of being in and remaining in normal economic expansion are unusually high.
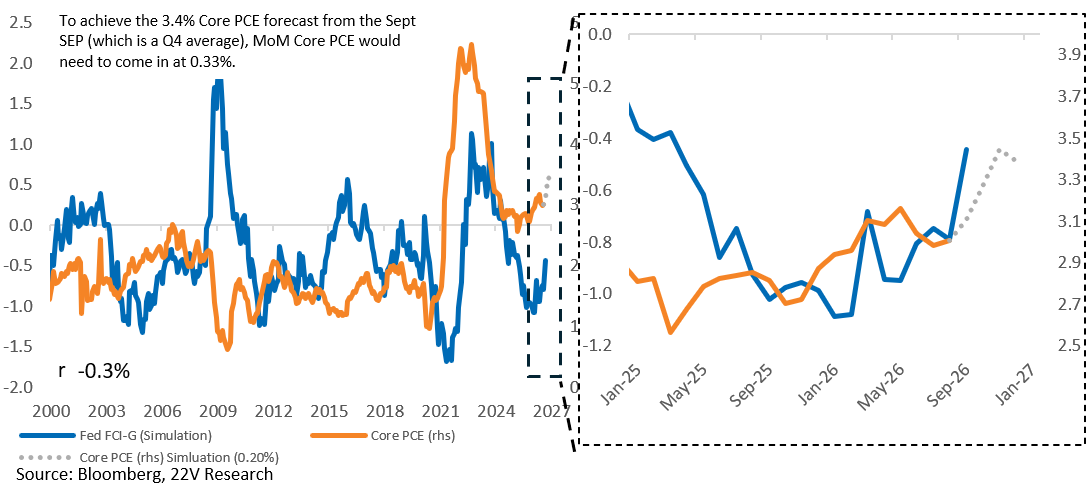
The Fed’s financial conditions model (blue line) indicates 40bps less impulse to GDP growth. False precision, but the implication is that yields should be sufficiently restrictive at these levels to lead the orange line below (Core PCE inflation) lower. Consumer durables spending, business fixed investment, and residential construction should react to higher rates.
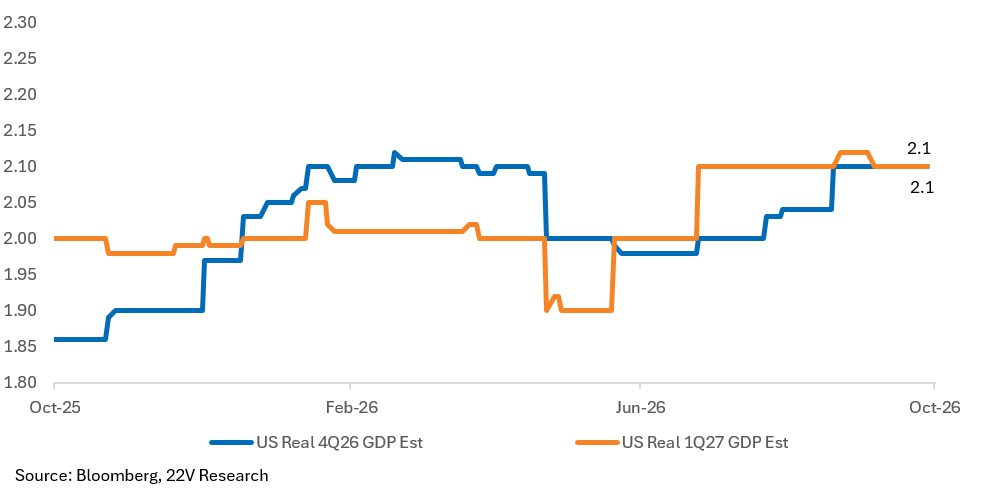
Consensus expectations for GDP growth show a downshift to ~2% real in 4Q26 and 1Q27. That would be closer to the economic speed limit. And limit the need for further rate increases in theory. Much stronger than ~2% GDP growth would put upside pressure on rates.
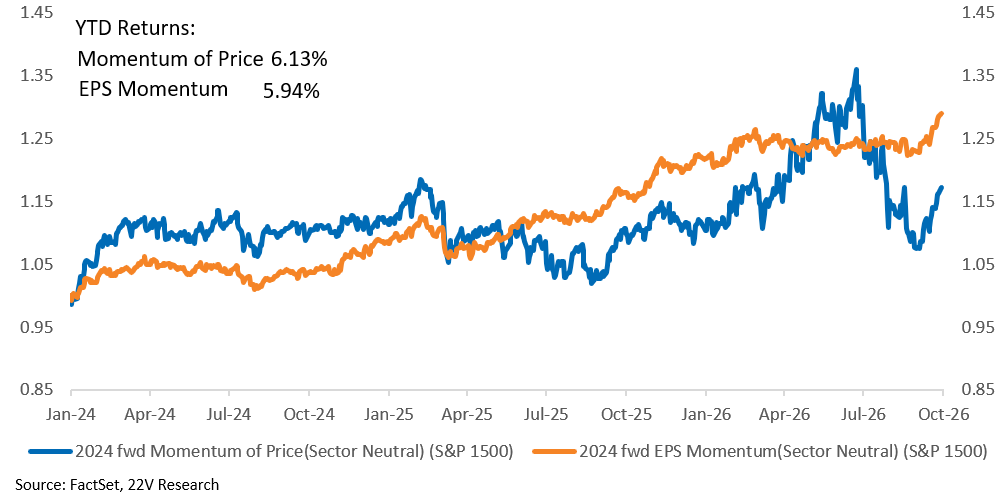
MOMENTUM: We are long the Momentum factors (Price and EPS Momentum) into earnings. Both are expected to “a cyclical” AI trends and benefit even as growth slows.
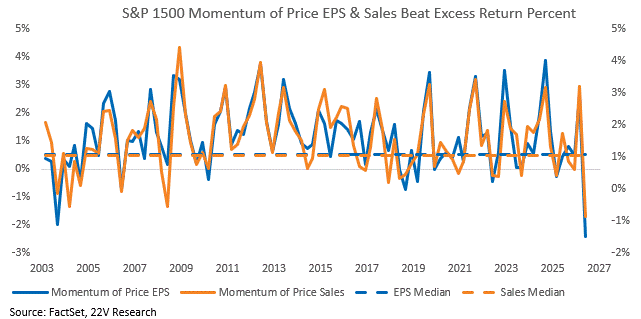
Both have much higher-than-expected EPS growth relative to the market and will benefit, RELATIVE, as other areas of the economy slow. The average excess return for an EPS beat was negative last quarter for Momentum names, the lowest excess return since the GFC.
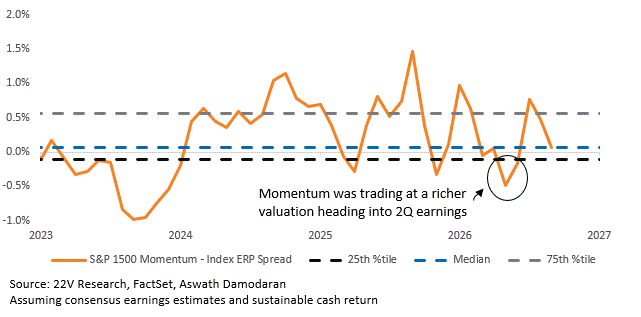
We expect a better average excess return this quarter. Ahead of 2Q earnings, Momentum’s implied equity risk premium (discounting the future dividends and buybacks of the Momentum factor constituents) relative to the S&P 1500 had richened to its lowest level (highest PE) since 2023. Heading into this quarter, valuations are richening again, but only to the median relative to the index. If valuations are moving ahead of earnings, the implied bar is lower this quarter.
Momentum is off the floor, but still in a 90th percentile drawdown.
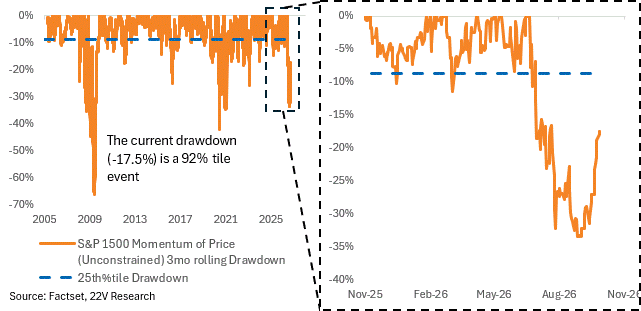
RISK – Longer term, we caution that demand indicators need to slow before Treasury yields move sustainably lower. The pain trade into year-end COULD be surprisingly resilient economic growth and UST yields moving HIGHER.
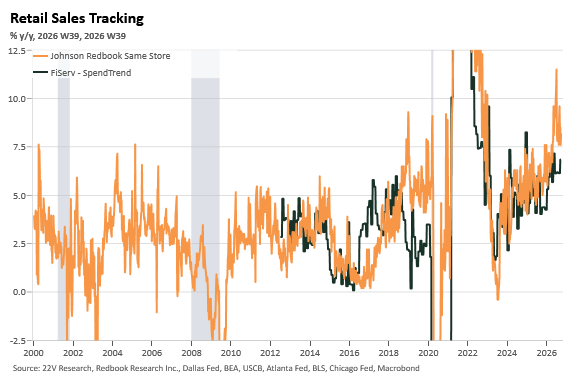
Not Pressing Retail / Banks Shorts Here – It won’t take much of a dovish surprise in the data to support a sharp, SHORT-TERM reversal lower in 10yr yields and higher in oversold Small Caps, Retail and Banks, both are deeply oversold historically.
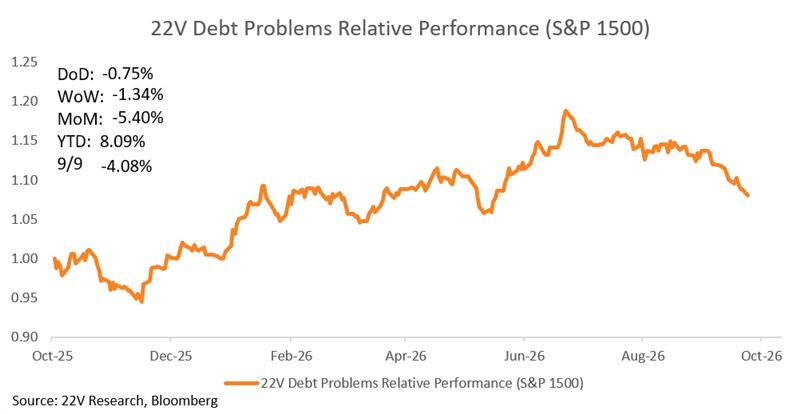
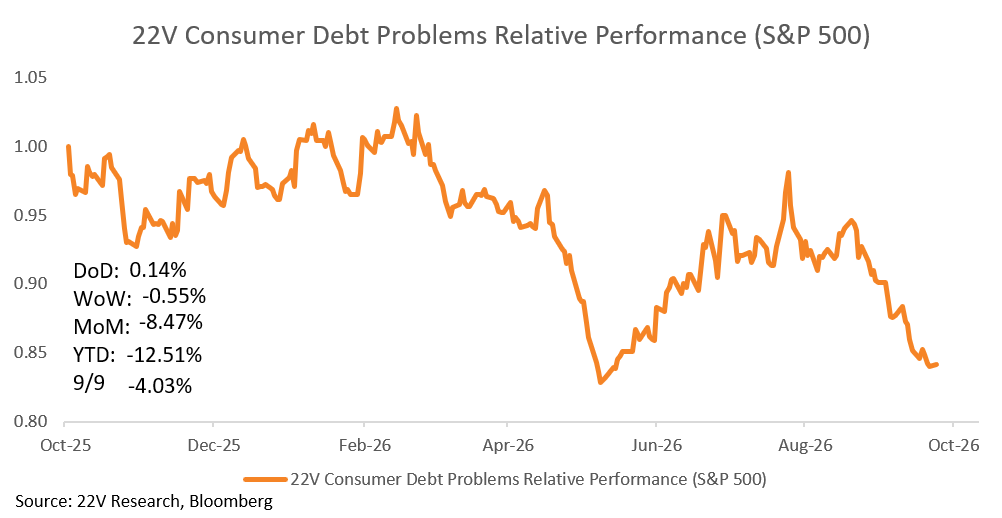
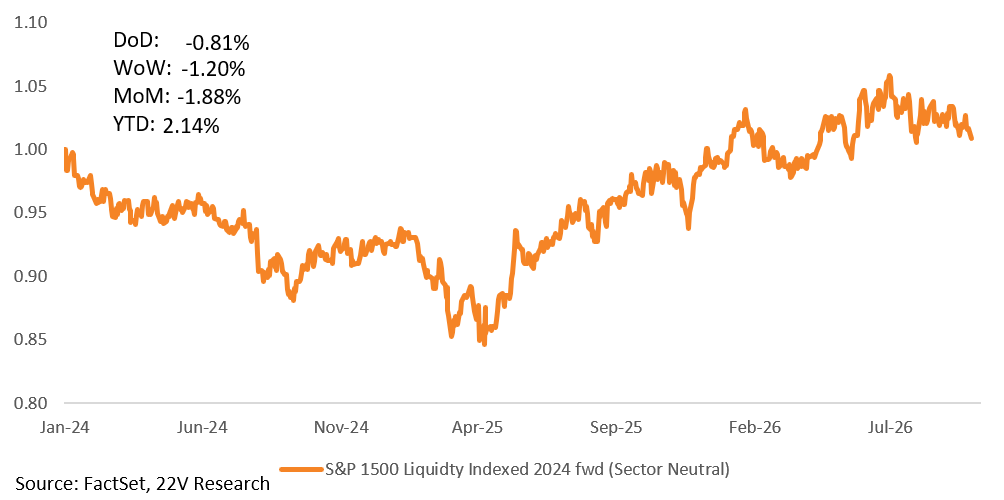
DEBT BASKETS: The current level of rates is a headwind for companies with high exposure to variable rate debt, small caps and the liquidity factor. Variable rate debt represents 38.9% of small cap debt (excluding Financials), compared with 10.5% for large caps, helping explain small cap relative weakness. We have been short these names and it has worked. We are not pressing short in this basket now. On the sidelines.
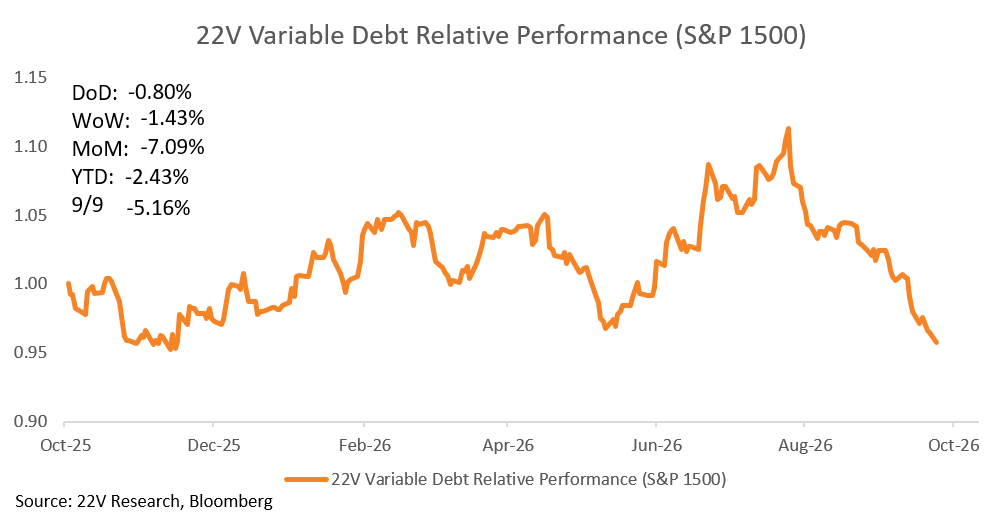
The Liquidity factor has unusually high exposure to variable rate debt (25% of debt of companies is the liquidity factor is variable. The most of any factor).
Discretionary sector has the highest sensitivity to variable rate debt. We remain short Consumer stocks with high debt risk (MS22CDET on Bloomberg).