Weekly – Per the new format, we mark to market our main themes each week. Themes are bolded and mark to market follows.
New Theme (Introduced 6/28) – More Asymmetric Downside Risk for Markets: Marking to Market – Asymmetric FED risk is lower. Risk that inflation readings would lead to tighter financial conditions declined post CPI/PPI. They are not gone. The CPI/PPI data implies Core PCE will come in at 0.2% MoM in July. The Fed hiking in July would have been a base case IF implied Core PCE was 0.25% MoM or above. Fed Governor Waller made clear before the CPI/PPI hit that a hot inflation print could lead to a July hike. Looking forward, strong economic growth means ongoing risk of too high inflation, defined as MoM Core PCE running 0.25% or above for the rest of 2026. But the clear and present Fed tightening danger is much lower. The Strait of Hormuz and related Energy price shock risk will impact the rest of the world more than the US but is clear and present near term macro danger.
Our call is for a benign slowing of economic growth to the ~2% or below range. That would be consistent with 10yr yields in the 4.2-4.5% range. That supports duration sensitive equities (Tech, Discretionary, Banks, Consumer) and Fundamental factors. Marking to Market – The Retail sales report indicated real personal consumption expenditures are running at +2%. As Gerard noted (HERE), there is a positive launch effect for Q3. The launch indicates real consumption will stay at +2% for 3Q. The combination of +2% Real consumption growth and strong capital spending (~1% contributor to GDP growth) suggests economic growth is strong enough that inflation RISK will remain elevated. The above is why a September hike is still a coin flip and 10yr yields should hover around 4.5% for now. A slowdown in economic growth or labor markets is necessary for 10yr yields to move much below 4.5%.
FYI – Credit Card spending accelerated at every major bank from already strong paces in Q1 to extremely strong, flirting with overheating, ones. JPM saw card spending +10% (9% in Q1), BAC 9% (7%), general purpose card spending at C was 12% (6%), WFC was 9% (5%), and DAL’s AXP card program spending grew a wild 16% (12%).
Data That Support Our Normal Economic & Market Regime Base Case: Marking To Market – Our macro regime model continues to classify the current environment as a Normal expansion (HERE), with both macro and market conditions well within their historic ranges. This backdrop favors fundamental factors (Value, Earnings Momentum, GARP) which have all benefited YTD. Healthy corporate fundamentals, and low recession risk continue to support a constructive outlook for equities. Under the current Normal expansion, sales and margins should continue to expand during the 2Q reporting season and economic trends favor stronger than expected revenue and EPS readings. So far so good on this front through bank earnings. Financials and Regional banks outperformed on strong fundamentals last week. The biggest risk to this view is a sharp spike in Vol and credit spreads on Strait of Hormuz risk. Or an AI specific story that drastically challenges AI capex and ROI assumptions.
Non-AI related Cyclicals should continue to Outperform: Marking To Market – Returns have been mixed for Non-AI related Cyclicals (Banks, Retail, Transports, Airlines and Homebuilders. Homebuilders portion is more of a trade) since 6/28 as 10yr yields increased from 4.37% to 4.54% and Strait of Hormuz uncertainty increased. The 10yr yield at 4.5%, for the right reasons, is not a problem for Non-AI related Cyclicals. Last week the 10yr hovered around 4.55% and Non-AI related Cyclicals outperformed. This is consistent with Peter Williams estimated 10yr fair value moving toward 4.5% based on strong demand growth and some mild restrictiveness to offset that strong demand (from 4.5% being the high end of the range). If Peter is correct, 4.7% or above on 10yr yields is likely to be more restrictive for economic growth, resulting in risk-off factors leading, vs the 4.5% level. This was correct last week.
Theoretical Inflation Debates are MUCH Less Useful Now. Follow The Data on Rate Hike Odds & the Fed’s Reaction Function – Marking to Market – Still holds and the more dovish than expected Core Inflation readings helped reduce Fed induced financial tightening risk. Further, the steeply declining trend in the employment/population ratio (even adjusted for last month’s outlier) is evidence the labor market may already be easing some, as is appropriate given the inflation backdrop.
AI Idio is Supportive Based on Demand for AI tools Being Robust Longer Term – Marking to Market – We got strong fundamental readings from Semi name ASML and TSMC last week and Price Momentum (or AI demand beneficiaries) traded poorly. We have been wrong on Momentum and AI beneficiaries the past two weeks. Short term views need to be held with low conviction given the extremely high vol in the group. What Hyperscalers say about AI demand, free cash flow in the future, and Capex plans will be important for the AI demand beneficiaries. What all other companies say about AI related value creation – is the average small and mid-cap stock indicating positive margin outlooks and productivity gains related to AI – is also important.
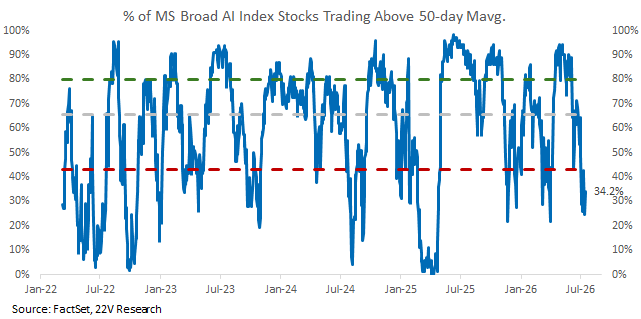
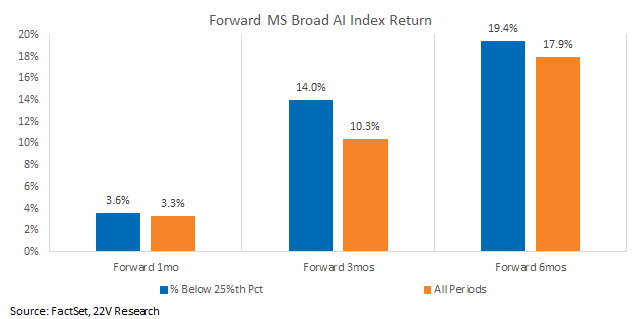
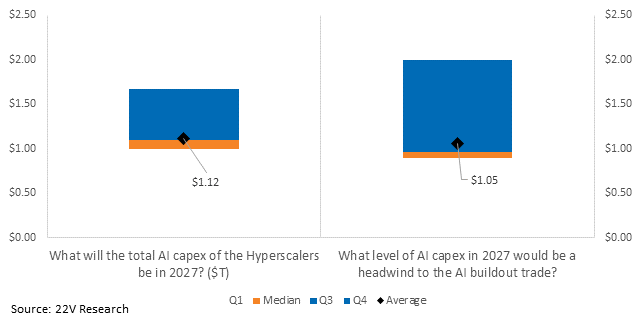
Investors we surveyed (HERE) expect the level of Hyperscaler capex in 2027 (median $1.1T) will support the AI buildout trade. The implication being Hyperscaler earnings over the next few weeks (GOOG 7/22), which should come with some indication on 2027 AI Capex, COULD be a support to the Price Momentum basket. Especially given the oversold condition. The percentage of stocks trading above their 50day moving average in the Morgan Stanley Broad AI index is below the 25th%tile. Forward returns are stronger than normal for this basket when it has been oversold in the past
Charts related to the comments above are below…
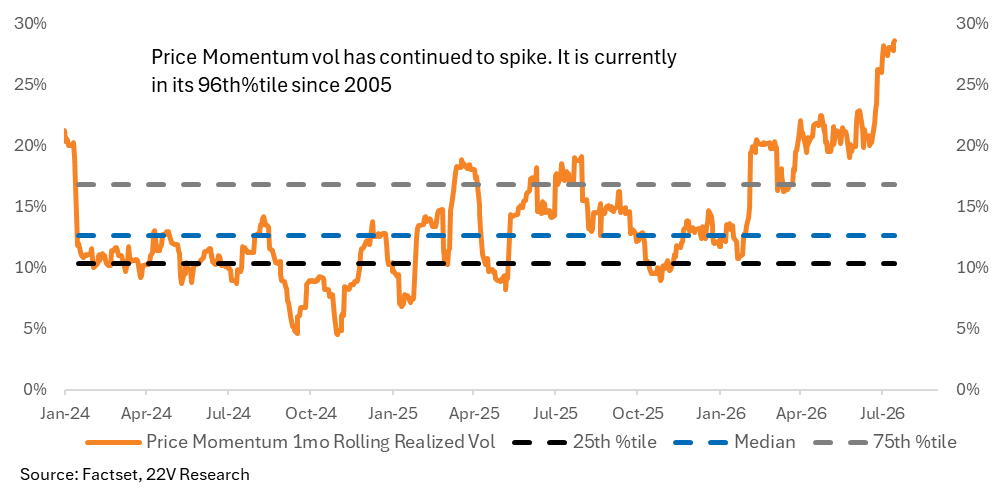
INDICATORS: Price Momentum Vol is unusually high still. We had expected Price Momentum to have a fundamentally driven rally starting last week. The soft inflation prints last week reduced the overhang from financial conditions (HERE), which Momentum was increasingly sensitive too (HERE), and Momentum fundamentals are strong (HERE). This has not materialized and the unusually high Vol in the group is not helping.
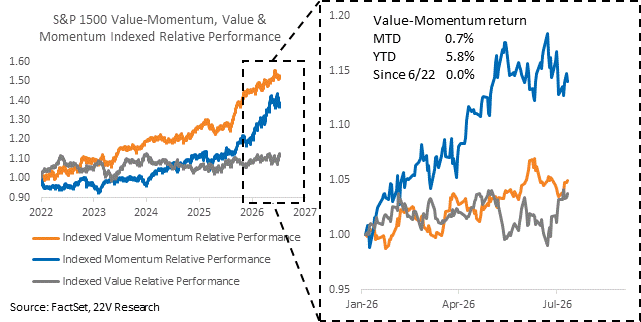
Stocks with both strong Value and Momentum exposure tend to perform better than Momentum and Value baskets longer term. Importantly, the basket shows clear lower volatility under the recent Momentum pull back and can be an addition to hedging further Momentum drawdown risk without sacrificing upside potential.
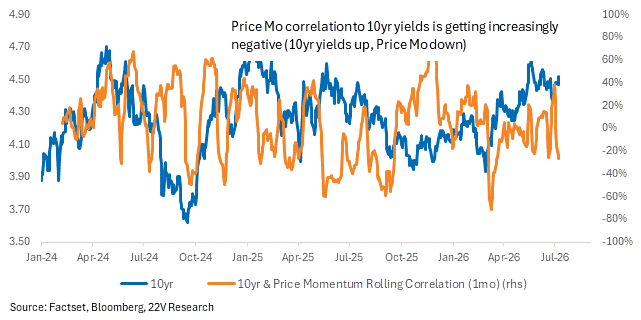
The correlation between 10yr yields and the Price Momentum Factor has been increasingly negative.
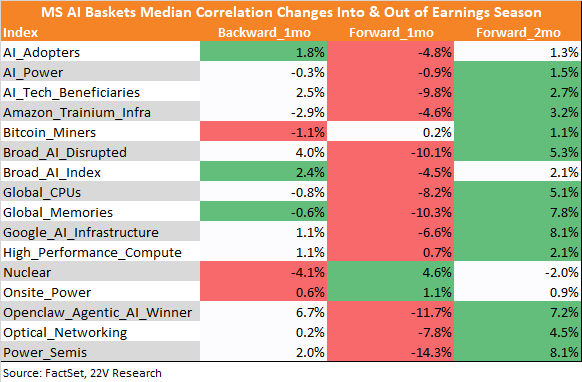
Correlations typically decline during EPS season on an index level and within AI baskets.
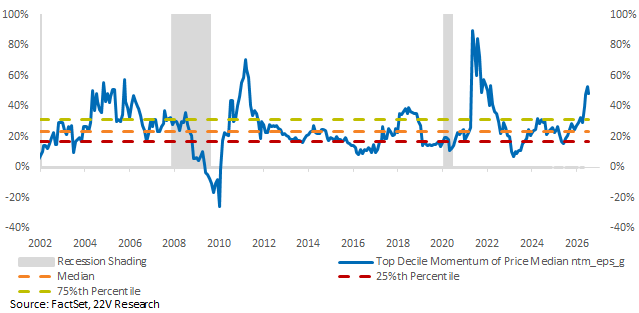
The Price Momentum Factor NTM EPS growth is unusually strong.
The percentage of stocks trading above their 50day moving average in the Morgan Stanley Broad AI index is below the 25th%tile. Forward returns are stronger than normal for this basket when it has been oversold in the past.
YIELDS: As John Roque pointed out, French 10-year yields are at their highest level in 17 years. John notes that G-7 bond yields trend homogeneously over time. The move in G7 bond yields reflects a broader shift to a higher-rate regime, driven by persistent inflation risks, large fiscal deficits, elevated government bond issuance, and stronger-than-expected economic growth rather than a temporary country-specific story. In short, don’t expect a sharp move lower in UST yields when the rest of G7 yields are moving in the opposite direction.
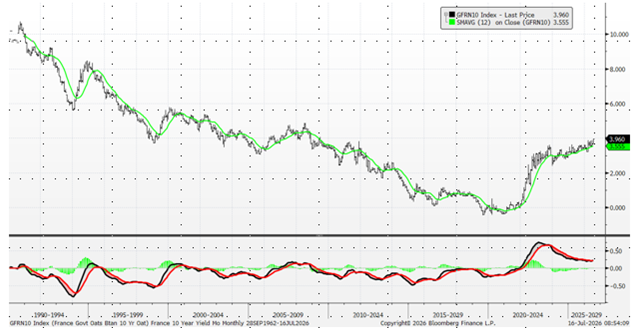
Source: 22V Research, Bloomberg
HYPERSCALERS: Most investors expect the level of Hyperscaler capex in 2027 (median $1.1T) will support the AI buildout trade. Investors have a wide range of estimates for what level of capex would be a headwind to the AI buildout trade, ranging from $900B to $2T.
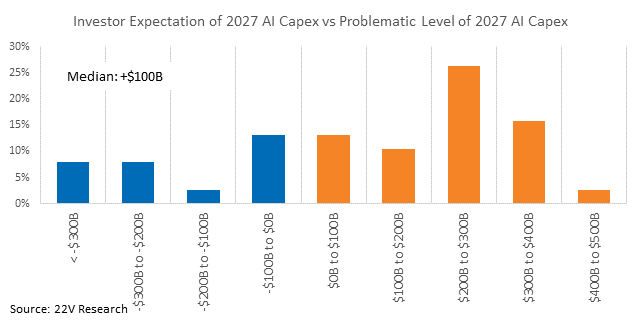
68% of the investors we polled have a higher estimate for capex than the level they think is a headwind. 32% think the level they expect is below the threshold. The median estimate is +$100B higher than the level that’s a headwind.
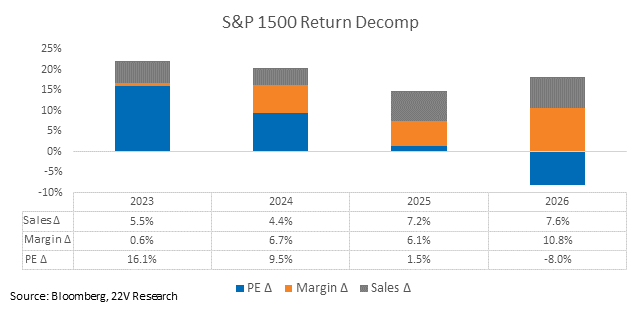
AI VALUE CREATION THROUGH EPS SEASON: Fundamentals have been remarkably strong this year (accounting for 18.4pp of the S&P 1500’s 10.4% YTD return).
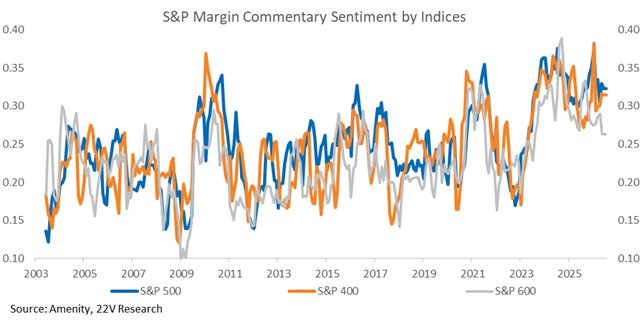
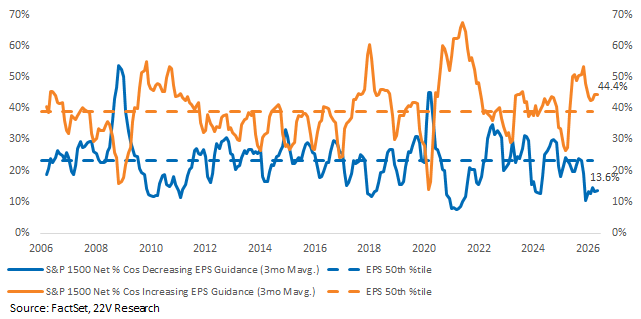
An objective scoring of how management teams sounded about their own business performance (vs the macro backdrop) showed companies were very confident in 1Q. Typically, that’s associated with strong fundamentals going forward, a positive backdrop for 2Q. An historically high 44.4% of S&P 1500 companies have raised guidance and only 13.6% are guiding lower.
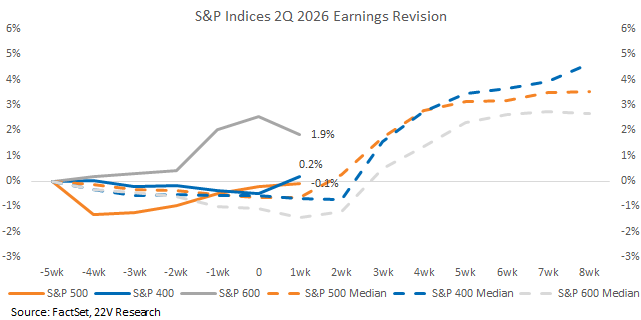
Quarterly earnings revision for Small caps are higher than for mid and large cap names, which is unusual. If revisions remain strong, that will be a support for small cap names.
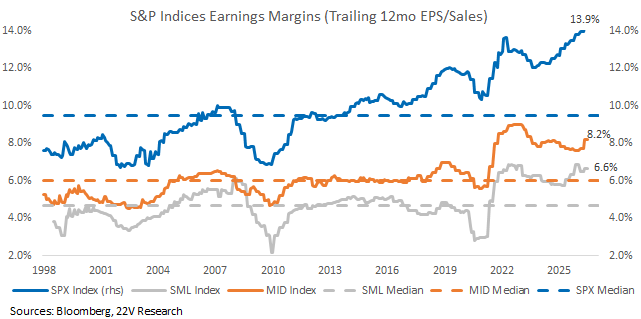
Large cap margins remain well above SMID caps. Hyperscalers margins are particularly high. That noted, small and mid caps profitability have improved as well.
S&P 1500 EPS guidance ahead of 2Q has continued to rebound after a sharp drop in 1Q. 44.4% of S&P 1500 companies are raising the guidance and only 13.6% are guiding lower.
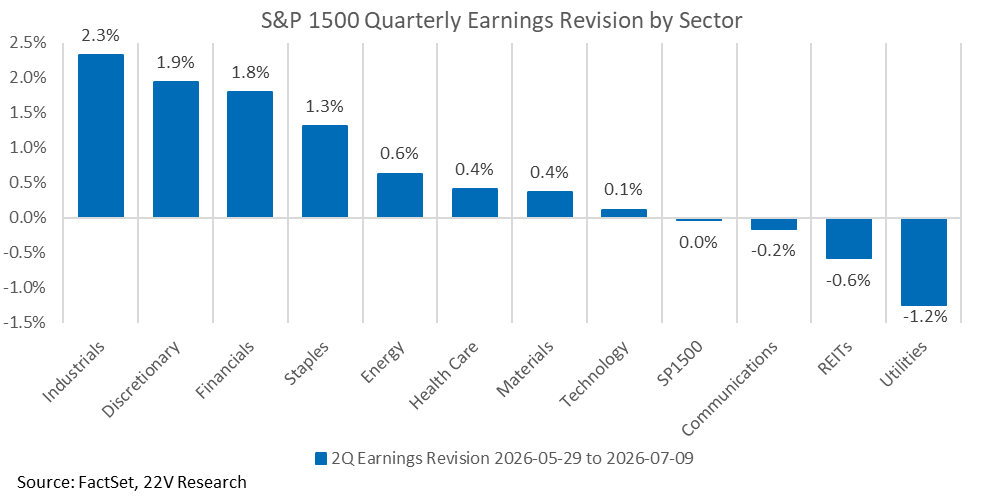
Revisions by sector are strongest for Industrials, Discretionary, Financials, and Staples. Industrials are most levered to the AI buildout, so strength there is not particularly surprising. Discretionary, Financials, and Staples are all levered to the consumer, which has been strong.