Back Portfolio Strategy

Non-AI Cyclicals Struggling as SOH Resolution is Pushed Back + Micro Level Look at AI Costs and Margins

Published on June 4, 2026

∙ Download the PDF Report

By

Dennis DeBusschere

Kevin Brocks

Sophia Wang

DAILY STRATEGY: The most frequently asked question in investor meetings is what catalyst would cause non-AI cyclicals (Retail, Airlines, Transports, Banks) to re-rate higher. The near-term catalyst remains some resolution on the Strait of Hormuz. The longer term outlook for input cost, and inflation expectations would decline. 10yr yields would be biased lower. At the same time, economic growth is likely to trend at ~2% real.

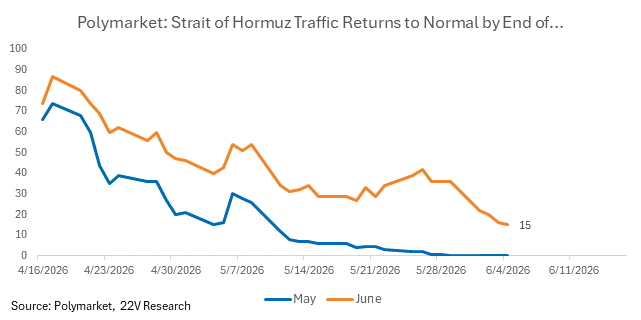
Recall, <4.5% on 10yr yields should support non-AI Cyclicals. Along with all Cyclicals and Fundamental factors (HERE). Unfortunately, the SOH resolution catalyst keeps being pushed back. Polymarket odds of traffic “returning to normal” by end of June are down to 15%. The potential asymmetric returns for non-AI related Cyclicals if there is a SOH resolution remains interesting. But the situation is volatile and it’s an open question if a resolution can be reached without significant demand destruction first. i.e. oil prices increase to $120+ before something gives in the negotiations. We have been recommending options to hedge against event risk when volatility cheapens (HERE).

Company Margin Outlook Follow Up – Yesterday went over some investor concerns that AI adoption is correlated with, not the cause of, margin improvements in 1Q. And how companies could be using AI to save time on specific tasks, but not monetizing the productivity improvements (full explainer HERE). This concern might be true, but right now, 66% of AI Using companies have above average forward-looking margin sentiment. The companies that have quantified AI are guiding to ~80bps of margin improvement. The practical implication is IF firms are overspending on AI, now is NOT the time to position for it. Position for it when the spread between margin and cost sentiment narrows.

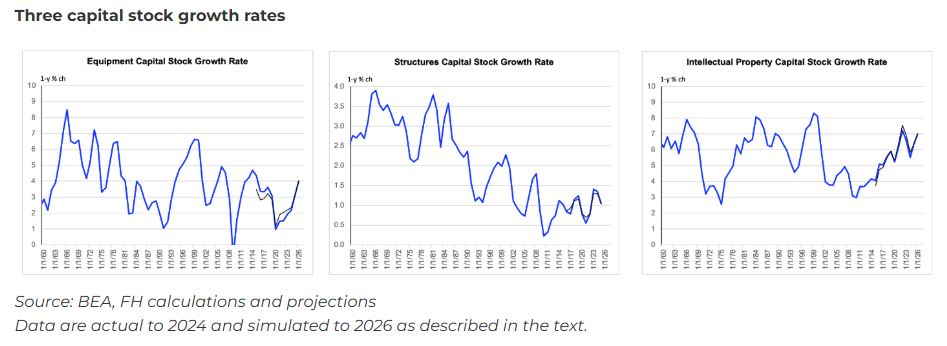
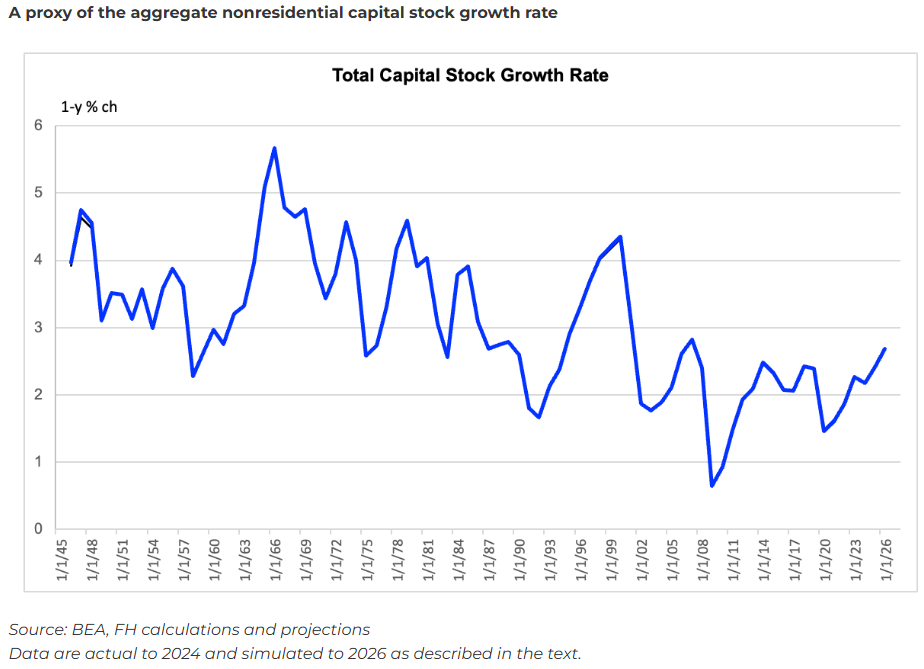
FYI, Gerard had a similar point about the economic effects from AI spending. The AI buildout might be tracking bubble dynamics LONGER TERM. But so far, the pace of activity does not look extended, based on the relatively tame increases in capital stock growth rates (HERE).

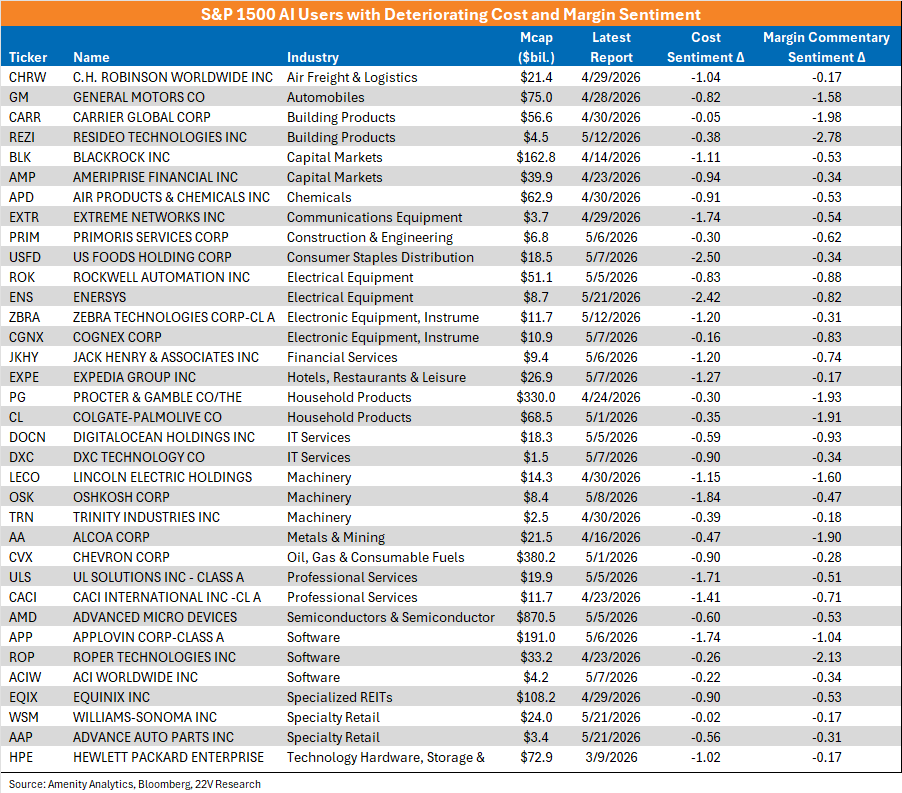
We attempt to apply investor concerns about AI costs and margins at a micro level today. To be clear, this is an initial filter. We would not trade this group as a basket. We look at this group as a place for analysts to do some digging into the names highlighted. Hopefully laying out our framework is informative. Anyway, we list companies that are using AI but have deteriorating margin and cost sentiment. This group of companies COULD be overspending on AI relative to the productivity benefits. Or maybe the benefits of AI just haven’t shown up yet and they will going forward. That could be positive. List below.

Charts…

The companies in the S&P 1500 who have detailed specific use cases of AI but worse forward-looking margin and cost sentiment are below. These are companies to risk manage around.
A table with numbers and letters on it

AI-generated content may be incorrect.

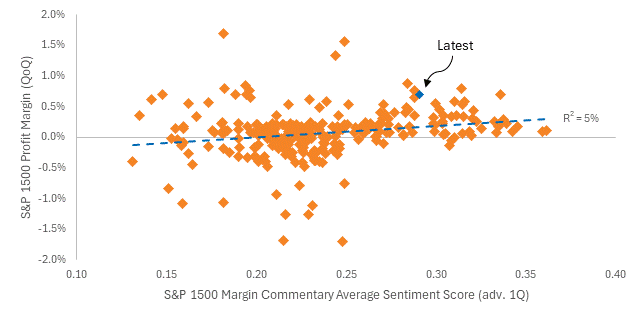
Yesterday we showed how the level of forward-looking margin sentiment is associated with strong levels of margins (HERE). The level of forward-looking margin sentiment is also indicative of margin expansion QoQ. The fit isn’t particularly strong, but sentiment at these levels has almost never resulted in margin compression QoQ. Now is not the time to position for AI overextension.
Source: Amenity Analytics, 22V Research

Odds that the Strait of Hormuz traffic returns to normal by the end of June are dropping. This tail risk is weighing non-AI Cyclicals (retail, transports, airlines, banks).
From Gerard on the economic side of the AI buildout… “the rate of growth of the equipment capital stock is no longer depressed – as it was at the last time I did this update a couple years ago. But nor does it compare with that of the 1990s boom. The structures capital stock is growing at a depressed rate, which I assume is known. And the intellectual property capital stock, dominated by software and the output of corporate R&D, is at the top of the historical range, although not well above it. The sum of these three times, shown in the chart below, is growing at a moderately slow pace, although it is no longer fair to say it is depressed.”
A screenshot of a graph

AI-generated content may be incorrect.

A graph with a line

AI-generated content may be incorrect.

DISCLOSURES AND DISCLAIMERS

Analyst Certification

The analyst, 22V Research Group, primarily responsible for the preparation of this research report attests to the following: (1) that the views and opinions rendered in this research report reflect his or her personal views about the subject companies or issuers; and (2) that no part of the research analyst’s compensation was, is, or will be directly related to the specific recommendations or views in this research report.

Analyst Certifications and Independence of Research.

Each of the 22V Research analysts whose names appear on the front page of this report hereby certify that all the views expressed in this Report accurately reflect our personal views about any and all of the subject securities or issuers and that no part of our compensation was, is, or will be, directly or indirectly, related to the specific recommendations or views of in this Report.

22V Research (the “Company”) is an independent research provider. The Company is not a member of the FINRA or the SIPC and is not a registered broker dealer or investment adviser. 22V Research has no other regulated or unregulated business activities which conflict with its provision of independent research.

22V Research, LLC is a professional services and independent publication organization. 22V Research, LLC is not a securities broker-dealer, not a member of the Financial Industry Regulatory Authority (FINRA), not a registered investment advisor (RIA) and not a member of SIPC.

Securities transactions, when offered, are offered by 22V Securities, LLC through LPS Capital, LLC. Certain employees of 22V Securities, LLC are dually registered as securities representatives of LPS Capital, LLC or Analyst Hub Securities, LLC. 22V Securities, LPS Capital and Analyst Hub Securities are members FINRA, SIPC.

https://brokercheck.finra.org/

Current Ratings Definition.

SECTOR OUTPERFORM: An “outperform” rating anticipates the company will outperform the S&P Regional Banking Index (peer group).

SECTOR PERFORM: A “market perform” rating anticipates the company will perform in line with the S&P Regional Banking Index (peer group).

SECTOR UNDERPERFORM: An “underperform” rating anticipates the company will underperform the S&P Regional Banking Index (peer group).

Limitation Of Research And Information.

This Report has been prepared for distribution to only qualified institutional or professional clients of 22V Research Group. The contents of this Report represent the views, opinions, and analyses of its authors. The information contained herein does not constitute financial, legal, tax or any other advice. All third-party data presented herein were obtained from publicly available sources which are believed to be reliable; however, the Company makes no warranty, express or implied, concerning the accuracy or completeness of such information. In no event shall the Company be responsible or liable for the correctness of, or update to, any such material or for any damage or lost opportunities resulting from use of this data. Nothing contained in this Report or any distribution by the Company should be construed as any offer to sell, or any solicitation of an offer to buy, any security or investment. Any research or other material received should not be construed as individualized investment advice. Investment decisions should be made as part of an overall portfolio strategy and you should consult with a professional financial advisor, legal and tax advisor prior to making any investment decision. 22V Research Group shall not be liable for any direct or indirect, incidental or consequential loss or damage (including loss of profits, revenue or goodwill) arising from any investment decisions based on information or research obtained from 22V Research Group.

Reproduction And Distribution Strictly Prohibited.

No user of this Report may reproduce, modify, copy, distribute, sell, resell, transmit, transfer, license, assign or publish the Report itself or any information contained therein. Notwithstanding the foregoing, clients with access to working models are permitted to alter or modify the information contained therein, provided that it is solely for such client’s own use. This Report is not intended to be available or distributed for any purpose that would be deemed unlawful or otherwise prohibited by any local, state, national or international laws or regulations or would otherwise subject the Company to registration or regulation of any kind within such jurisdiction.

Copyrights, Trademarks, Intellectual Property.

22V Research Group, and any logos or marks included in this Report are proprietary materials. The use of such terms and logos and marks without the express written consent of 22V Research Group is strictly prohibited. The copyright in the pages or in the screens of the Report, and in the information and material therein, is proprietary material owned by 22V Research Group unless otherwise indicated. The unauthorized use of any material on this Report may violate numerous statutes, regulations and laws, including, but not limited to, copyright, trademark, trade secret or patent laws.
