

As the S&P (SPY) and Nasdaq (QQQ) continue to trade in a “violently flat” manner, the real winner year to date continues to be the emerging markets. These markets continue to benefit from a weaker US dollar, as well as a diversification trade out of the US to other markets that are more levered to commodities, materials and the industrial AI trade (a trade 22V has been on for some time now). While the S&P is up ~ 1%, and the NDX is down ~ 1% on a YTD basis, the main emerging markets etf (EEM) is up ~ 14% while Brazil (EWZ) is up just under 24%.
Both EEM and EWZ continue to sharply outperform SPY and QQQ on a year-to-date basis
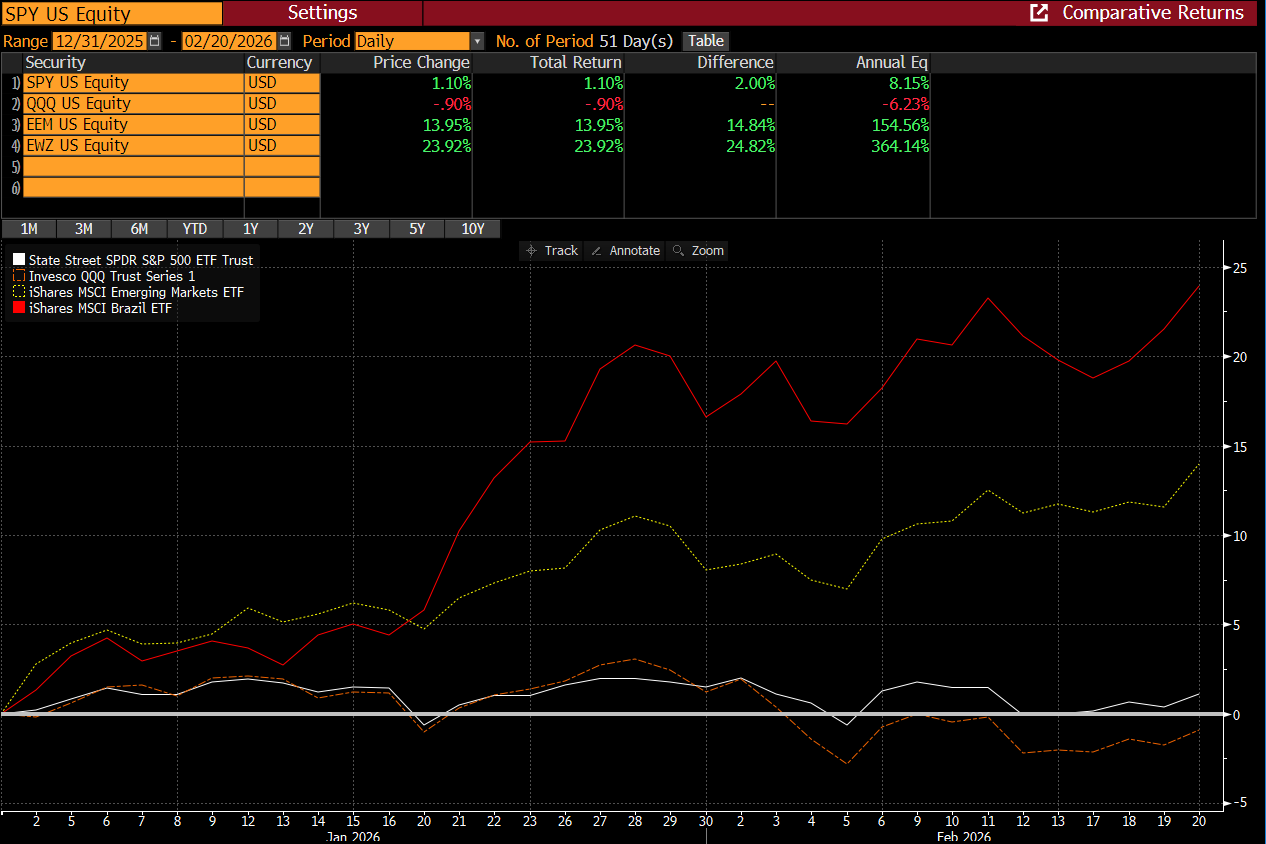
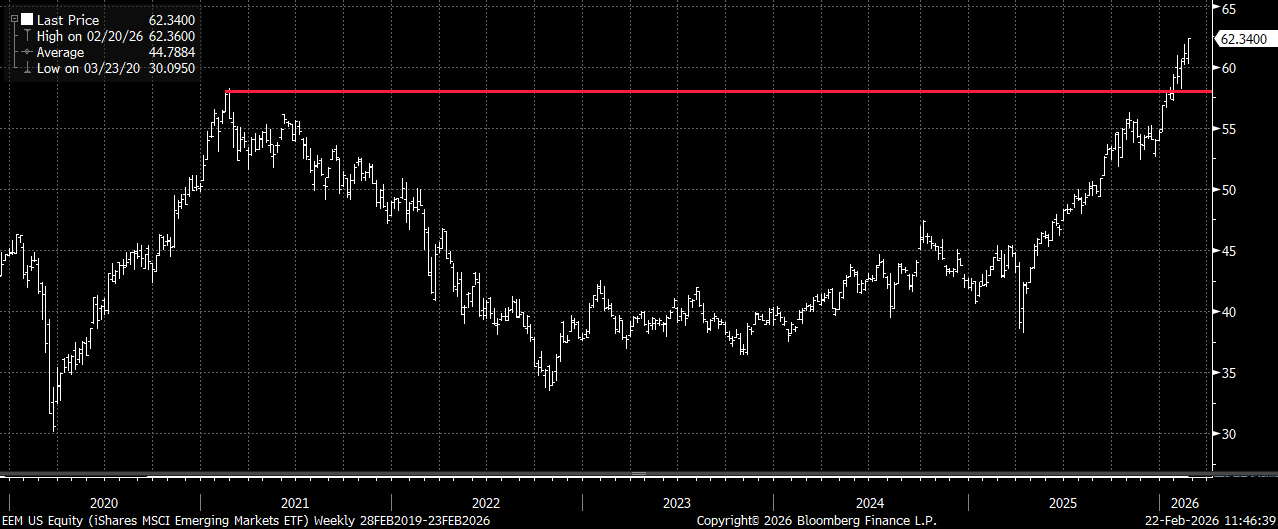
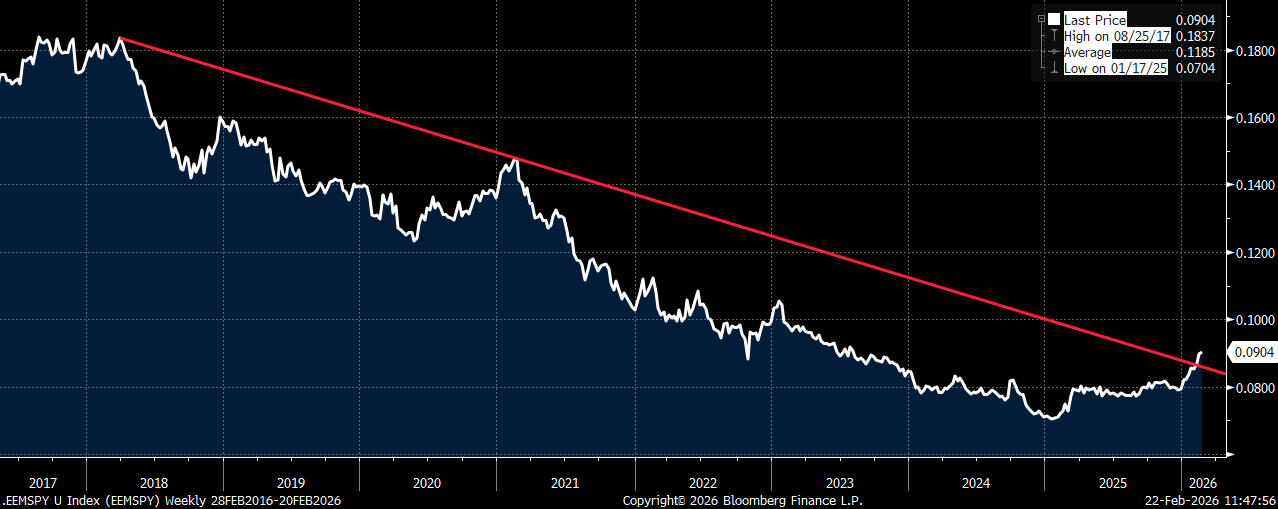
In my first note of the year I highlighted EEM calls as a preferred way to play this broadening out theme, while also targeting markets that should benefit from a weaker US$ (here). The EEM Feb 20th 57 calls I suggested buying for $1 back in early January went out on this past Friday’s expiration worth $5.34. While these calls performed very well, I continue to believe there is still more upside to this trade as we move thru the year. All the reasons that made me bullish on EEM still remain; 1) weaker US$, 2) diversification out of US stocks to other assets that have lagged considerably for years and 3) strong technical breakout by both EEM and EEM/SPY relative spread.
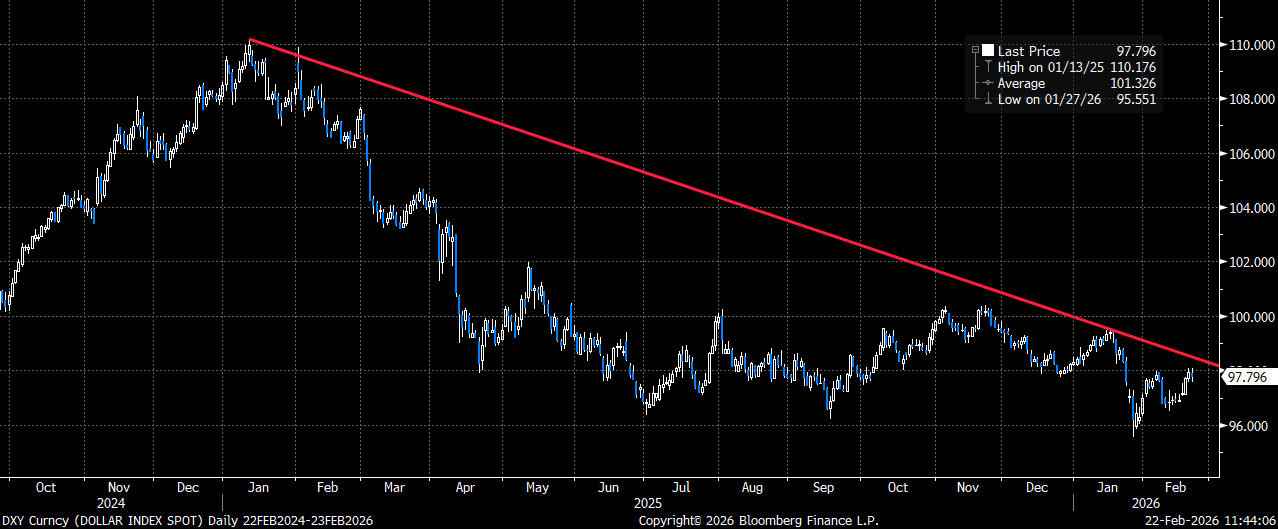
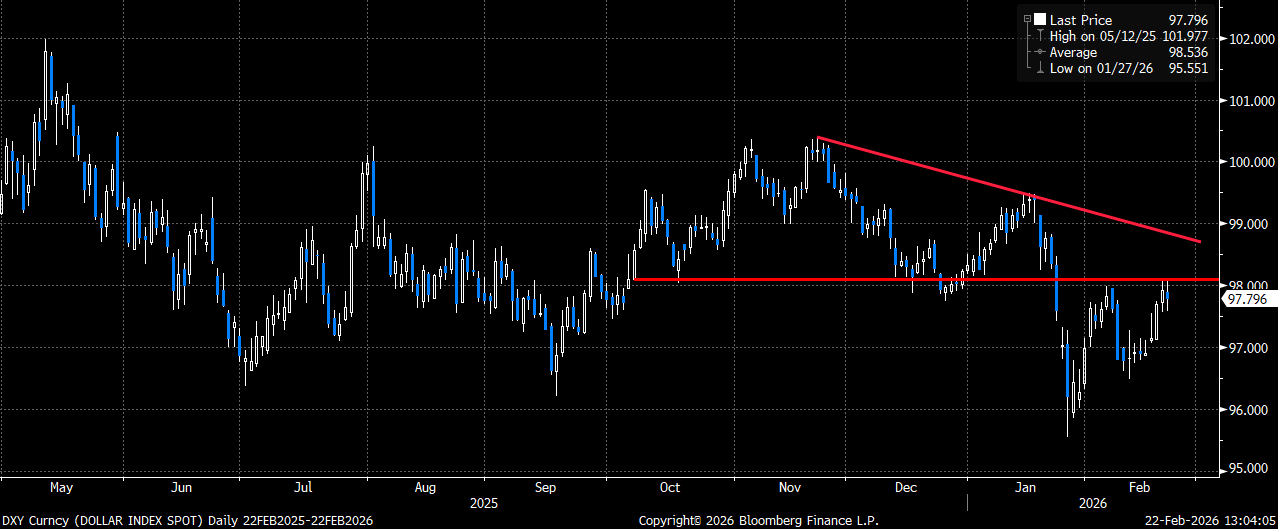
Of note now is the DXY index has been rallying over the past few weeks, yet EEM still continues to outperform. Since late January, the DXY has climbed from a low ~ 95.5 to a high ~ 98, yet EEM has outperformed the S&P by over 4% over that time and has outperformed the NDX by just under 7%. The 98 level appears to now be some level of resistance, so a further decline in the US$ should continue to be a strong tailwind for EEM. In addition, the announcement from the SCOTUS on Friday regarding tariffs should likely weigh on the US$ as concerns about the ballooning deficit remain. On the last three biggest declines for the DXY (8/1- 9/17, 11/21-12/23 and 1/16-1/27) EEM has rallied by 10.5%, 3.8% and 4.3% respectively. Given the news on Friday, as well as the recent rally up towards likely technical resistance, it wouldn’t surprise me to see further weakness in the dollar from here (thus supporting a continued move higher in EEM).
US dollar index (DXY) remains in a decided downtrend
DXY likely should have resistance at the 98 level, especially after the tariff decision on Friday
EEM with a multiyear breakout above the former highs
EEM/SPY relative spread also with an impressive breakout above the 8-year downtrend. It also highlights how much more room the trade has to still run potentially
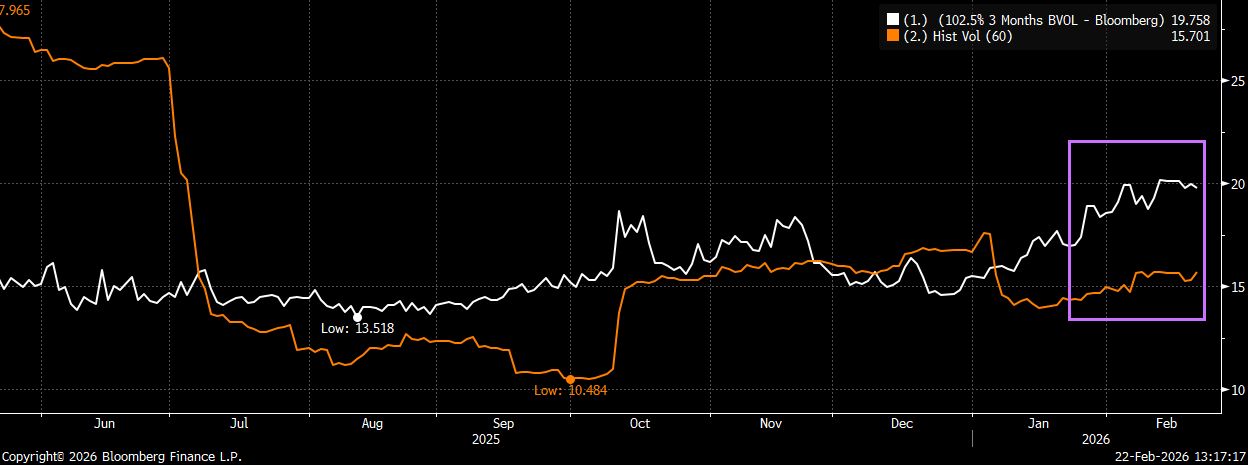
Perhaps the biggest change now in EEM since Jan (besides the sharp rise) is the fact that we have seen upside call implied volatility move higher as well. Back in Jan the 2-month (Feb) 2.5% upside call volatility was ~ 15, and now it is trading ~ 20. At the same time, 60-day realized vol has moved LOWER. While I continue to want to own upside structures in EEM, I want to be mindful of the 33% rise in implied vol WHILE the index has moved higher (we typically see vol move lower as the index rises). Therefore, I believe buying upside 3-month (May) call spreads in EEM should be considered over outright calls at this time.
EEM 3-month (May) upside implied volatility has climbed from ~ 15 to 20 since the start of the year, while 60-day realized vol has moved lower
Trade:
Buy EEM May 15th $65/$71 call spread for ~ $1.20 (EEM $62.34 Fri close ref)
Trade Details:
- Buying the May upside call spread in EEM to position for continued upside in the emerging markets trade
- Trade offers a 4x to 1 max payout at expiration on the limited-risk upside structure
- Call spread starts 4.3% higher and is capped to the upside ~ 14% higher by May 15th expiry (EEM is up that same 14% YTD)
- Trade can be added to an existing long EEM equity position, or as a limited-risk upside play for the next three months
- Please reach out to me or the 22V sales team for updated pricing and execution capabilities
Gold looks poised to move back to the highs
After the sharp correction in both silver and gold at the end of January I suggested adding March upside call spread risk-reversals to position for a move back higher in both, while also offsetting the very elevated implied volatility (here). Since then, gold has rallied ~ 5% while silver is up only less than 2%. Since the move up in gold was far more contained than what we saw in silver before the sharp correction, I believe gold has less work to do in terms of consolidation. What has really impressed me with gold is that is has been able to move back higher even as the US$ (DXY) has strengthened (see above). Must like EEM, gold tends to really benefit when we see moves lower in the DXY. On the last three biggest declines for the DXY (8/1- 9/17, 11/21-12/23 and 1/16-1/27) GLD has rallied by 9%, 10.5% and 13% respectively. If my assessment above on the DXY is correct, then I believe gold (GLD) could quickly move back to the former highs (or higher) and perhaps in somewhat short order.
After the 17% decline from the recent highs, gold looks poised to move back to the highs (especially if we see the US$ weaken from here)
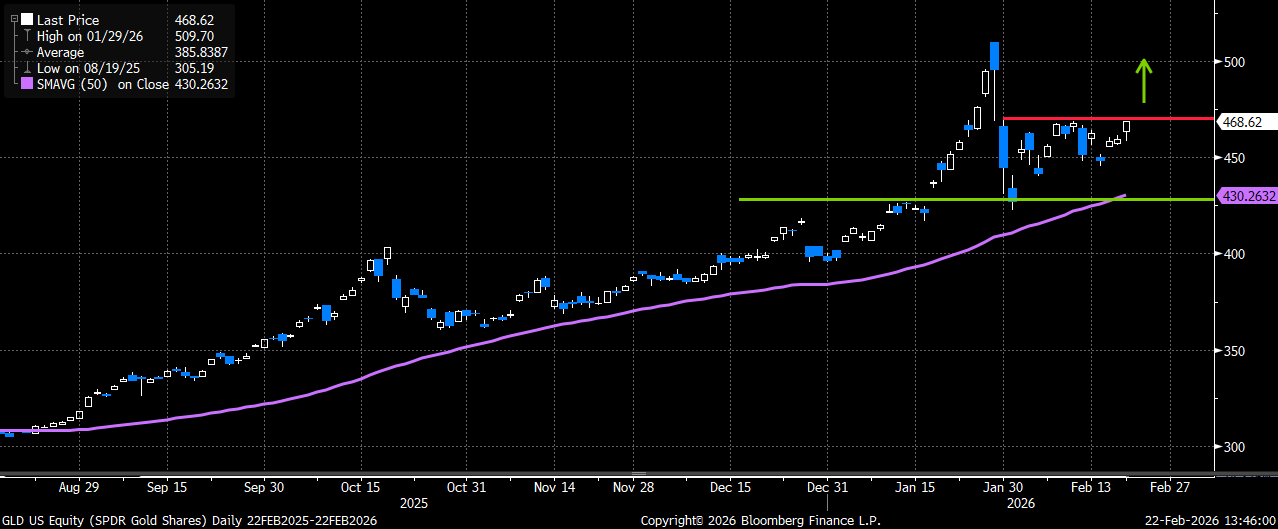
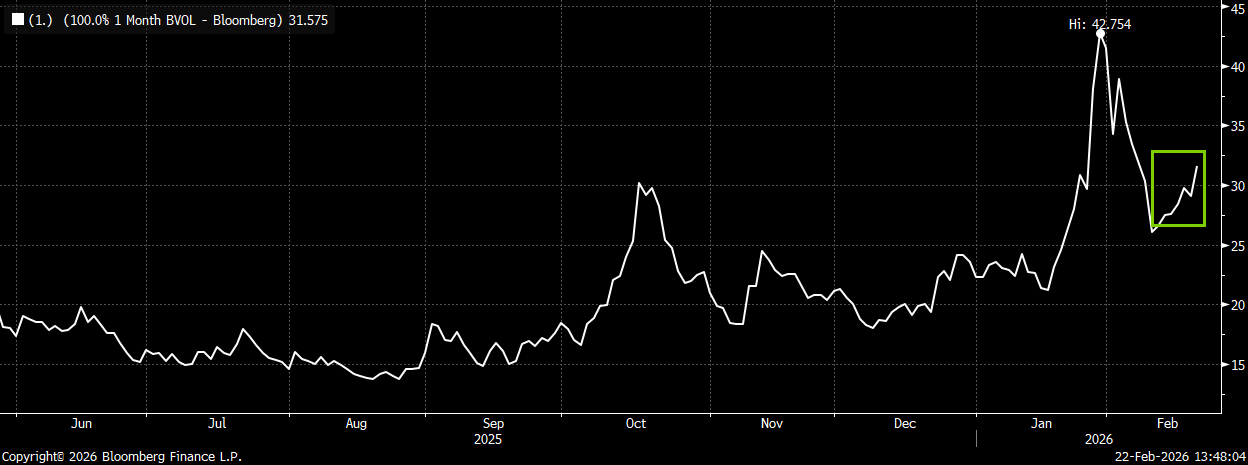
Even though 1-month (March) implied volatility has come down for GLD, it remains about DOUBLE where it traded back in August-September. Therefore, I still believe selling a downside put to buy an upside call spread is the “best” way to position for a move back higher, while also allowing a cushion for potential weakness. Given the bullish action of late (rallying in the face of the stronger US$), I wanted to update my GLD March trade now that gold is ~ 5% higher than when I published my last idea at the end of January.
GLD 1-month (March) implied volatility is down from the Jan highs, but still trades at about TWICE the level it traded at back in August-September
Trade:
Sell GLD March 20th 435 puts
Buy GLD March 20th 485 calls
Sell GLD March 20th 530 calls
Costs ~ $3.60 (GLD 468.62 Fri close price ref)
Trade Details:
- Selling the 7%+ downside puts (at a level just above what appears to be very strong technical support) to buy the upside call spread that starts 3.5% above spot
- March call spread is capped 13% above current levels, and well above the highs hit in January before the sharp 3-day correction
- Trade is a good way to offset the still elevated volatility, while potentially adding upside outperformance
- March structure can be added to an existing long/bullish gold position, or as an entry-point trade into gold following pullback from the highs
- Weakness in US$ (DXY) could be short-term catalyst to see gold move back to the former highs (or higher)
- Please reach out to me or the 22V sales team for updated pricing and execution capabilities

