The carnage in the silver market on Friday (down ~ 30% and as much as 35%), and the gold market to a lesser degree (down over 10% and as much as 13%) should be yet another HUGE wake-up call to investors who may be blindly believing that we couldn’t see a meaningful rise in both equity market volatility (VIX) as well as bond market volatility (MOVE), both of which continue to trade near their respective lows. I have been suggesting for weeks that VIX calls are a “must own” as a macro portfolio hedge in the current environment (here), and the action we have seen in several other areas of the market only gives me more confidence in that call. We have now seen MULTIPLE 6-Sigma moves in just the last two weeks across various assets (Japanese bonds, silver & gold – both up and down), and I believe all of these “black swan” events happening at the same time speaks to perhaps massive mispricing to “tail” risks.
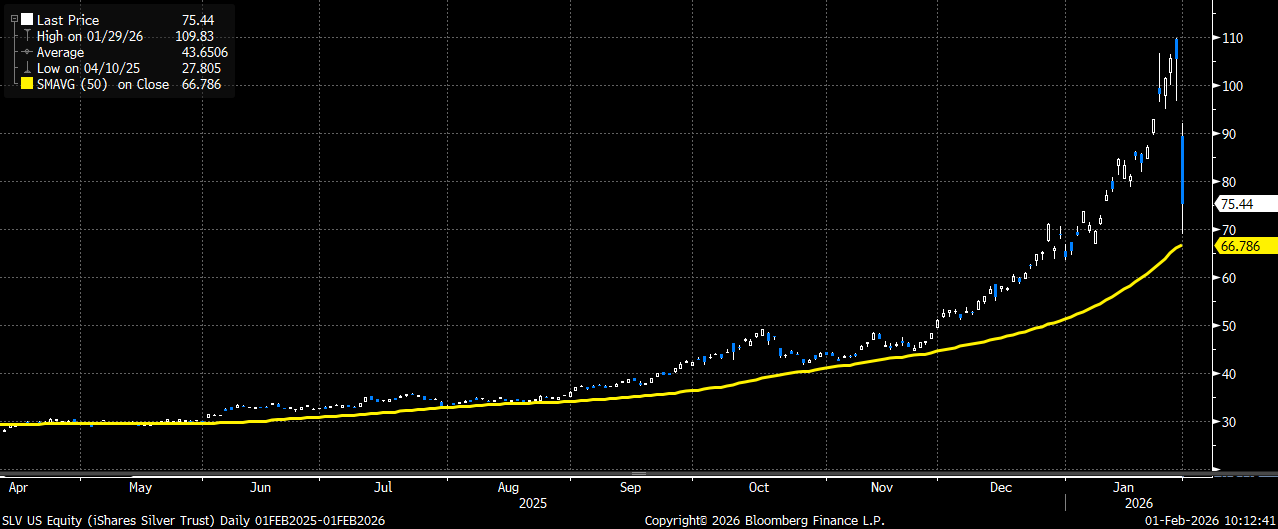
The main silver ETF (SLV) declined by as much as 35% on Friday on massive volume
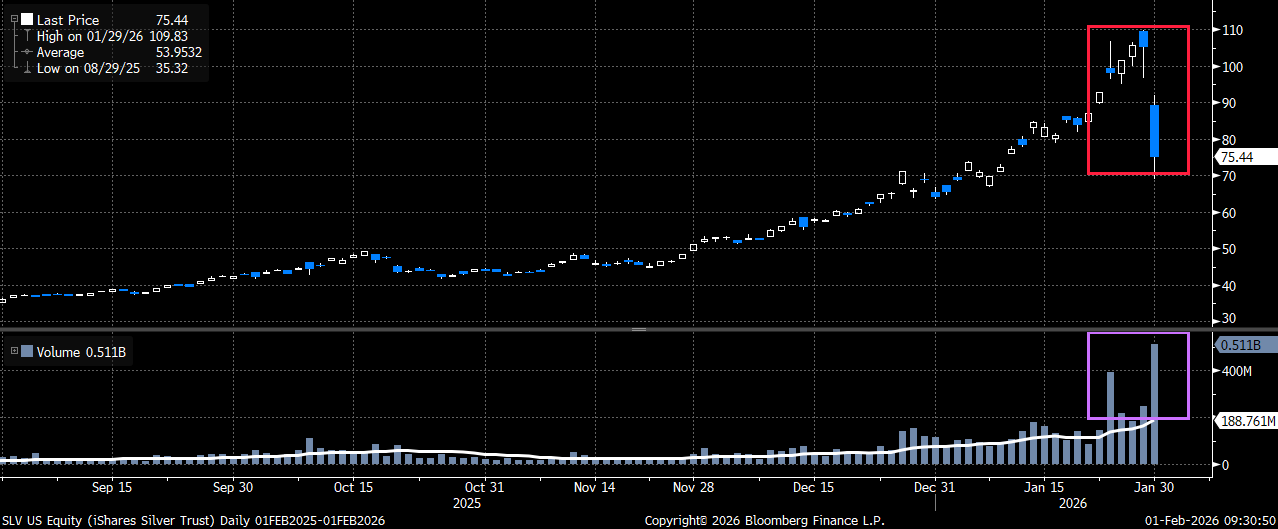
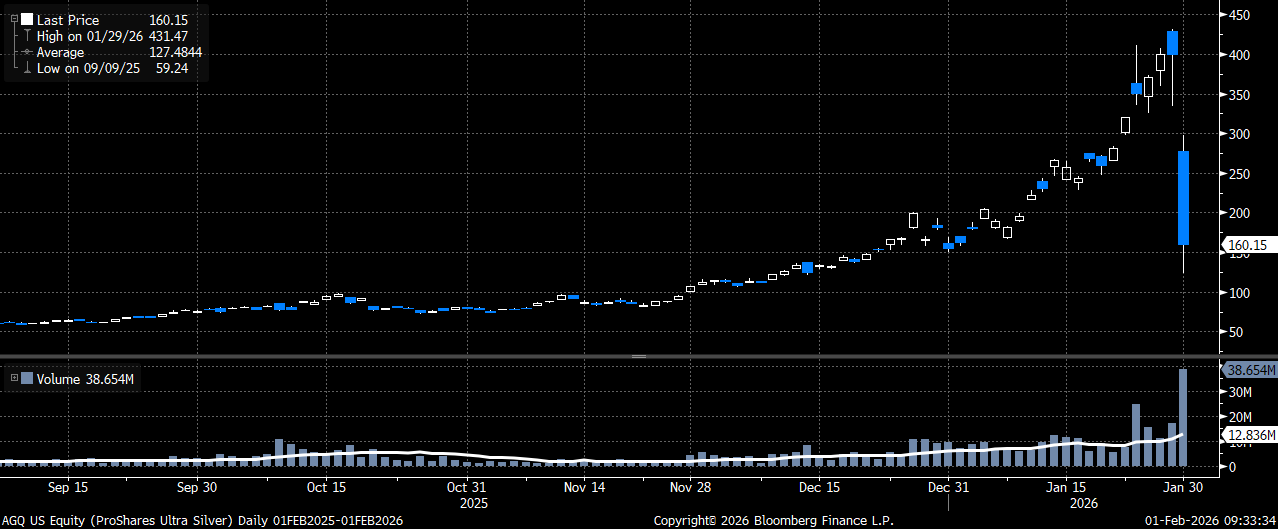
Whatever triggered the exact cause of the silver collapse on Friday is somewhat inconsequential (Warsh appointment, increased margin requirements), the concern for investors should be that the strongest asset in the market (up 160% since the end of October) could lose a third of its value in a matter of hours. I believe the selling was exacerbated by a combination of forced selling/liquidation by both the quant (CTA) and retail crowd, both of whom were likely late to the silver party. Just as the buying brought in more buying, the rapid price decline on Friday forced these same people to sell (especially any retail buyers who used leverage and/or margin to be involved). The ProShares Ultra Silver ETF (AGQ), which is 2x levered, and a likely preferred instrument for the retail crowd, hit a high of over 430 on Thursday and traded as low as 123 on Friday (an astonishing 71% decline).
The 2x levered silver ETF (AGQ), that caters to retail investors, declined by over 70% in 24 hours
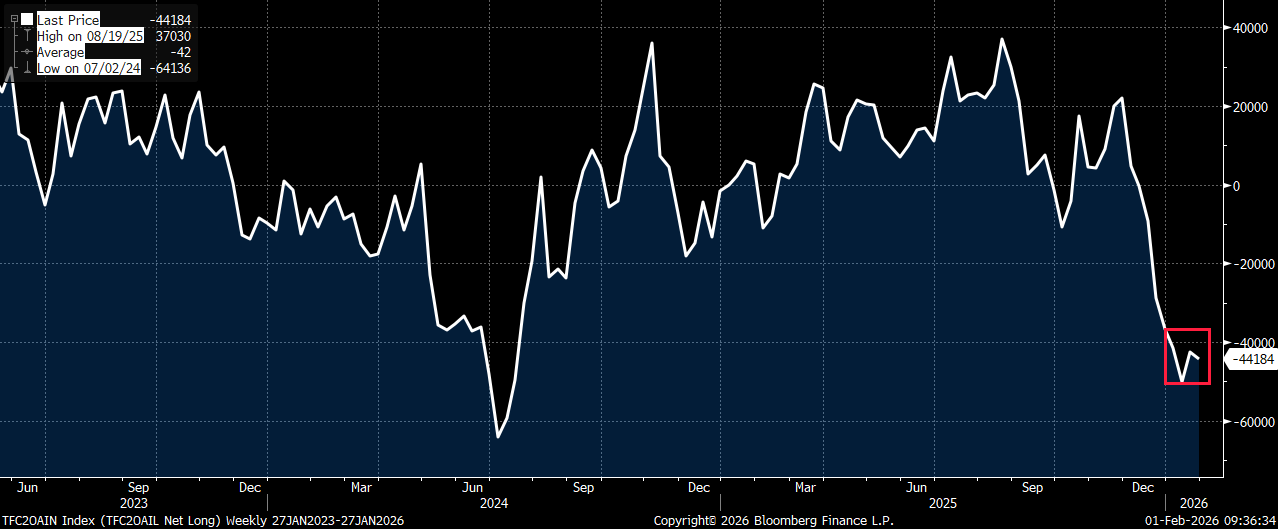
The silver move perhaps gives us a small glimpse into exactly how much quantitative and retail “crowding” there currently is in the market and exposes the risk of what could happen if we see a similar-type of risk-off move in the equity markets. Against that backdrop, index vol is already at its lowest level relative to single-name implied vol as our Portfolio Strategy team pointed out on Friday (here), net short VIX futures positioning went UP from an already high level based on data released on Friday, and we continue to see weakness in several former market momentum leaders (Bitcoin and ARKK for example).
Net short positioning in VIX futures by Institutional asset managers went UP even after the Greenland scare the previous week
Perhaps the volatility markets are finally starting to take notice? Last week, even though the S&P (SPY) was up 0.40%, February VIX futures climbed nearly 4% and were up 4 of 5 days. Again, I believe there is a quasi-floor to volatility at/near these levels, and should we see any type of a real risk-off trade in the main indexes, volatility is likely to move meaningfully higher given both the complacency and positioning. The divergence we started to see last week between SPY and volatility is perhaps signaling that the volatility markets are finally starting to price in some of those risks? I continue to favor buying VIX Feb 18th calls as a macro portfolio tail hedge for now. By next week I think those calls can be rolled out to the March 18th VIX calls (assuming we don’t see a major spike in volatility) without much decay. I imagine we see weakness on the Monday open (move higher in VIX), so please reach out to me to discuss specific strikes/calls to own after we open.
How to trade silver and gold from here?
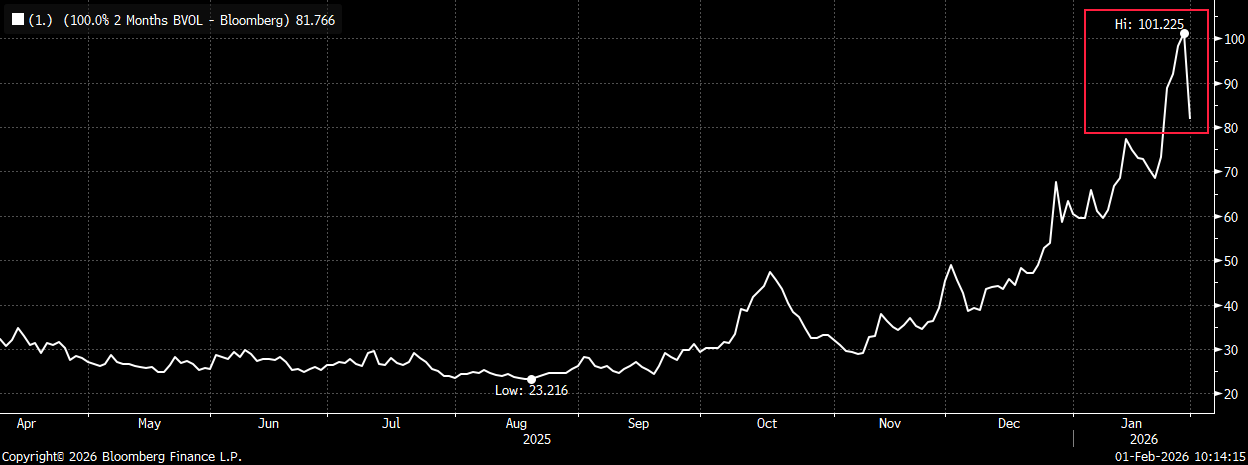
To give you an idea of just how strong silver was before the drop on Friday, it still closed UP 17% for the month (the ninth consecutive monthly gain) and it remains above the 50-day moving average, which it has been above since May. The bigger issue with trading SLV from here, especially via options, is that vol is still extremely elevated (although it did drop significantly WITH the price of silver the past two days). I believe this “cleansing” on Friday created an opportunity for people who may have missed the boat the first time to establish long positions since as a firm we remain bullish on the longer-term fundamentals. With implied volatility still elevated, and the price now significantly lower than where it traded on Thursday, I would consider using upside call spread risk-reversals, either here or at lower levels, to position for a move back higher over the next few months.
SLV still closed up 17% for the month and remains above the rising 50-day moving average
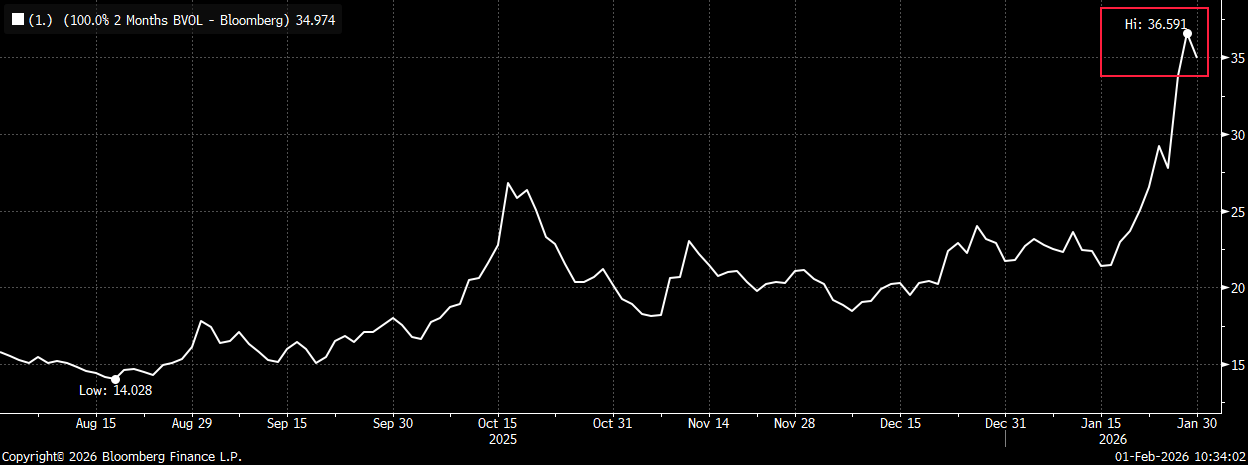
SLV 2-month (March) implied vol moved lower on the selloff, but remains well above normal levels
Here is an example of an upside SLV trade I would consider now:
Sell SLV March 20th 60 put
Buy SLV March 20th 85/110 call spread
Costs ~ $1.60 (based on Fri SLV close of $75.44)
Trade Details:
- Selling the 20% downside put, after the 30% decline, to buy the upside call spread that starts 12.5% higher and is capped to the upside at the highs from last week
- Trade offsets very elevated volatility by selling the “wings” to buy the closer to the money call
- Trade offers a nearly 15x to 1 upside payoff vs cost, while allowing a sizeable cushion to the downside on the put sale and after we have already seen a large decline
- Good entry-point trade for anyone who wanted to play for upside but may have missed the initial move
- Please reach out to me or the 22V sales team for updated pricing and execution capabilities
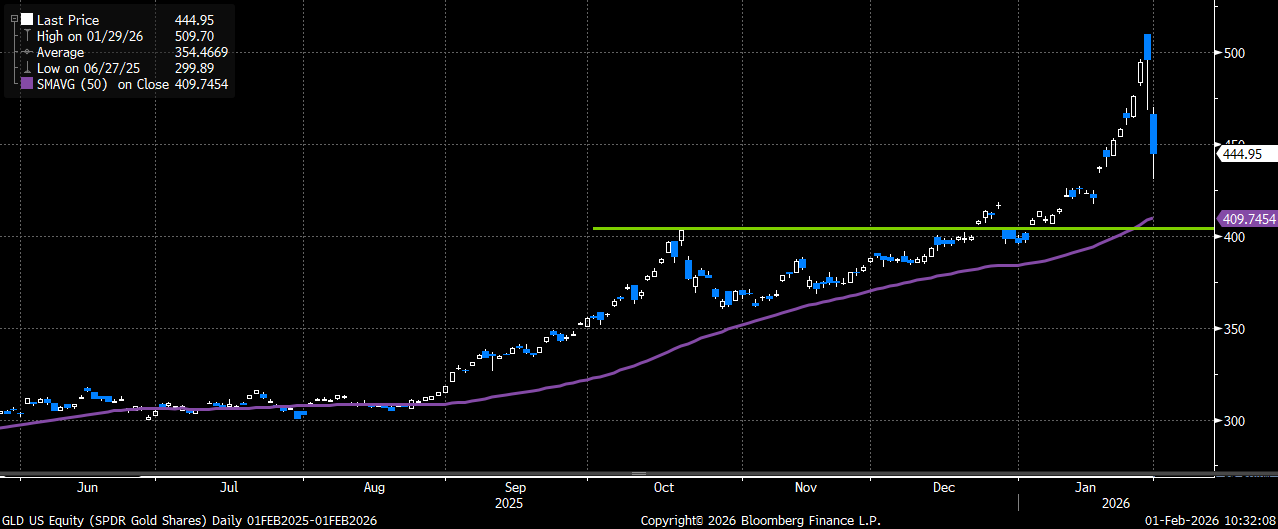
As far as gold goes, keep in mind the move higher was nowhere near as parabolic as the move we saw in silver. All the reasons why gold worked, and should continue to work, remain in place (weakening US$, global central bank buying, etc.). Even with the 10% decline on Friday, GLD too ended the month up a healthy 12.3% (its 6th consecutive monthly gain) and it also remains firmly above the rising 50-day moving average. If anything, we saw less of a decline in GLD 2-month volatility on the drop on Friday, so if looking to add upside exposure into this pullback, I also would consider low-cost upside call spread risk-reversals in GLD. I believe all signs now point to the 400-410 area in GLD as major support (level where it broke out above the Oct highs, 50-day, etc), so I would suggest using that strike as part of any upside risk-reversal trade.
Here is an example of an upside GLD trade I would consider now:
Sell GLD March 20th 410 put
Buy GLD March 20th 475/550 call spread
Costs ~ $2.50 (based on Fri GLD close of $444.95)
Trade Details:
- Selling the 8% downside put, after the 13% decline, to buy the upside call spread that starts less than 7% higher and is capped to the upside 24% higher by March expiry
- Trade offsets very elevated volatility by selling the “wings” to buy the closer to the money call
- Trade offers a nearly 30x to 1 upside payoff vs cost, while allowing a sizeable cushion to the downside on the put sale and after we have already seen a large decline
- Good entry-point trade for anyone who wanted to play for upside but may have missed the move
- Please reach out to me or the 22V sales team for updated pricing and execution capabilities
GLD should see strong support at the 400-410 level on a continued pullback (why I favor selling a put strike near there)
GLD 2-month implied vol remains very elevated